Article
Quasi-Stationary Strength of ECAP-Processed Cu-Zr
at 0.5
T
m
Wolfgang Blum1,*, Jiˇri Dvoˇrák2, Petr Král2, Philip Eisenlohr3 and Vaclav Skleniˇcka2 1 Department of Materials Science, Institute I, University of Erlangen-Nuremberg, Martensstr. 5,
D-91058 Erlangen, Germany
2 Institute of Physics of Materials, Czech Academy of Sciences, Žižkova 22, CZ-616 62 Brno, Czech Republic;
[email protected] (J.D.); [email protected] (P.K.); [email protected] (V.S.)
3 Chemical Engineering and Materials Science, Michigan State University, East Lansing, MI 48824, USA;
* Correspondence: [email protected]
Abstract: The influence of the grain structure on the tensile deformation strength is studied for precipitation-strengthened Cu-0.2%Zr at 673 K. Subgrains and grains are formed by equal channel angular pressing (ECAP) and annealing. The fraction of high-angle boundaries increases with prestrain. Subgrains and grains coarsen during deformation. This leads to softening in the quasi-stationary state. The initial quasi-stationary state of severely predeformed, ultrafine-grained material exhibits relatively high rate-sensitivity at relatively high stresses. This is interpreted as a result of the stress dependences of the quasi-stationary subgrain size and the volume fraction of subgrain-free grains.
Keywords:Cu-Zr; ECAP; deformation; quasi-stationary; subgrains; grains; coarsening
1. Introduction
Deformation of single crystals and large-grained polycrystals leads to generation of dislocations and subgrains with low-angle boundaries (LABs). Dynamic recovery counteracts the defect generation. The state at which the rate ˙ρ+of increase of densityρof free dislocations approximately equals the rate ˙ρ−ofρ-decrease,
˙
ρ+ ≈ρ˙−, (1)
is usually called steady state, stationary state or saturation stage (of flow stress) in the literature. We prefer the term quasi-stationary (qs) state [1], because slow changes of microstructure parameters (boundaries [2,3], particles, . . . ) lead to a drift of the quasi-equilibrium of the qs state that in turn causes slow changes of the qs deformation strength. By definition, there is a spectrum of qs states, depending on the microstructural parameters other thanρ. The qs states are important as upper limits of deformation strength at given structure of grains and particles.
The present work deals with the strength of a Cu-Zr alloy that is stabilized by particles and processed by equal channel angular pressing (ECAP). It is well known that ECAP processing leads into a qs state with refined grains and saturated hardness (compare [4–7]). This holds also for Cu-Zr [8–10]. When the ECAP-processed material is subjected to creep at elevated temperature of 673 K, new qs states are developed. The creep ductility is significantly enhanced compared to the coarse-grained (cg) alloy while the creep rate remains fairly low and has relatively low stress sensitivity. In the following section, we treat the evolution of deformation strength and microstructure of ECAP-processed Cu-Zr at 673 K in detail on updated data basis with the goal to better understand how grain refinement influences the qs deformation strength. We discuss the proposition that the qs strength of ultrafine-grained (ufg)
Cu-Zr significantly depends on the stress-dependent qs fraction of subgrain-free grains. There are indications that the variation of this fraction with stress may explain the relatively low stress sensitivity (high rate sensitivity) of the qs strength of grain-refined ufg Cu-Zr.
2. Experimental Details
Processing, microstructure, and creep testing have been described before [10]. The starting material was (cg) Cu-0.2 mass%Zr. Its material parameters are approximated by those of pure Cu provided in the data compilation of Frost and Ashby [11]: Burgers vectorb=2.56×10⁻¹⁰m, elastic shear modulusG=3.58×10⁴MPa, melting pointT
m =1356 K. The cg material was homogenized for
24 h at 1073 K and hot rolled. Billets of this material were solution treated at 1233 K for 1 h to give an initial grain size of 3.5×10⁻⁴m. The billets were predeformed byppasses of equal channel angular pressing (ECAP, Figure1) at room temperature on route BCto refine the grains. The predeformed
material is calledpCu-Zr. Due to particle hardening the grain size of the material is stable against static annealing at temperatures exceeding the test temperature 673 K [12]. The thermal treatment consisted of storage of the predeformed material at room temperature for up to several years followed by heating to and holding atTfor a few hours before deformation.
Figure 1.From ECAP billet to tensile creep specimen (numbers: lengths/mm).
Flat tensile creep specimens with gauge lengthl0and cross sectionS0were prepared as illustrated
in Figure1. Deformation in creep mode occurred in tension at temperatureT = 673 K = 0.5Tm
upon applying a load F, corresponding to an engineering stress σeng = F/S0. The change∆l of
the length was measured using LVDTs (from Hottinger Baldwin Messtechnik GmbH, Darmstadt, Germany) attached to the tensile rods near the specimen. The “true” straineresults as ln((l0+∆l)/l0)
(Elastic contribution to ∆l are neglected here because it is relatively small and nearly constant at constantFso that the elastic contribution ˙eelto the measured rate ˙eis generally negligible). Due to volume constancy and under uniform deformation of the gauge lengthl=l0+∆l, the cross sectionS
varies asS=S0l0/l=S0exp(−e)and the “true” stressσ, given byF/S, increases with strain as
σ=σeng exp(e). (2)
Observations of the grain structure were made by electron microscopy. Orientation maps derived from electron backscatter diffraction (EBSD, device from Oxford Instruments, High Wycombe, United Kingdom) were used to determine the grain size d as mean value of the spacings di,
used to analogously determine the subgrain sizewas mean value of the spacingswiof boundaries of
any kind.
3. Results
3.1. Influence of Predeformation
With increasing predeformation pthe deformation strength of pCu-Zr saturates, because the areal fraction fHAB of high-angle boundaries (HABs) increases up to a saturation level [9] where a
qs state is established due to dynamic equilibrium of storage and dynamic recovery of dislocations. This statement is consistent with the observation that the Vickers hardness saturates with increasing predeformationpatHV≈180 [9]; using the formulaσ/MPa≈3HV, this corresponds to a saturation flow stress of 540 MPa in ECAP. An increase offHABenhances storage as well as recovery of dislocations
because HABs are stronger dislocation obstacles and better dislocation sinks than LABs. The net effect on deformation strength depends on whether storage or recovery are the dominant factors (compare, e.g., [13]).
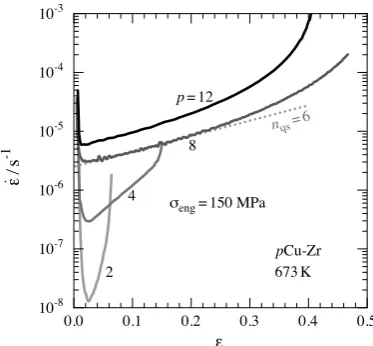
Figure2shows exemplary curves of the evolution of deformation resistance with strain at constant engineering stressσeng = 150 MPa for different amountspof ECAP predeformation. Deformation
starts with application of the loadF, and continues in creep mode when the creep stressσenghas been
reached. The starting phase of the tests is connected with work hardening as is visible from the sharp decrease of strain rate ˙ewithe. After strains of 0.02 to 0.05 the rate ˙eincreases. A trivial reason for
˙
e-increase lies in the increase ofσwithe(Equation (2)) causing the creep rate to increase in the qs state as ˙e ∝σnqs wherenqsis the qs value of the stress exponent. The dotted line in Figure2shows that
for severely predeformed Cu-Zr withp≥8 practically all of the ˙e-increase can be attributed to the increase ofσwhennqs=6 (as reported before [9]). This means that atσeng =150 MPa
• the specimens of 8/12Cu-Zr begin to deform in their qs state right from low strains in the order of 0.02, and
• changes of boundary and particle structures are negligible.
At about half the fracture strain the ˙e-increase accelerates. This indicates formation of local stress concentrations by external and internal necking during the fracture process.
σeng= 150 MPa
pCu-Zr p= 12
8
4
2
nqs= 6
10-8 10-7 10-6 10-5 10-4 10-3
0.0 0.1 0.2 0.3 0.4 0.5
ε
ε
⋅ /
s
-1
673 K
Figure 2.e˙versuseforpCu-Zr at 673 K,σ0=150 MPa in tension at constant load; dotted line: increase of ˙eexpected from increase ofσfornqs=6.
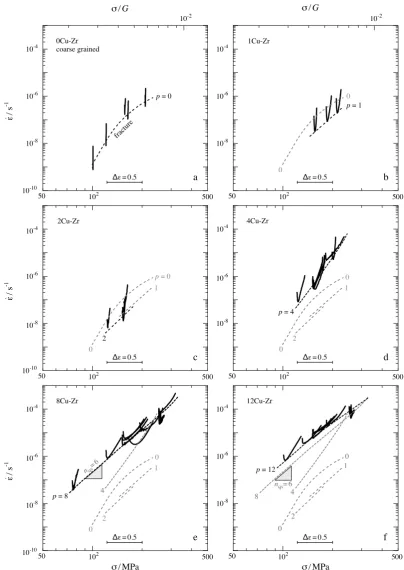
log ˙e−logσ-field (Figure3). According to Equation (2), logσincreases linearly withe. The scale-bars in Figure3show the extension of a strain interval∆eof 0.5. Figure3e confirms that most of the curves for 8Cu-Zr have slopes nearnqs=6 in the qs range above 150 MPa and follow a common trend given
by the dashed black line. For 12Cu-Zr this behavior is even more perfectly pronounced, indicating better homogeneity of the initial microstructure.
10-10 10-8 10-6 10-4 102 50 500 10-2 σ/ G
ε ⋅ / s -1 fracture 0Cu-Zr coarse grained a
p= 0
∆ε= 0.5
1Cu-Zr
b 10-8
10-6 10-4
σ/ G
∆ε= 0.5
p= 1 10-2
102
50 500
0
0
10-10 10-8 10-6 10-4
ε
⋅ /
s
-1 p= 0
2Cu-Zr
∆ε= 0.5 c
2 102 50 500 0 1 4Cu-Zr
10-8 10-6 10-4
∆ε= 0.5 d
p= 4
1 2 0 0 102 50 500 8CuZr
10-10 10-8 10-6 10-4
ε ⋅ / s -1 4 8Cu-Zr
∆ε= 0.5 e
p= 8
1
2
0
0
σ/MPa
102 500
50
nqs= 6 ∆ε= 0.5
∆ε= 0.5 10-8
10-6 10-4
102
50 500
σ/MPa
p= 12
8 4 0 0 1 2 12Cu-Zr f
nqs= 6
For lower stressesσ <150 MPa and forpCu-Zr withp ≤4 the slopes in Figure3are distinctly higher and different curves do not merge. One reason is tensile fracture. Figure3a shows that fracture occurs in cg Cu-Zr (i.e.,pCu-Zr withp=0), before a qs region has been developed. This means that the qs deformation strength cannot be measured in tension. Thus, the experimental values of the minimal creep rate are determined by fracture, and therefore constitute only upper bounds of the qs deformation strength. The same holds for predeformedpCu-Zr withp=1 to 4. (To determine the qs deformation strength, compression tests would be required in these cases in order to delay or suppress fracture). For ufg 8/12Cu-Zr the strains are too large to explain the non-merging of the curves at lowσ by fracture processes. Therefore this effect must be due to softening during creep. In Section3.3we provide an explanation of the softening in terms of dynamic coarsening of the microstructure.
In summary, one sees from Figure3that the qs deformation strength of Cu-Zr decreases at the test temperature 0.5Tmwhen the material is severely predeformed, the grains are refined, and the
areal fraction fHABof boundaries with high-angle character increases during creep.
3.2. Microstructure of 8Cu-Zr 3.2.1. Before Creep
Heating to and holding at test temperature before creep took a few hours. Figures4and5a illustrate the microstructure of 8Cu-Zr after annealing for a few hours at the test temperature. So these microstructures are representative for the microstructure at start of creep. From a micrograph, such as Figure4, the initial grain sized0of 8Cu-Zr was determined as 4.7×10⁻⁷m. From the 8Cu-Zr sample of
Figure5a the initial subgrain sizew0was determined as 1.5×10⁻⁷m. Noting that these are local values
that may vary from place to place and from specimen to specimen, the agreement with previously published data [10] and with data from the literature for severely predeformed ufg Cu-Zr [12,14,15] data is considered to be satisfactory. From the empirical formula
wcgqs ≈14b G/σ (3)
for cg Cu [16] and the estimate 540 MPa for the saturation strength in ECAP given above one gets a qs subgrain size of 2.4×10⁻⁷m. In view of the uncertainty of the empirical factor 14 entering Equation (3), the agreement with the measuredw0is considered satisfactory, too. This means that
w0may be interpreted as the qs value of the subgrain size in ufg 8Cu-Zr before creep, that is only
marginally influenced by the heating to test temperature.
a b
Figure 5. TEM of subgrains and Cu5Zr-precipitates in 8Cu-Zr after (a) annealing for 8 h at 673 K, (b) creep at 673 K,σeng=150 MPa to a fracture strain of≈0.5 (compare curve forp=8 in Figure2).
The Zr containing particles are essential in restricting grain coarsening [10,12,14]. They are present in homogeneous distribution after SPD ([14] and Figure5). Figure6shows electron diffraction patterns of (a) the Cu matrix with particles and (b) a large particle of composition Cu5Zr. A rough estimate
based on Equations (7)–(13) in [17] (using a mean particle radius of 4 nm, number of particles per area of TEM foil equal to 10, typical foil thickness of 200 nm) yields an Orowan stress for particle hardening of about 150 MPa at room temperature. However, at the test temperature the tiny particles are easily overcome by local and general climb of dislocations so that the particle hardening term is greatly reduced [17]. In the following, we neglect the direct influence of particles on the stress sensitivity of the deformation strength.
a b
Figure 6.Diffraction patterns of (a) Cu matrix (strong reflections) with Cu5Zr particles (weak reflections) and (b) a large Cu5Zr particle.
The spacing plot of Figure7showsw0andd0together with the qs spacings≈bG/σof dislocations
andwcgqsof boundaries in cg Cu. We assume that the qs spacings for cg Cu are valid also for Cu-Zr.
It is interesting to note that at low stresses the (dotted) qs dislocation spacing would be similar to the initial boundary spacingw0, meaning that the subgrains will tend to be virtually dislocation-free in
d. The grey area marks the range of possible subgrain coarsening under the simplifying assumptions that all grains are equiaxed and keep the same sized=d0throughout deformation. The solid black
line marks the qs boundary spacing in ufg 8Cu-Zr under these conditions. If this line were exactly valid, all grains would become subgrain-free during deformation for stresses<270 MPa. However, that is unrealistic because of (i) the wide distribution of HAB spacings (Figure 9) and (ii) dynamic grain growth (see below).
bG/σ
subgrain coarsening
dafter creep
coarse mean fine
w0 d0
wqs
10-8
10-7
10-6
10-5
102
σ
/
MPa
spacin
g
/
m
8/12Cu-Zr 673 K
cg
Figure 7.Initial spacingsw0(all boundaries) andd0(HABs only) inpCu-Zr withp≥8 in comparison to the qs spacingswcgqs of subgrains (Equation (3)) and≈ b G/σof free dislocations expected in coarse-grained Cu-base material; circles: HAB-spacings after deformation, triangles: HAB-spacings in regions with relatively fine and coarse grains, respectively; grey area: range of subgrain coarsening for d=d0.
3.2.2. After Creep
Figure8shows grain structures after creep at lowσ. There is a mixture of large and fine grain sections. The largest ones are much coarser than in the initial state (Figures4and7). Coarsening is also seen from the TEM micrograph of Figure5b after fracture atσeng=150 MPa in comparison to
Figure5a taken before creep. However, this is probably mainly due to subgrains growing fromw0
(Figure5a) in the attempt to attain the qs spacingwcgqs. Figure9shows the distributions of individual
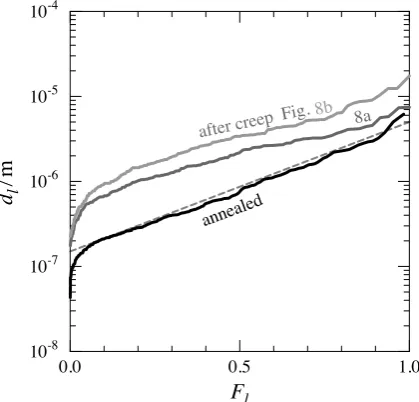
HAB-spacings determined from Figures4and8. We will use them as rough experimental input to the model presented in Section4.
a b
Figure 8. Coarsened grains after slow creep atσeng =(a) 75 MPa and (b) 50 MPa (grey triangles in Figure7); slight color variations in some coarsened grains indicate subgrain formation during creep; insert: color code for crystallographic grain normals in standard triangle.
10-8 10-7 10-6 10-5 10-4
0.0 0.5 1.0
annealed
8a Fig.
F
ld
l/
m
8b after creep
Figure 9.Individual HAB-spacingsdl(l=1, 2, . . .) versus cumulative spacing fractionFlevaluated for 8Cu-Zr in annealed state from Figure4and after slow creep from Figure8a,b. Grey dashed line: linear approximation for annealed state.
3.3. Strength Evolution of 8/12Cu-Zr with Strain
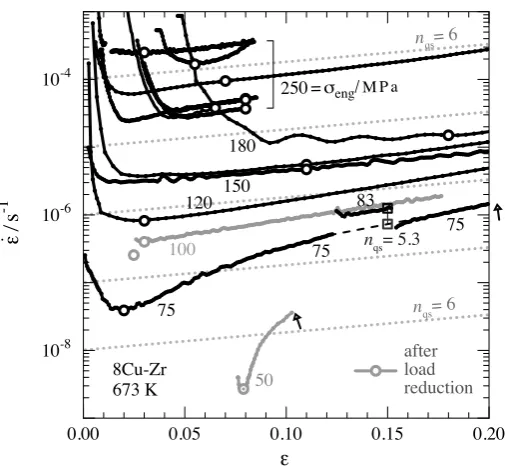
Figure10displays the ˙e-evolution of ufg 8Cu-Zr from the overview of Figure3e in greater detail as function of straine. For comparison, the grey dotted lines show the increase of ˙ewitheexpected for qs deformation withnqs≈6 at constantσeng. The scatter in the series of tests atσeng =250 MPa indicates
that the thermomechanical pretreatment was not perfect and led to some variations of microstructures and strengths. The intermediateσeng-increase to 83 MPa in the test starting at 75 MPa causes a jump in
the qs level of ˙eate≈0.15 (see black squares) which corresponds tonqs=5.3. This is in reasonable
agreement withnqs ≈6. At high (true) stressesσ>270 MPa and strain rates>10−4s−1the exponent nqs appears to gradually increase with σbeyond 6. This is seen from the test of Figure11with a series of load reductions compensating the increase ofσwithe(Equation (2)). When the abscissae in Figure11a is exchanged forσin Figure11b, all the branches withσeng <250 MPa shift to the left
and superimpose. A common ˙e–eline describes both the superimposed curves and their (dashed) connection to the final branch withσeng=250 MPa. The slope of the dashed connection is given by
after load reduction
100
250 =σeng/M P a
75
75
75 83
nqs= 5.3
50 180
120 150
10-8
10-6
10-4
0.00 0.05 0.10 0.15 0.20
ε
ε
⋅
/
s
-1
8Cu-Zr 673 K
nqs= 6
nqs= 6
Figure 10.e˙ of 8Cu-Zr as function ofeat constantσeng; black circles: identified qs rates; grey: after
σeng-reduction of from 250 MPa; see Figure8for microstructure at black arrows.
σeng/MPa =
245 250
250
250
250
a
8 Cu-Zr673 K
230 10-4
10-3
0.0 0.1 0.2 0.3
ε
ε
⋅ /
s
-1
238
n= 10.4 673 K
8 Cu-Zr
10-4 10-3
250 300 338
σ/MPa
ε
⋅ /
s
-1
b
Figure 11.e˙-evolution of 8Cu-Zr as function of (a)e, (b)σ=σengexp(e)in test withσeng-reductions of increasing magnitude to keepσ=σengexp(e)about constant.
At lowσ<150 MPa the qs strength evolution can no longer be explained only in terms of the slow increase ofσ at constant σeng and fracture (see Figures 3and10. Therefore changes in the
3.4. Quasi-Stationary Strength of 8/12Cu-Zr
The circles in Figure10indicate the quasi-stationary strengths of ufg Cu-Zr at the grain/phase structure present at the beginning of creep. Their choice results from a compromise of
• providing enough strain to fill the material with a qs dislocation structure (spacing of free dislocations and subgrain size) while
• avoiding grain coarsening at large strains.
Taking into account that subgrain growth by migration of LABs is a relatively fast process needing strains in the order of 0.05 to 0.1 and that only limited subgrain growth is possible before all LABs were absorbed at the HABs of mean spacingd0(Figure7), we expect that at the rather low strains
of the qs states marked by circles in Figure10only marginal grain coarsening will have happened and that sufficiently small grains will have become subgrain-free by subgrain coarsening, except perhaps at the lowest stresses. Figure12a shows the circles from Figure10as function of stressσfor ufg 8Cu-Zr. Within scatter, the qs strengths confirm the power law with a stress exponentnqs = 6,
already mentioned in Section3.1, for the stress range 70 MPa<σ <260 MPa. The square symbols from the load change test demonstrate the moderate softening effect resulting from dynamic (sub)grain coarsening mentioned before (Figure7). An analogous procedure as for 8Cu-Zr leads to Figure12b for ufg 12Cu-Zr. There is no significant difference between 8Cu-Zr and 12Cu-Zr except lesser scatter for 12Cu-Zr at (true) stresses near 270 MPa (corresponding toσeng=250 MPa), probably due to better
homogeneity of the grain structure of 12Cu-Zr.
(a) 8Cu-Zr qs strength 10-8
10-6 10-4
100 σ/MPa
ε
⋅ /
s
-1
40 400
(b) 12Cu-Zr
10-8
10-6
10-4
100
σ/MPa
ε
⋅ /
s
-1
40 400
qs strength
Figure 12. Quasi-stationary strengths of (a) 8Cu-Zr (symbols from Figure7) and (b) 12Cu-Zr; grey dotted lines connect data from the same test.
4. Discussion
The primary transients in ufg materials are usually small because the high density of HABs limits the free path of dislocations effectively and leads to high rates of dislocation generation. They are roughly estimated [18] as dρ+/de = 2M/(bΛ) with Λ≈d0≈5×10⁻⁷m and Taylor
factor M = 3 for polycrystals. Without concurrent dynamic recovery it needs a strain interval ∆e+≈M−1(b/d) (σ/G)2∆ρ+to generate the full qs dislocation densityρqs ≈b−2(σ/G)2in grains
of sized = d0. This means that at a stress of 150 MPa a plastic strain of∆e+ =0.011 is sufficient to generate the full qs dislocation density. This value is consistent with the primary transients extending over strain intervals>0.01 in creep atσeng =150 MPa (Figure10) and confirms that a qs state in the
sense of Equation (1) is reached shortly after the ˙e-minimum.
leads to a relatively high rate sensitivity (equivalent to low stress sensitivitynqs) of the qs strength
(Section3.4). The qs stress exponentnqs≈6 and a high activation energy remind one of the power
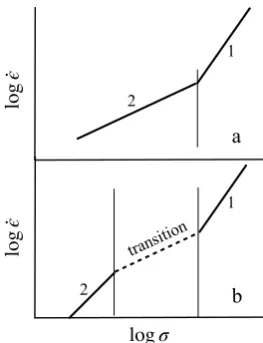
laws of steady state creep that are explained by specific mechanisms of qs creep, characterized by a certain stress exponentnqsand rate sensitivity 1/nqs(see, e.g., [19–21]). For example, mechanisms 1
and 2 in Figure13a might represent climb-controlled steady state creep and superplastic deformation, respectively. Following this approach, the power law range in Figure12would correspond to some mechanism 2.
1
1
2
transition
log
·ϵ
log
·ϵ
logσ
a
b 2
Figure 13.Mechanisms 1 and 2 of qs deformation with (a) abrupt, (b) smooth transition.
However, there is an alternative possibility [22]. The investigated region with relatively high rate sensitivity may represent a smoothtransitionbetween a mechanism 1 dominating at highσand a mechanism 2 dominating at lowσ (Figure13b). A transition region must be expected from the fact that the spacings of HABs have a wide distribution due to coexistence of small and large grains. According to the microstructural data of Figure7, mechanism 1 would represent qs deformation with subgrain-bearing grains, while mechanism 2 would represent qs deformation with subgrain-free grains (This makes a qualitative difference to Ghosh and Raj [23] who studied the influence of a distribution of grain sizes in relation to the transition between superplastic and normal behavior, but assumed that both mechanisms of deformation are concurrently active in each grain). In the (dashed) transition region both types of grains would be present. In qualitative form this possibility has already been applied to microcrystalline Cu at 0.35Tm[24]. A semi-quantitative model was provided in [25] and
applied to microcrystalline Cu at 0.42Tm[26]. To apply this model to the present case we need the qs
strengths of grains with and without subgrains and the distribution of grain volumesi=1, 2, . . . with spacingsdibetween the HABs for ufg Cu-Zr at 0.50Tm. This warrants assumptions based on educated
guesses. Following [25,26] we make these choices:
• The cumulative volume fractionFdwith HAB-spacings≤dis described by the thin straight line
in Figure9(grey, dashed).
• The qs strength ofsubgrain-freegrains is quantified by the relation ˙
e∝d4σ8 (4)
from [27]; the f-factors were set to 0.19 (f-factors = 1 apply in the limiting case where all dislocations are lying at HABs, all are in dipolar configuration ready for recovery, and have unrelaxed stress fields; as this is unrealistic,f-values distinctly less than 1 are sensible). This choice yields the two dashed grey lines in Figure14a for the presentFdand the limiting assumptions of
equal stress (iso-stress) or equal strain rate (iso-rate) in all grains.
• The qs strength of crystal volumeswithsubgrains of sizewcgqs(σ)is estimated by the power law ˙
stress forσ>270 MPa (Figure12). The position of the line is supported by the result for 2Cu-Zr in Figure2: The grain size in 2Cu-Zr is so large that all grains contain subgrains; at 150 MPa the upper bound of the initial qs strain rate of 2Cu-Zr is near 10−8s−1(Figures2and3c); this is consistent with the (grey dotted) estimate for subgrain-containing grains in Figure14a.
8/12Cu-Zr
subgrain-free
with subgrains
a
n=15n=8
n=8
iso-stress
10-8
40 400
10-6 10-4
100
ε
⋅ /
s
-1
iso-strain
iso-stress
0.0
40 400
0.5 1.0
100
σ/MPa
FV
iso-strain
b
Figure 14.(a) Strain rate and (b) volume fraction of subgrain-free grains as function of stressσin qs deformation; filled circles: qs data for 8/12Cu-Zr from Figure12a,b, solid lines: model.
The solid black lines in Figure14show the result of the modeling. The iso-rate assumption enforces a redistribution of stress;σ-concentration to hard grains reduces the stresses in soft grains. This stress shielding hinders deformation of large, soft grains and so raises the flow stress level compared to the iso-stress case. The realistic situation lies between the two limits of iso-stress and iso-rate. Comparison of the model lines with the measured data shows reasonable agreement, in particular with regard to the minimal stress sensitivitynqs(maximal rate sensitivity 1/nqs) in the transition from subgrain-free
to subgrain-containing grains.
We note that the difference between the two model lines is rather small in the transition region and that the choice of the solid grey straightFd-line in Figure9has relatively little influence there.
The reason may lie in a compensation effect. On the one hand, subgrain-free grains deform faster at a given stress when their grain sizedincreases (Equation (4)). On the other hand, the fraction of subgrain-free grains decreases with increasingdas more grains develop subgrains. This means that grain coarsening may not always have the dramatic effect expected from thed4-term in relation (4).
5. Summary
• The quasi-stationary (qs) strength of particle-strengthened ufg Cu-Zr prepared by ECAP and annealing was determined at 0.5Tmin deformation (creep) at constant load.
• At σeng = 150 MPa increase of the fraction fHAB of high-angle boundaries (HABs) leads to
softening and ductilization. So HABs have a net softening effect at test conditions.
• The (HAB) grain structure of ufg Cu-Zr is relatively stable at 0.5Tm. At low ˙edynamic grain coarsening sets in and leads to softening.
• The initial qs strength of ufg Cu-Zr measured before massive grain coarsening is described by a power law ˙e ∝ σn with stress exponentnqs ≈ 6, corresponding to a relatively high rate
sensitivity 1/nqs≈1/6=0.17, around ˙e=10−4s−1and the relatively high stressσ=170 MPa= 4.7×10⁻³G.
• Analysis of the grain structure indicates that an increasing fraction of small grains becomes subgrain-free in the qs state as the stress decreases.
• The relatively high qs rate sensivity of ufg Cu-Zr is modeled as a result of the variation of the fraction of relatively soft subgrain-free grain volume with stress.
Author Contributions:Conceptualization, W.B. and P.K.; methodology, V.S., J.D., P.K. and P.E.; software, W.B. and P.E.; validation, P.K., J.D.; formal analysis, W.B.; investigation, V.S., J.D., P.K.; resources, J.D.; data curation, J.D., P.K. and W.B.; writing–original draft preparation, W.B.; writing–review and editing, W.B., P.K. and P.E.; visualization, W.B; J.D., P.K., W.B. and P.E.; supervision, W.B. and V.S.
Conflicts of Interest:The authors declare no conflict of interest.
Abbreviations
The following abbreviations are used in this manuscript:
qs quasi-stationary
ECAP equal channel angular pressing ufg ultrafine-grained
cg coarse grained LAB low-angle boundary HAB high-angle boundary
TEM Transmission electron microscopy
References
1. Blum, W.; Dvoˇrák, J.; Král, P.; Eisenlohr, P.; Skleniˇcka, V. What is stationary deformation of pure Cu? J. Mater. Sci.2014,49, 2987–2997. [CrossRef]
2. Mughrabi, H. Implications of non-negligible microstructural variations during steady state deformation. Z. Metallkd.2005,96, 546–551. [CrossRef]
3. Blum, W.; Eisenlohr, P. Structure evolution and deformation resistance in production and application of nanostructured materials—The concept of steady-state grains. Mater. Sci. Forum2011,683, 163–181. [CrossRef]
4. Valiev, R.Z.; Korznikov, A.V.; Mulyukov, R.R. Structure and properties of ultrafine-grained materials produced by severe plastic deformation. Mater. Sci. Eng. A1993,168, 141–148. [CrossRef]
5. Iwahashi, Y.; Horita, Z.; Nemoto, M.; Langdon, T. The process of grain refinement in equal-channel angular pressing.Acta Mater.1998,46, 3317–3331. [CrossRef]
6. Valiev, R.; Islamgaliev, R.; Alexandrov, I. Bulk nanostructured materials from severe plastic deformation. Progr. Mater. Sci.2000,45, 103–189. [CrossRef]
7. Estrin, Y.; Vinogradov, A. Extreme grain refinement by severe plastic deformation: A wealth of challenging science.Acta Mater.2013,61, 782–817. [CrossRef]
9. Dvorak, J.; Kral, P.; Kvapilova, M.; Svoboda, M.; Sklenicka, V. Microstructure stability and creep behaviour of Cu-0.2wt.%Zr alloy processed by equal-channel angular pressing. Mat. Sci. Forum2011,667–669, 821–826. [CrossRef]
10. Skleniˇcka, V.; Dvoˇrák, J.; Král, P.; Svoboda, M.; Kvapilova, M.; Langdon, T. Factors influencing creep flow and ductility in ultrafine – grained metals. Mater. Sci. Eng. A2012,558, 403–411. [CrossRef]
11. Frost, H.J.; Ashby, M.F.Deformation-Mechanism Maps; Pergamon Press: Oxford, UK, 1982.
12. Neishi, K.; Horita, Z.; Langdon, T.G. Achieving superplasticity in ultrafine-grained copper: influence of Zn and Zr additions. Mater. Sci. Eng. A2003,352, 129–135. [CrossRef]
13. Li, Y.; Zeng, X.; Blum, W. Transition from strengthening to softening by grain boundaries in ultrafine-grained Cu. Acta Mater.2004,52, 5009–5018. [CrossRef]
14. Amouyal, Y.; Divinski, S.; Estrin, Y.; Rabkin, E. Short-circuit diffusion in an ultrafine-grained copper–zirconium alloy produced by equal channel angular pressing. Acta Mater. 2007,55, 5968–5979. [CrossRef]
15. Wongsa-Ngam, J.; Wen, H.; Langdon, T.G. Microstructural evolution in a Cu–Zr alloy processed by a combination of ECAP and HPT.Mater. Sci. Eng. A2013,579, 126–135. [CrossRef]
16. Blum, W. High-Temperature Deformation and Creep of Crystalline Solids. InPlastic Deformation and Fracture of Materials; Mughrabi, H., Ed.; VCH Verlagsgesellschaft: Weinheim, Germany, 1993; pp. 359–405.
17. Reppich, B. Particle Strengthening. InPlastic Deformation and Fracture of Materials; Mughrabi, H., Ed.; VCH Verlagsgesellschaft: Weinheim, Germany, 1993; pp. 311–357.
18. Li, Y.J.; Mueller, J.; Höppel, H.; Göken, M.; Blum, W. Deformation kinetics of nanocrystalline nickel. Acta Mater.2007,55, 5708–5717. [CrossRef]
19. Mukherjee, A.; Bird, J.; Dorn, J. Experimental Correlations for High-Temperature Creep.ASM Trans. Q.1969, 62, 155–179.
20. Cadek, J.ˇ Creep in Metallic Materials; Elsevier: Amsterdam, The Netherlands, 1988.
21. Kassner, M.; Pérez-Prado, M.T. Five-Power-Law Creep in Single Phase Metals and Alloys. Prog. Mater. Sci.
2000,45, 1–102. [CrossRef]
22. Blum, W.; Eisenlohr, P. A simple dislocation model of the influence of high-angle boundaries on the deformation behavior of ultrafine-grained materials. In15th International Conference on the Strength of Materials (ICSMA-15); IOP Publishing: Bristol, UK, 2010; Volume 240, pp. 1–4. [CrossRef]
23. Ghosh, A.K.; Raj, R. Grain size distribution effects in superplasticity. Acta Metall. 1981, 29, 607–616. [CrossRef]
24. Blum, W.; Dvoˇrák, J.; Král, P.; Eisenlohr, P.; Skleniˇcka, V. Effect of grain refinement by ECAP on creep of pure Cu. Mater. Sci. Eng. A2014,590, 423–432. [CrossRef]
25. Eisenlohr, P.; Blum, W. Maximal strain rate sensitivity of quasi-stationary deformation strength when subgrain size matches grain size. J. Mater. Sci. Technol.under review.
26. Blum, W.; Dvoˇrák, J.; Král, P.; Skleniˇcka, V. Dynamic grain coarsening in creep of pure Cu at 0.42 Tm after predeformation by ECAP.Mater. Sci. Eng. A2018,731, 520–529. [CrossRef]