Physics with the Belle detector
Pavel Pakhlov1,2,a
1Institute for Theoretical and Experimental Physics, Moscow, Russia
2Moscow Institute of Physics and Technology, Moscow region, Russia
Abstract.A summary of the experimental results obtained in the Belle experiment and future prospects of heavy flavor physics at the super B factory is presented.
1 Introduction
The Standard Model (SM) is one of the best experimen-tally verified physics theories. Since its establishment the SM managed to overcome all experimental tests and pro-vide a good description for all processes in a wide energy range up to the scale probed in energy frontier experiments at LHC. The observation of the Higgs boson [1], the last fundamental particle of the SM that escaped the detection for decades, marked a triumph of the Standard Model.
Despite the great success in describing the matter and forces of nature, the SM is obviously not a complete the-ory. It fails to resolve some intrinsic problems, including the instability of the fundamental scale of weak interac-tions against radiative correcinterac-tions, and leaves unanswered many fundamental questions, such as origin of gauge groups with independent coupling constants, fermion mass and mixing hierarchy etc. This suggests that the SM is only an effective theory valid up to a certain accuracy of tests or up to some energy scale. It is widely believed that the physics beyond the SM can be observed in precision or energy frontier experiments in the near future.
The quark sector of the SM is particularly rich in the SM puzzles and the largest contributor in terms of num-ber of free parameters of the model. This sector poten-tially can reveal New Physics (NP) effects, and the mea-suring of the quark mixing parameters provides a major test of this sector of the SM, in particular of the Cabibbo-Kobayashi-Maskawa (CKM) description of flavor chang-ing currents [2] andCPviolation.
Although CKM mixing does provide an only source forCP violation – one of the Sakharov’s conditions for the evolution of a matter-dominated universe [3], the mag-nitude of the matter-antimatter asymmetry cannot be ex-plained solely by the CKM mechanism. This may indi-cate that some hidden mechanism exists at a higher en-ergy scale. Flavor physics is a promising tool for NP searches through quantum loop effects. Rare decays, neu-tral meson-antimeson mixing andCPviolation are
poten-ae-mail: [email protected]
tially subject to NP virtual corrections even if the NP scale is above those accessible at today experiments.
The major information about the CKM matrix can be obtained in the study of B mesons, thus providing the stringent test of the SM in the quark sector. This was the main motivation for construction of two B factory ex-periments, Belle and BaBar. In the previous decade both experiments have performed many precise and indepen-dentmeasurements of the CKM parameters. The under-lying idea is to check the overall consistency of the CKM framework; any significant discrepancy between various measurements could be interpreted as potential NP effects. These experiments have confirmed the complex phase of the CKM matrix as the main source ofCPviolation with high precision. Future experiments at the Super Flavor Factories, such as the Belle II experiment at SuperKEKB, are scheduled to address the open questions and perform even more precise tests.
2 Belle experiment
The Belle detector [4], located at the collision point of the e+e−asymmetric-energy collider KEKB, is a large-solid-angle magnetic spectrometer. Belle was designed and op-timized for the observation ofCPviolation in theBmeson system. Its large coverage, precise vertex and momentum measurement for charged tracks, good particle identifica-tion, and few-percent precision electromagnetic calorime-try as well as effective muon andK0
L detection allow for many other searches apart from the study ofCPviolation inBdecays. Plenty of outstanding results are attributable both to the good detector operation and to the excellent performance of the KEKB collider. A world-record lu-minosity of 2.1×1034cm−2s−1, more than twice the de-sign luminosity, was achieved for the KEKB accelerator. Before stopping the operation in 2010 to give way to the upgrade, the Belle experiment collected more than 1 ab−1 of data over various bottomonium resonances. The Belle data sample is the world largest for theΥ(2S),Υ(4S) and Υ(5S) resonances.
DOI: 10.1051/
C
Owned by the authors, published by EDP Sciences, 2014 /2 01
epjconf 4 7200019
This is an Open Access article distributed under the terms of the Creative Commons Attribution License .0, which permits unrestricted use, distribution, and reproduction in any medium, provided the original work is properly cited.
The results presented here are mostly based on the analysis of the fullΥ(4S) data sample, corresponding to 772×106BBpairs, collected with the Belle detector.
3 Unitarity Triangle measurements at Belle
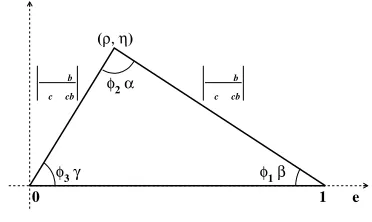
The unitary relations of the CKM matrix can be repre-sented as Unitarity Triangles (UT) in the complex plane. One of these triangles, that visualizes the unitarity relation between the first and third columns of the CKM matrix,
VtdVtb∗ +VcdVcb∗ +VudVub∗ =0, (1)
is the most important forCPviolation studies in Bd de-cays (see Fig. 1). Many of the important results described below can be depicted as constraints in this UT, including measurements of its angles and lengths of its sides.
1
0 e
(ρ, η)
φ3γ
φ2α
φ1β
b
c cb
b
c cb
Figure 1.Unitarity triangle.
The measurement of two angles (φ1 andφ2) is based on the extracting the amplitudes of the indirect (arising due to interference between decays with and without mix-ing)CPviolation asymmetry in particular decay modes. Such measurements require to determine the difference of lifetimes of twoBmesons, coherently produced inΥ(4S) decays. In energy-asymmetrice+e− collisions at KEKB, theΥ(4S) is produced with a Lorentz boost ofβγ=0.425 along the beam axis. SinceBmesons are approximately at rest with respect to theΥ(4S), we can measureΔtby mea-suring the displacement between the twoBmeson decay vertices in thezdirection.
3.1 sin(2φ1) fromB0 →(cc¯)K0
The most precise determination of the angle φ1 (also known as β) is provided by the measurement of the mixing-inducedCPviolation inB0→(cc¯)K0decays:
ACP(Δt)=N(B
0→(cc¯)K0)−N(B0→(cc¯)K0)
N(B0→(cc¯)K0)+N(B0→(cc¯)K0) =sin 2φ1sin (ΔmdΔt)+Acos (ΔmdΔt). (2)
These decays, often referred to as “golden modes”, are dominated by the Cabibbo-favored tree diagramb → ccs¯ with an internalW boson emission. The leading penguin contribution to these final states has the same weak phase within a few per cent accuracy. This makes the second
term in Eq. 2 vanishing to a very good approximation. Be-sides theoretical clarity, these channels also offer experi-mental advantages because of the relatively large branch-ing fractions (∼10−3) and the presence of narrow reso-nances in the final state, which provides a powerful sup-pression of combinatorial background.
Belle has presented the final result on sin(2φ1) using the fullΥ(4S) data set [5]. In addition to more data, sig-nificant enhancement in the reconstruction efficiency with the improved track reconstruction algorithm allows one to get the record statistical accuracy of the result. Moreover, special efforts were made to reduce the systematics errors of the measurement. The CP eigenstates considered in the analysis are J/ψK0
S, ψ(2S)KS0,χc1KS0 (CP˜-odd), and J/ψK0
L (CP˜-even). Figure 2 demonstrates the achieved signal purity. For the selected candidate events the neu-tralBflavor (q=±1) is identified from the decay products of the accompanyingBmeson based on the information on the charge of daughter leptons, kaons, baryons, and pions.
1 2 3
5.2 5.22 5.24 5.26 5.2 5.3
ll com ined B→ ψ B→ψ(2 ) B→χc1 Fit result
(a)
Mc( e c2)
vents
1
Me
c
2
ata B→ ψ real ψreal real ψfa e fa e ψ
( )
pB( e c)
vents
5
Me
c
1 2 3 4 5
.4 . 1.2 1.6 2
Figure 2.a)Mbcdistribution forB0→J/ψKS0(black),ψ(2S)KS0
(blue), andχc1KS0(magenta); the superimposed red curve shows
the fit result for all modes combined. b) The p∗Bdistribution for
B0 → J/ψK0
L candidates with the results of the fit (open
his-togram), and different background sources.
Figure 3 shows the Δt distributions and time-dependent asymmetries for good flavor tag quality events for bothCPodd andCPeven final states. The sign of the asymmetry for the oppositeCPeigenvalues is flipped, as expected. The observed asymmetry picture is consistent with the absence of the directCPviolation.
The measuredCPviolation parameters from the Eq. 2 are sin(2φ1)=0.667±0.023 (stat) ±0.012 (syst) andA= 0.006±0.016 (stat)±0.012 (syst). This represents the most precise determination of mixing-inducedCPviolation in a Bmeson decay, and hence provides a solid reference point for the SM that can be used to search for evidence of NP.
3.2 Measurement of the angleφ2
vents
.5
ps
5 1 15 2 25 3 35 4
t (ps)
Δ
6 4 2 2 4 6
symmetry
.6 .4 .2 .2 .4 .6
vents
.5
ps
5 1 15 2 25
t (ps)
Δ
6 4 2 2 4 6
symmetry
.6 .4 .2 .2 .4 .6
Figure 3. The background-subtracted Δtdistribution (top) for
q= +1 (red) andq=−1 (blue)B0→(cc¯)K0events and
asym-metry (bottom) for good tag quality events for allCP-odd modes combined (left) and theCP-even mode (right).
tree diagram (Vtd instead ofVub). This causes a deviation of the amplitude of indirectCPasymmetry from sin 2φ2 and a non-zero directCP asymmetry. The angleφ2 can be extracted following the idea of M. Gronau and D. Lon-don [6] using the isospin relation among branching frac-tions andCPasymmetries ofB0→π+π−,B0→π0π0, and B+ → π+π0 decays. The method allows to constrain the contribution from the penguin amplitude generally with an eight-fold ambiguity.
d b
-d
-d u -u
W
B0
π+
π
-b
d b
-d
-d u -u qi
-W
-B0
π+
π
-g b
Figure 4.Feynman diagrams forB0→π+π−decays.
This decay B0 → π+π− has the simplest two-body topology and was the first with well establishedCP asym-metry [7]. However, the large observed directCP vio-lation, and large branching fraction for B0 → π+π− [8] suggest that the penguin contribution to this final state is large, thus complicating the extraction of φ2. Using the full data set Belle measured the CP asymmetry in B0 → π+π−quite precisely [9]: A= +0.33±0.06±0.03 andS = −0.64±0.08±0.03 (the world’s most precise measurement of time-dependentCPviolation parameters inB0→π+π−!). Figure 5 shows the observedΔt distribu-tions for theB0→π+π−events tagged asB0andB0, and observed asymmetry. However, because of trigonometri-cal ambiguities in extraction ofφ2(see Fig. 6), Belle only managed to exclude the region 23.8◦< φ2<66.8◦at 68% CL from this modes.
Events / (1.5 ps)
50 100 150 200 250 300
1
1
t (ps)
Δ
-7.5 -5 -2.5 0 2.5 5 7.5
Asymmetr
y
-0.5 0 0.5
Figure 5. Background subtracted time-dependent fit results for
B0→π+π−. Top: theΔtdistribution forB0(red) andB0(blue)
tags. Bottom: asymmetry for good tag quality events.
)
°
(
2 φ
0 30 60 90 120 150 1
1 - CL
0.1 0.2 0.3 0.4 0.5 0.6 0.7 0.8 0.91
Figure 6.Difference 1−CLfor a range ofφ2from Belle’sB→ ππanalysis.
We are lucky to get quite high sensitivity onφ2 from theB→ ρρdecays, where the penguin contribution turns out to be small. This final state is much more difficult for a experimental study because of two wide vector mesons in the final state. As theCPeigenvalue for B0 → ρ+ρ− is (−1)L (L = 0, 1, 2), it is necessary to separate the two oppositeCPcomponents through an angular analysis. The later demonstrates that aCP-even component domi-nates, and the opposite component can be safely ignored. The constraint on this angle from the last Belle B → ρρ study [10] with the full data set isφ2=(84.9±12.9)◦.
derived the constraint 68◦ < φ2 <95◦at 68% CL for the solution consistent with the SM [11].
The current world average ofφ2 [12] including mea-surements of these three modes from Belle and BaBar, (85.4+4.0
−3.8)◦, is quite precise. However, forB→ρπmodes Belle has not still published the final result with the full data set, and it is important to have these updated results soon.
3.3 Measurement of the angleφ3
The UT angleφ3 relies on the measurement of directCP violation inB+ → D0K+decays caused by interference between the two contributing amplitudes with different CKM phases (Fig. 7), if bothD0andD0mesons decay to a common final state. The method is theoretically clean due to the absence of loop contributions, however, the color suppressed amplitude (Fig. 7, right) is almost an order of magnitude smaller, hence resulting in a smallCP asymme-try, which complicates the extracting ofφ3. There are ba-sically three methods to measure: The GLW method [14] uses the D0 decays inCP-even andCP-odd final states likeK+K−orK0
Sπ0. The ADS method [15] is based on doubly-Cabibbo suppressed decays likeD0→K+π−; The GGSZ method [16] is based on a Dalitz plot analysis of the three-body decays ofD0decays such asD0 → K0
Sπ+π−. The last method provides the highest statistical power for measuringφ3.
u b -s -u c -u W B+ K+ -D0 cb s u b -u -u s -c W -B+ D0 K+ b cs
Figure 7.Feynman diagrams forB+→D0K+decays.
In the GGSZ method the amplitude for B+ → D0(K0
Sπ+π−)K+ decay as a function of Dalitz plot vari-ablesm2
+=mK20 Sπ+
andm2 −=mK20
Sπ−
is given by
fB+= fD(m+2,m−2)+rBeiφ3+iδfD(m−2,m+2), (3)
where fD(m2
+,m−2) is the amplitude of theD0 → KS0π+π− decay,rB is a ratio of two amplitudes, and δis a strong phase difference. Similarly, the amplitude for B− → D0(K0
Sπ+π−)K−decay is
fB−= fD(m−2,m+2)+rBe−iφ3+iδfD(m+2,m−2). (4)
Once fD is fixed, a simultaneous fit to B+ and B− data allows to extractφ3,rBandδseparately.
The D0 → K0
Sπ+π− decay amplitude can be deter-mined from a large sample of flavor-taggedD∗+→D0π+
decays produced in continuume+e− annihilation. How-ever, with this approach the description of fD is based on a model, that includes interfering resonances inK0
Sπ+, K0
Sπ− andπ+π− systems as well as a nonresonant term.
Using the GGSZ method with a model-dependent descrip-tion of fD, Belle’s earlier measurement [17] based on a data sample of 605 fb−1integrated luminosity yieldedφ3= (78.4+−1011..86±3.6±8.9)◦andrB=0.160−+00..040038±0.011−+00..050010, where the last error comes from the Dalitz plot model un-certainty.
While the statistical errors of the GGSZ method will be reduced with an increased data sample, the accuracy will be still limited by the model uncertainty. The new approach was tested by Belle [18] to fight this seem-ing irreducible bound of the method. Instead of usseem-ing a parametrized fD function, Belle substituted the Dalitz plot distribution taken directly from the data obtained by CLEO [19] from the decays of quantum-correlatedD0D0 pairs produced in the ψ(3770). In contrast to the previ-ous method, the model-independent approach has to uti-lize a binned Dalitz plot. From the a combined fit Belle obtainedφ3 = (77.3−+1514..91±4.1±4.3)◦andrB = 0.145± 0.030±0.010±0.011, where the last error is due to lim-ited precision of CLEO data. The significance of directCP violation is 2.7 standard deviations. Compared to results of the model-dependent method, the last measurement has slightly poorer statistical precision mostly because of a smallerrBin this analysis. However, the large model un-certainty for the model-dependent study (8.9◦) is replaced by a purely statistical uncertainty due to the limited size of the CLEO data sample (4.3◦), which in future can be re-duced with the BESIII or Super Charm-Tau factory data. The model-independent approach therefore offers a per-spective course for studies at Belle II.
Two other methods (GLW and ADS) were also used in Belle analysis [20] and are useful for tighter constraints on bothφ3and the hadronic parameters for a more reliable measurement. Belle results onφ3 are in agreement with those obtained by BaBar and LHCb. The world average results onφ3is (68.0+−88..05)◦[12].
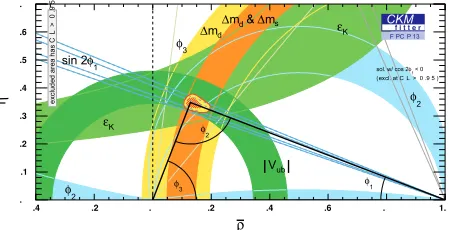
3.4 UT summary
Belle performed plenty of analyses to constrain the sides of the UT as well. These topics due to hugeness of the related material is outside of the scope of this review. We summarize the UT studies by illustrating the constraints obtained mostly by two B factory experiments, Belle and BaBar, with Fig. 8 produced by the CKMfitter
collabora-3 φ 2 φ 2 φ d m Δ K ε K ε s m Δ & d m Δ ub V 1 φ sin 2
(excl. at C L > 0 .9 5 ) < 0 1
φ
sol. w/ cos 2
2 φ 1 φ 3 φ ρ
.4 .2 . .2 .4 .6 . 1.
η . .1 .2 .3 .4 .5 .6 . e xc lud ed a rea h a s C L > 0 .9 5
F PC P 13
CKMf i t t e r
tion [12]. Each colored band here corresponds to a dif-ferent kind of process, and looking closely we can see quite nice agreement between independent constraints. It is worth mentioning that thanks to BaBar and Belle the square of allowed area for the position of the UT upper apex is squeezed by two orders of magnitudes compared to the pre-B factory era.
4
CP
violation in penguin dominated
modes
It is widely believed that B meson penguin decays can serve as one of the most sensitive probes for NP due to a possible non-SM contribution (e.g. from SUSY parti-cles) in the loop diagram. In particular, manifestations of the NP contribution in the penguin dominated modes can be revealed as deviations ofCPviolation parameters from the SM expectations. Inb → sqq¯ hadronic decays, the SM weak phase is the same as in theB0→(cc¯)K0 transi-tion. Therefore, the main task is to check whether the pen-guinCPviolation parameter sin 2φe1ff is equal to sin 2φ1, and the directCPviolation is absent (A =0). However, there are some SM corrections to these relations coming from the Cabibbo-suppressed tree diagram, final state in-teraction effects, etc. Theoretical calculations predict the uncertainties are of the order of 1% forb→sss¯ , and up to 10% for otherb→ sqq¯ modes.
Earlier Belle measurements of CP asymmetries in B0→φK0
S, using a 152×106BBdata sample [21], showed an exciting 3.5σdeviation of sin 2φeff
1 from sin 2φ1. The measurements updated in three years with almost three times higher statistics [22] showed already quite good (but disappointing) agreement. The results of several recent Belle studies are summarized in Table 1. These are consis-tent with theCPviolation inB0 → (cc¯)K0decays at the 1σlevel.
Table 1.Measurements ofCPviolation parameters, sin 2φeff 1
andA, inB0→ηK0,φK0, andK0
SK
0
SK
0
S modes with a
535×106BBdata sample.
mode sin 2φeff
1 A
ηK0 +0.64±0.10±0.04 −0.01±0.07±0.05 φK0 +0.50±0.21±0.06 +0.07±0.15±0.05 K0
SKS0KS0 +0.30±0.32±0.08 −0.31±0.20±0.07
Including other b → s mediated B decays, the pre-cision of sin 2φe1ff is still statistically limited, typically 0.1−0.2. Obtaining a 1% level sensitivity which provides already a real probe for the NP requires a Super B factory experiment.
5 Rare
B
decays
Prefacing this chapter it is worth to remind that precise measurements of rare decays,i.e.processes suppressed in the SM, are sensitive to NP at scales that can exceed those that achievable at the energy frontier. This is demonstrated by a few analyses described below involving both loop and tree decay diagrams.
5.1 b→ sγ
The dominant contribution in the SM tob → sγdecays is from a loop involving the top quark andW boson. The measurement of the inclusiveb → sγbranching fraction gives access to the value ofVts, but, what is more impor-tant, it provides a tool to search for and constrain physics beyond the SM. Indeed, the SM particles in the loop may be replaced by hypothetical particles such as the charged Higgs boson or SUSY particles resulting in observable de-viations of the decay rate.
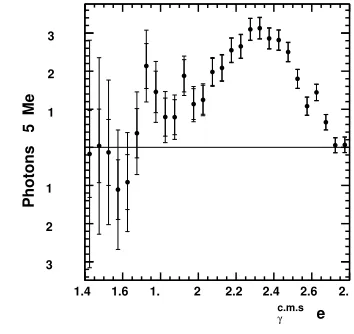
The inclusiveb→ sγrate (i.e.summed over all possi-ble strange hadronic states) suffers from the minimal the-oretical uncertainty in contrast to the rates of particular exclusive radiative channels, where the hadronic uncer-tainties are large. B(B → Xsγ) is calculated within the SM including next-to-next-to-leading logarithmic correc-tions with a∼7% precision. Ideally, the inclusive photon spectrum should be measured over the entire energy range. Practically, the lower part of the spectrum is hardly acces-sible due to insurmountably large background. Even in the intermediate energy region the continuum background is several orders of magnitude larger than the inclusive pho-ton signal. The continuum background is subtracted using the Belle’s off-resonance data sample. The obtained spec-trum is shown in Fig. 9 and the branching fraction was measured to be
B(B→Xsγ;Eγ>1.7 GeV)=(3.45±0.15±0.40)×10−4. (5)
The world average [25] (using the analogous BaBar mea-surement) extrapolated forEγ>1.6 GeV isB(B→Xsγ)= (3.55±0.24(exp)±0.09(model))×10−4. This is consistent with the theoretical prediction, and has been used to con-strain NP scenarios. For example, the charged Higgs mass is bounded from this measurement to be above 295 GeV.
e
γ c.m.s
1.4 1.6 1. 2 2.2 2.4 2.6 2.
Photons
5
Me
3 2 1 1 2 3
Figure 9.Photon energy spectrum fromB→Xsγ.
5.2 Measurement of theB(B+ →τ+ν)
extensions with charged Higgs bosons, that could signifi-cantly suppress or enhance the branching ratios for these decays. The charged Higgs mass is not strongly con-strained by the branching ratio of theb →sγprocess due to possible destructive interference between diagrams in-volving lopps with SUSY particles and the charged Higgs boson. Experimentally it is a real challenge to identify modes with aτlepton due to multiple neutrinos in the final state. At thee+e−B factories, exclusive production of aB meson pair with no extra particles allows to tag the signal decay by reconstruction of all particles originating from the accompanyingBmeson. Using the hermeticity of the detector it is possible to identify the signal as absence of the energy deposited in the detector not associated with the tag and signal particles. Two sorts of decays are employed for reconstructing of the taggingB: hadronic decays such asB→Dπ(“hadronic tag”) and semileptonic decays such asB → Dν(“semileptonic tag”). Both methods provide similar sensitivity: while the efficiency is higher for the semileptonic tag, the hadronic tag provides better purity.
The first evidence for B+ → τ+ν was reported by Belle using a hadronic tag and a data sample correspond-ing to 449×106 BBevents [26]. This was followed by a measurement using a semileptonic tag and a data sam-ple corresponding to 657×106 BB [27]. The branch-ing fraction obtained by the semileptonic-tag analysis is
B(B+ → τ+ν) =(1.54+0.38
−0.37−+00..2931)×10−4 with the signifi-cance of 3.6σ. The hadronic-tag result has been updated using the Belle’s final sample [28]. The branching fraction is found to beB(B+ → τ+ν) =(0.72+0.27
−0.25±0.11)×10−4 with a significance of 3.0σ (Fig. 10). In the last pa-per, by employing a neural network-based method for the hadronic tag and a two-dimensional fit for the signal ex-traction, along with a larger data sample, both statistical and systematic precision are significantly improved. Com-bining the semileptonic-tag and hadronic-tag results tak-ing into account all the correlated systematic uncertainties, the branching fraction is found to be (0.96±0.26)×10−4 with a significance of 4.0σ[28].
( e )
.2 .4 .6 . 1 1.2
vents
.
5
e
2 4 6 1 12
( e )
.2 .4 .6 . 1 1.2
vents
.
5
e
2 4 6 1 12
Figure 10. The residual unassociated energy deposited in the electromagnetic calorimeter. The red solid histograms show the projections of the fits. The red dashed and blue dotted histograms show the signal and background components, respectively.
The Belle result is in agreement with the BaBar mea-surement [29]. The world average value of B(B+ → τ+ν) = (1.15±0.23)×10−4 is consistent (the deviation
is 1.6σ) with the SM expectation of B(B+ → τ+ν) = (0.73+0.12
−0.07)×10−4 obtained from other experimental con-straints [12]. The measuredB(B+→τ+ν) sets constraints on the parameters of various models involving charged Higgs bosons. For large tanβthe excluded region are strin-gent than those obtained from the direct searched at LHC.
5.3 Measurement of theB(B→ D(∗)τ+ν)
The SM predicts a B → D(∗)τ+ν branching fraction of
1.4%, i.e. strictly speaking these modes are not rare. The result is presented in terms of R(D(∗)) = B(B → D(∗)τ+ν)/B(B→D(∗)ν), which is independent of theV
cb and of the parameterization of the strong interaction and can be compared with the SM theoretical expectations.
In two succeedingB → D(∗)τ+νanalyses Belle used “inclusive” hadronic tag with much looser selection com-pared to the B+ → τ+ν study with hadronic tag. The B → D(∗)τ+νdecay was first observed by Belle for neu-tral Bmesons using the 535×106 BBdata sample [30]. The results for chargedBmeson decays was obtained three years later using the 657×106 BBdata sample [31]. The decay B+ → D∗0τ+ντ is observed with a significance of
8.1 standard deviations, while only 3.5σsignificance was achieved for the decayB+→ D0τ+ν
τ. Finally, Belle also obtained a preliminary result for all four modes using the 657×106BBdata sample with exclusive hadronic tag [32]. The naive averages of R(D(∗)) for the results men-tioned above are R(D) = 0.430±0.091 and R(D∗) = 0.40±0.047. For these estimates, the correlations in the statistical errors between the different tagging analyses are neglected as the overlap of events with two tagging meth-ods is small. The results for R(D(∗)) are consistent be-tween the Belle and BaBar experiments [33]. The Belle re-sults exceed the SM predictionsR(D)=0.297±0.017 and R(D∗) = 0.252±0.003 by 1.4σand 3.0σ, respectively. The BaBar results exceed these SM predictions by 2.0σ and 2.7σ, respectively [33]. The combined disagreement between the experiment and the SM is at a4σlevel. It is worth mention that both results disfavor the type II two-Higgs doublet model at a level of more than 3σfor the whole tanβregion.
With larger statistics of Super B factory besides the improved accuracy ofR(D(∗)), theq2distributions and the angular distributions of theτandD(∗) decays could also provide useful information for testing the SM and con-straining NP models.
5.4 Rare decay summary
Besides B → D(∗)τ+νmodes, which show an intriguing
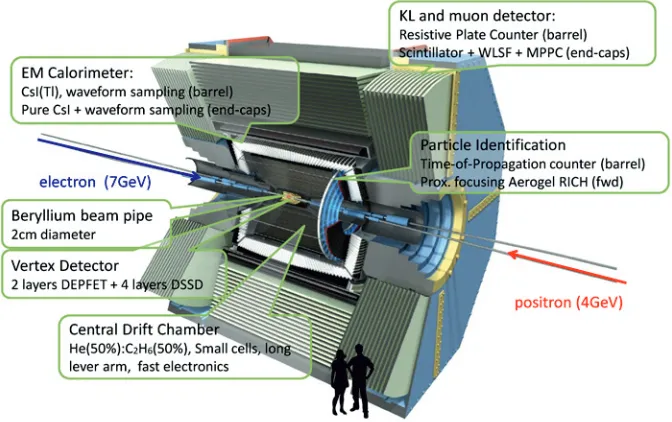
Figure 11.The Belle II detector layout.
6 B physics Future
The B factories have demonstrated that flavor physics has powerful potential to search for various NP manifesta-tions. If statistical errors of measurements would be sub-stantially improved, we could push the explored NP scale above the 1 TeV region: up to now no obstacles to that were seen, such as irreducible systematics or theoretical uncertainty, that can preclude in moving forward with sig-nificantly increased data. Thereby, there is a strong moti-vation for construction of the Super B factory.
The idea of the Belle experiment upgrade was first pre-sented in a Letter of Intent in 2004 [35], followed by a sup-plemental report in 2008 [36]. In parallel, the KEKB ac-celerator group has proposed the SuperKEKB machine, an upgrade of KEKB to increase the luminosity by two orders of magnitude, with an ultimate goal of 8×1035cm−2s−1. Further work on the detector design resulted in the Techni-cal Design report published in 2010 [34]. In March 2011 the accelerator as well as the detector upgrade were ap-proved by the Japanese parliament and the project was launched.
Because of the increased level of background, the de-tector for new experiment (Belle II) has to cope with higher occupancy and radiation damage than the Belle de-tector. To be able to operate at the conditions of the Su-perKEKB collider, the components of the Belle detector are either upgraded or replaced by new ones. Figure 11 shows the components of the Belle II detector and their main features. A detailed description of the detector can be found in Ref. [34].
The Belle II experiment has at least one important mis-sion: to search for NP in the flavor sector exploiting a huge jump in luminosity and the plenty of independent measure-ments. If the NP will be observed at LHC before the start of Belle II, the flavor sector of NP still needs to be con-strained, which is only possible at the Super B factory as
many of such measurements can not be made at hadronic machines. The aim of the Belle II project is to accumu-late 50 ab−1, corresponding to about 55 billionBBpairs by the year 2022. The projected sensitivities for 50 ab−1 are below 0.01 for sin 2φ1, less than 1◦ forφ2, and 1.5◦ for φ3. The accuracy inCPviolation studies, branching frac-tions and kinematics characteristics in rare Bdecays will be also improved by an order of magnitude. The examples described above are only a small part of possible measure-ments to be performed with the Belle II experiment. A more detailed overview can be found in Ref. [37].
References
[1] G. Aad et al. (ATLAS Collaboration), Phys. Lett. B716, 1 (2012);
S. Chatrchyanet al.(CMS Collaboration), Phys. Lett. B716, 30 (2012).
[2] N. Cabibbo, Phys. Rev. Lett.10, 531 (1963) 531; M. Kobayashi and T. Maskawa, Prog. Theor. Phys.49, 652 (1973).
[3] A. D. Sakharov, Pisma Zh. Eksp. Teor. Fiz. 5, 32 (1967).
[4] S. Kurokawa et al., Nucl.Instrum.Meth. A499, 1 (2003);
A. Abashian et al., Nucl.Instrum.Meth. A479, 117 (2002).
[5] I. Adachiet al.(Belle Collaboration), Phys. Rev. Lett. 108, 171802 (2012).
[6] M. Gronau and D. London, Phys. Rev. Lett.65, 3381 (1990).
[7] K. Abe,et al.(Belle Collaboration), Phys. Rev. D68, 012001 (2003).
[9] J. Dalseno et al. (Belle Collaboration), Phys. Rev. D88, 092003 (2013).
[10] P. Vanhoefer et al. (Belle Collaboration), arXiv:1212.4015.
[11] A. Kusakaet al. (Belle Collaboration), Phys. Rev. D77, 072001 (2008).
[12] J. Charles et al. (CKMfitter Group), Eur. Phys. J. C41, 1 (2005) and on-line update at
http://ckmfitter.in2p3.fr/
[13] A.E. Synder and H.R. Quinn, Phys. Rev. D48, 2139 (1993).
[14] M. Gronau and D. London, Phys. Lett. B253, 483 (1991);
M. Gronau and D. Wyler, Phys. Lett. B265, 172 (1991). [15] D. Atwood, I. Dunietz, A. Soni, Phys. Rev. Lett.78,
3257 (1997);
Phys. Rev. D63, 036005 (2001).
[16] A. Giri, Y. Grossman, A. Soffer, J. Zupan, Phys. Rev. D68, 054018 (2003);
A. Bondar, Proceedings of BINP Special Analysis Meeting on Dalitz Analysis, 24-26 Sep. 2002, unpub-lished.
[17] A. Poluektovet al.(Belle Collaboration), Phys. Rev. D81, 112002 (2010).
[18] H. Aihara et al. (Belle Collaboration), Phys. Rev. D85, 112014 (2012).
[19] R. A. Briereet al.(CLEO Collaboration), Phys. Rev. D80, 032002 (2009).
[20] Y. Horiiet al.(Belle Collaboration), Phys. Rev. Lett. 106, 231803 (2011).
[21] K. Abeet al.(Belle Collaboration), Phys. Rev. Lett. 91, 261602 (2003).
[22] K.-F. Chenet al. (Belle Collaboration), Phys. Rev. Lett.98, 031802 (2007).
[23] Y. Nakahamaet al.(Belle Collaboration), Phys. Rev. D82, 073011 (2010).
[24] A. Limosaniet al.(Belle Collaboration), Phys. Rev. Lett.103, 241801 (2009).
[25] Y. Amhis et al. (Heavy Flavor Averaging Group), arXiv:1207.1158 and online update at
http://www.slac.stanford.edu/xorg/hfag. [26] K. Ikadoet al.(Belle Collaboration), Phys. Rev. Lett.
97, 251802 (2006).
[27] K. Haraet al.(Belle Collaboration), Phys. Rev. D82, 071101 (2010).
[28] K. Haraet al.(Belle Collaboration), Phys. Rev. Lett. 110, 131801 (2013).
[29] J. P. Lees et al. (BaBar Collaboration), Phys. Rev. D88, 031102 (2013);
B. Aubertet al.(BaBar Collaboration), Phys. Rev. D81, 051101(R) (2010).
[30] A. Matyja et al. (Belle Collaboration), Phys. Rev. Lett.99, 191807 (2007).
[31] A. Bozek et al. (Belle Collaboration), Phys. Rev. D82, 072005 (2010).
[32] I. Adachi et al. (Belle Collaboration), arXiv:0910.4301.
[33] J. P. Lees et al. (BaBar Collaboration), Phys. Rev. Lett.109, 101802 (2012);
B. Aubertet al.(BaBar Collaboration), Phys. Rev. Lett. 100, 021801 (2008).
[34] T. Abeet al., arXiv:1011.0352.
[35] S. Hashimoto, M. Hazumi, J. Haba, J. Flanagan, and Y. Ohnishi, editors, Letter of Intent for KEK Super B Factory, 2004-04.