The Effects of Visual Cues, Blindfold, Synesthetic
Experience and Music Training on Pure-Tone
Frequency Discrimination
C. K. Tse 1 and C. K.-C. Yu 2
1 Department of Counselling & Psychology, Hong Kong Shue Yan University; [email protected] 2 Department of Counselling & Psychology, Hong Kong Shue Yan University; [email protected]
Abstract: How perceptual limits can be overcome has long been examined by psychologists. This study
investigated whether visual cues, blindfolding, visual-auditory synesthetic experience and music training could facilitate a smaller frequency difference limen (FDL) in a gliding frequency discrimination test. It was hoped that the auditory limits could be overcome through visual facilitation, visual deprivation, involuntary cross-modal sensory experience or music practice. Ninety university students, with no visual or auditory impairment, were recruited for this one-between (blindfold/visual cue) and one-within (control/experimental session) designed study. A MATLAB program was prepared to test their FDL by an alternative forced-choice task (gliding upwards/gliding downwards/no change) and two questionnaires (Vividness of Mental Imagery Questionnaire & Projector-Associator Test) were used to assess their tendency to synesthesia. Participants with music training showed a significantly smaller FDL; on the other hand, being blindfolded, being provided with visual cues or having synesthetic experience before could not significantly reduce the FDL. However, the result showed a trend of reduced FDLs through blindfolding. This indicated that visual deprivation might slightly expand the limits in auditory perception. Overall, current study suggests that the inter-sensory perception can be enhanced through training but not though reallocating cognitive resources to certain modalities. Future studies are recommended to verify the effects of music practice on other perceptual limits.
Keywords: frequency difference limens; blindfold; visual cues; auditory-visual synesthesia; gliding
frequencies; perceptual limit, common resource theory; multiple resource model
1. Introduction
Human can listen and detect a variety of sounds under different conditions. To be specific, a normal human behavioral frequency-difference limen (FDL), which is the just noticeable difference in hearing, is 1.72-5.63 Hz in 140Hz and 1-2Hz between the frequency 80-400Hz [1,2]. However, the FDL measured by the electrical frequency-following response emanating directly from the brainstem neurons is even smaller (75%) than the behavioral FDL [1]. Accordingly, FDL might vary from person to person and the brain can detect a smaller FDL than the behavioral perception. It would be interesting to investigate the factors for the discrepancies and find out methods to improve the behavioral perception. It would be also beneficial for training the ability to differentiate each pitch precisely without external reference – namely, the absolute pitch [3].
To calculate FDL, Nelson, Stanton and Freyman (1983) proposed a square-root function between log (FDL) and frequency [4], whereas Micheyl, Xiao and Oxenham (2012) defined the equation in one of their models as follows [5]:
E[𝑑𝑖(𝑓, 𝑑, 𝑠)] = 𝛽𝑓( 𝑓 1000)
𝛾𝑓+ 𝛽 𝑑(
𝑑 100)
𝛾𝑑+ 𝛽 𝑠(
𝑠 10)
𝛾𝑠+ 𝑟 𝑖+ 𝛼.
Regarding this, stimulus presentation level (s), duration (d) and frequency (f) would affect the just-noticeable difference in pure-tones [5]. In particular, a greater decrease of FDL was found in a smaller tonal duration (5ms) and a larger sensation level (80 dB SL), in which the effect remained unchanged with a tonal duration of 200ms and was much significant in low frequency (200Hz) [7]. Gliding frequencies were also found to have a higher detection rate of frequency change, as compared
with discrete frequencies [8]. These factors are related to the presentation of frequencies and might decrease FDL. Yet, by managing these controllable factors, there was still a discrepancy between the behavioral FDL and the FDL recorded from the frequency-following responses in the brainstem neurons [1]. Therefore, this study attempted to examine other factors, such as visual-auditory interaction, synesthetic experience and music training to minimize the FDL of gliding frequencies, which is related to the interactions with the visual system and attention allocation. Many researchers have conducted studies on FDL [9-13], but most of them examined discrete frequency discrimination, which requires participants to discriminate two separate pure-tones. There have been very few studies about the FDL of gliding frequencies; the present study can shed light on the understanding of gliding frequency perception and the approaches to overcome the perceptual limit in auditory perception.
Studies found that visual-auditory interactions are beneficial in increasing the accuracy of perception [14]. Hirata and Kelly (2010) found a bigger improvement on phoneme learning when English speakers were allowed to look at the lip movement during Japanese audio training [15]. In contrast, the improvement was very little when the English speakers were provided with the hand gesture or listened to the audio tape alone. As demonstrated in this example, combining visual and auditory information during the perception process can achieve a more accurate perception.
Considering the attention models that explain the visual-auditory interaction, Wicken (2002) proposed a multiple resource model in which different modalities processed in different channels would facilitate each other while activities in the same modalities would compete each other and therefore hinder the performance [16]. Based on the rule of cross-modal similarities, Marks (1987) studied four inter-sensory relations, which were pitch-lightness, pitch-brightness, loudness-brightness and pitch-object form [17]. He demonstrated that the congruent presentation of auditory and visual stimuli led to a higher accuracy and faster response than did the incongruent presentation. For example, he showed that during this discrete frequency discrimination task, pairing higher frequency (360Hz) with lighter visual stimuli resulted in a smaller reaction time than did pairing with a dim visual stimulus. This phenomenon illustrated that when there is a similarity in visual and auditory information, a faster and more accurate response can be obtained [17,18]. Consistent with this early study, there is ERP and fMRI evidence that auditory cortical responses could be enhanced when pairing tones to attended visual stimulus [19]. From the studies above, the congruent presentation of visual stimuli and auditory stimuli would result in a faster reaction time and higher response accuracy through the cross-modal interaction.
Although the studies above could not confirm whether the cross-modal interaction takes place at the sensory/perceptual level or semantic encoding, they revealed that different sensory modalities are interlinked and can facilitate responses. Therefore, visual cues can be a potential factor to facilitate auditory perception, in which a congruent visual cue might facilitate a better auditory perception. Therefore, this study applied the cross-modal interaction to test the minimization of FDL through the interaction with visual modality. The cross-modal interaction is similar to Stroop task but it targets on the improvement of auditory perception with the presence of visual cues. Since a congruent visual cue could predict a more accurate response, it is hoped that it could help to reduce the behavioral FDL.
However, as to whether the visual-auditory interaction improves or distorts perception, there is no conclusion. Bulkin and Groh (2006) found that auditory sense dominated temporal processing, such as detecting the locations of occluded objects, while visual sense dominated spatial processing, such as searching target in the busy street [14]. Moreover, Metcalfe, Glavanov and Murdock (1981) documented a similar finding by demonstrating better performance of recalling words with the spatial positions (left, right, and center) in a visual task and with the temporal positions (first, second, and third) in an auditory task [23]. From these examples, it could be predicted that during visual-auditory interaction, the supply of a temporal cue would favor visual-auditory perception while a spatial cue would favor visual perception.
In contrast to the multiple resource theory, Kahneman (1973) proposed a single pool of attention resources, i.e., common resource theory [24], and early research indicated the shared capacity in processing visual and auditory discrimination by demonstrating the difficulties of discriminating pitch and light intensity at the same time [25]. Recent research also found that visual tasks that demanded low attentional resources could improve auditory thresholds [26]. Moreover, the evidence that visual and auditory processing occurred at the central level rather than two peripheral mechanisms seemed to support the common central resources model [27]. A recent study also suggested shared visual and auditory attentional resources in that visual-spatial and auditory-spatial information did not facilitate performance [28]. It revealed that resources are limited, and vision and auditory processing are two dependent processing that compete for the central resources.
Vision and auditory processing would influence each other. For example, visual processing was impaired with concurrent spoken messages [29]; the duration for perception of effort and exertion in physical exercise was longer in people who used visual and auditory senses together [30]. Furthermore, the cross-modal Stroop task demonstrated the hearing of auditory color words could distract and slower people’s performance in a color naming task [31]. In view of these studies, attention was shown to be limited and shared by different processing. Thus, to improve auditory processing, the common resource model would suggest allocating more attentional resources to auditory perception than visual perception through visual deprivation.
As resources are limited, it might be that human would allocate more resources to auditory processing when vision is deprived. Studies have revealed that blindness can bring a range of improvements in auditory perception [32,33]. Similarly, a study also showed that being blindfolded for ninety-minutes enhanced performance of harmonicity perception. This could be explained by the metamodal model, in which the deprivation of visual inputs would rapidly release nonvisual inputs (i.e., auditory and tactile) from suppression because the domination of visual sensory in the striate cortex is halted [34]. In connection with this, Williams (2015) demonstrated that vision is responsible for two-third of the brain electrical activity when opening eyes [35]. In view of this high consumption of resources in visual perception, blindfolding would suppress visual processing and allocate more attentional resources to auditory processing.
From the review above, the common central resource model suggests that blindfolding would enhance auditory perception by allocating more resources to auditory processing. Therefore, blindfold is another potential factor that may minimize FDL.
Synesthesia is an involuntary sensory experience that the stimulation of one modality evokes the sensation of another modality [36,37]. In general, around 5% of the population have experienced one type of synesthesia [38], such as auditory-tactile synesthesia, chromesthesia (sound-to-colour synesthesia), grapheme-colour synesthesia and auditory-visual synesthesia.
a part in synesthesia. This points to the possibility of improving one’s perception through the synesthetic experience from another modality.
Indeed, there is evidence that the synesthetes have a better visual ability. By measuring the vividness of the mental image through the Vividness of Mental Imagery Questionnaire (VVIQ), the synesthetes shared a major characteristic of having a vivid mental image than did the non-synesthetes [41]. Despite the fact that most of the subjects in the study were linguistic-color synesthetes, a few were colored music and visual-taste synesthetes.
Furthermore, a study demonstrated that participants with high VVIQ scores could be trained to acquire the grapheme-colour synesthesia through associative learning that involved extensive memory and reading exercises [42]. Although auditory perception was not involved in this study, it revealed that synesthetic experience could be induced in synesthetes. It also suggested that non-synesthetes with a high VVIQ score could be trained to become ‘synesthete’ and acquire the advantages of cross-modal interaction in auditory perception. Synesthetic experience involving one modality might favor a better performance in another modality through a stronger association between modalities. A neurological study found an increased activation in the left inferior parietal cortex (IPC) of the auditory-visual synesthetes when compared to the non-synesthetes [43]. Since this area is responsible for multimodal integration and feature binding, the researchers believed that the auditory-visual synesthetes had an enhanced sensory integration ability than did the non-synesthetes. Accordingly, synesthetic experience might facilitate a better visual-auditory interaction and thus, improve auditory perception.
In addition, in the case of a visual flash causing auditory synesthetic experiences, the synesthetes demonstrated an excellent ability in a difficult visual task involving rhythmic temporal patterns [44]. In this case, the advantage of performing the visual task was not only owing to the visual system, but also because of the ‘hearing’ of the rhythmic temporal patterns in auditory perception. Therefore, when two senses interacted and intertwined together, they benefited each other.
Nevertheless, the examination of the visual-auditory interaction in grapheme-color synesthetes revealed mixed findings regarding the communication between the visual modality and the auditory modality [45]. In the experiment of the double-flash illusion, which required participants to report the numbers of a visual flash that had been shown on the screen, the synesthetes demonstrated a lower accuracy in the condition of two beep sounds and one visual flash. Despite the lower accuracy, a strong cross-modal interaction between the visual and auditory modalities was observed. However, since the subjects in this experiment were not auditory-visual synesthetes, no conclusion could be made regarding the facilitative effect between visual and auditory perception.
It is worth examining whether visual synesthetic experience would facilitate or impair auditory perception. With reference to the cross-modal interaction, it could enhance auditory perception and result in a smaller FDL. The study of visual synesthetic experience would provide pragmatic information of the inter-sensory processing and clarify the argument between cross-modal perception and unimodal perception in synesthesia.
Music training has been found to be a crucial factor to improve auditory perception. Musicians have a half of FDL, earlier pitch change detection and better ability to discriminate frequencies, in comparison with non-musicians [46,47]. As indicated by a larger amplitude of N2b and P3 responses during attentive listening, professional musicians also showed a faster and more accurate pitch detection than did non-musicians [48]. Therefore, music training might somehow ‘train’ the brain to acquire better auditory abilities. Besides visual-auditory interaction, music training can be another important factor for improving hearing experience.
identification test, their results were based on accuracy but not FDL [49]. Thus, the present study could provide information of the FDL of gliding frequencies.
The present study aimed to investigate the effects of visual cues, blindfolding, synesthetic experience and music training on behavioral FDLs. Both multiple resource and common resource models imply an advantage of frequency discrimination. Therefore, it was hypothesized that providing visual cues or minimizing visual inputs could reduce FDL. Moreover, given a stronger communication between the visual and auditory modalities in synesthesia, a smaller FDL was expected to be found in participants with synesthetic experience. Finally, it was hypothesized that participants with music training would have a smaller FDL.
2. Materials and Methods 2.1 Participants
Ninety university students with 37 males and 53 females were recruited to participate in this study, mean age = 20.39, SD = 1.269. All participants were asked to complete the informed consent and background questionnaire before the experiment to ensure normal hearing and visual ability.
2.2 Materials
The experimental setup was adapted from the study of Demany, Carlyon and Semal (2009) [50]. All tested frequencies were sinusoidal waveform pure-tones that were generated through MATLAB and delivered through Earpods. The reference frequencies were 110Hz, 440Hz and 1760Hz with the sound pressure level (SPL) of 65 dB. These three reference frequencies were chosen because they represent the second octave, fourth octave (middle octave) and the sixth octave in the piano [51], which constitute the common frequency range in a music piece. Specifically, 440Hz was chosen because it was the tuning preference in orchestra [52].
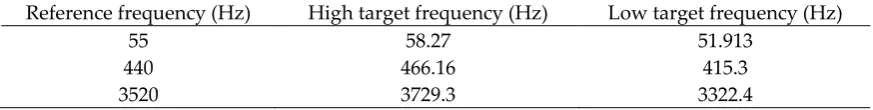
All target frequencies were set to a semitone higher or lower than the reference frequency since it was the basic detectable difference of frequency in music. In this study, FDL was defined by the difference between the reference frequency and the target frequency. Table 1 shows all the reference frequencies and the target frequencies in this study.
Table 1. The reference frequencies and target frequencies from the first, fourth and seventh octave. Reference frequency (Hz) High target frequency (Hz) Low target frequency (Hz)
55 58.27 51.913
440 466.16 415.3
3520 3729.3 3322.4
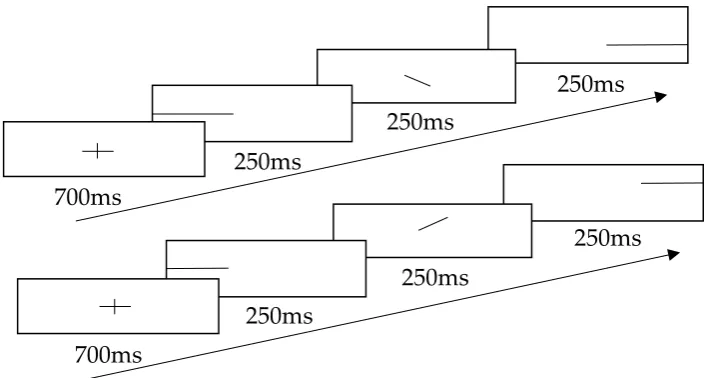
Figure 1. Schematic representation of the stimulus presentation of gliding upwards (left) and gliding downwards (right) pure-tones.
The design of visual cues was adapted from the study by Ben-Artzi and Marks (1995), which revealed a positive relationship between the pitch change and the position of dot [18]. To minimize the efforts of searching dots, this study adopted a continuous straight line as the visual cues. This line showed the gliding direction when participant listened to the sound track and identified the change of the frequency. The schematic representation of visual cues is shown in Figure 2. To prevent participants from noticing the answers directly from the cues, both congruent and incongruent cues were presented to them. For the congruent cue, the line went up or down in the middle of the screen according to the gliding direction in the sound track; for the incongruent cue, the line went to the opposite direction to the gliding direction in the sound track. To prevent habituation and indicate the start of the next trial, a fixation cross (+) was flashed at the beginning of each trial.
Figure 2. Schematic representation of the visual cues with upper showing gliding downwards and lower showing gliding upwards.
To assess synesthetic experiences, this study had adopted the VVIQ questionnaire and the projector-associator test (PAT) from the Synesthesia Battery on https://www.synesthete.org/. This battery was a standardized test to investigate and study synesthesia [36].
Guiding upwards Guiding downwards
Frequency
(
H
z)
Time
250ms
250ms
250ms
700ms
250ms
250ms
250ms
700ms
Reference frequency High targetfrequency
Low target
frequency
750ms 750ms
The VVIQ scale consists of 32 five-point Likert-scale questions. The Cronbach’s alpha for the VVIQ scale was .917 in this study.
The Projector-Associator test (PAT) consists of 12 five-point Likert-like items. The Cronbach’s alpha for the PAT was .876. Those of the projector scale and associator scale were .778 and .829 respectively.
In addition to the VVIQ and PAT, the background information of participants, the presence of perfect/absolute pitch, the years of music training and the presence of visual-auditory synesthetic experience were collected.
2.3 Procedures
Before the experiment started, a frequency discrimination test (Lutman, 2004) was applied to ensure the ability to discriminate frequencies [53].This test contains 14 trials and requires participants to choose a higher tone between the reference frequency (500Hz) and the target frequency (7 trials with 5% change while 7 trials with 2% change). Participants should obtain seven accurate responses or above to pass the test.
After that, five practice trials were given for demonstrating the operation and to ensure all participants were confident with the experimental procedures. All participants were required to perform both an experimental session and a control session; they were randomly assigned to participate one of the sessions first. For the experimental session, the participants were randomly divided into two conditions: visual cues and blindfold. In the visual cue experimental session, a total of 180 trials were presented to each participant They comprised fifteen trials of gliding upwards and fifteen trials of gliding downwards in three frequency levels (low/middle/high) and two types of visual cues (congruent/incongruent). All trials were randomly presented.
In the blindfold experimental session, a total of 90 trials were presented to each participant. It was composed by fifteen trials of gliding upwards and fifteen trials of gliding downwards in three frequency levels (low/middle/high). All trials were randomly presented, and the participants were required to put on an eye mask during the whole experimental session.
After finishing the experimental session, the VVIQ and PAT questionnaire were distributed. Next, the control session was given with the similar procedure to the blindfold condition except that the participants were instructed to focus on the fixation cross (+) on the screen. To eliminate the habituation effect, the fixation cross was flashed once before every trial. 90 trials were randomly presented and different from those of the blindfold experimental session.
In each trial, participants were told to discriminate whether there was an upward change, downward change or no change in the frequency tone. To indicate their response, they were instructed to press upward arrow (↑), downward arrow (↓) and right arrow (→) in the keyboard when they thought the operating sound track was increasing in frequency, decreasing in frequency and remained unchanged in frequency, respectively. For each correct answer, the frequency change, which was the difference between the reference frequency and target frequency, decreased by half. The other hand, each incorrect response increased the change by one-fourth of the original change.
3. Results 3.1 FDL
Nine participants’ data were screened out because of reported hearing impairment and program errors (i.e., the frequency range was not reduced after a correct answer or was reduced after an incorrect answer).
(110Hz). Then, the data that were above 3 SD and replicated less than three times were screened out to remove outliers. After the screening, the data were normalized by fractional ranking and inverse density function before analysis.
Six 2 X 2 one-between-one-within repeated measures ANOVAs on FDLs were conducted to investigate the main effects of between-subject factors (blindfold/visual cue) and within-subject factors (control/experimental sessions).
For the ‘low frequency, gliding downwards’ condition, a significant main effect was found in the within-subject factors, Greenhouse-Geisser F(1, 76) = 11.509, p = .001, ηp² = .132. The FDL of experimental session (M = 1.401, SD = 1.604) was significantly smaller than that of the control session (M = 2.365, SD = 2.722). However, no significant difference was found between the blindfold and visual cue experimental conditions, F(1, 76) = .270, p = .605, ηp² = .004 and no interaction effect was found,Greenhouse-Geisser F(1, 76) = 2.435, p = .123, ηp² = .031.
In the condition of ‘low frequency, gliding upwards’, a marginally significant main effect was also found in the within-subject factors, Greenhouse-Geisser F(1, 76) = 3.916, p = .051, ηp² = .049, in which the FDL of the control session (M = 7.920, SD = 13.067) was significantly smaller than that of the experimental session (M = 13.243, SD = 29.342). Yet, no significant difference was found in the between-subject factor (blindfold/visual cue), F(1, 76) = .054, p = .817, ηp² = .001 and no interaction effect was found,Greenhouse-Geisser F(1, 76) = .504, p = .480, ηp² = .007.
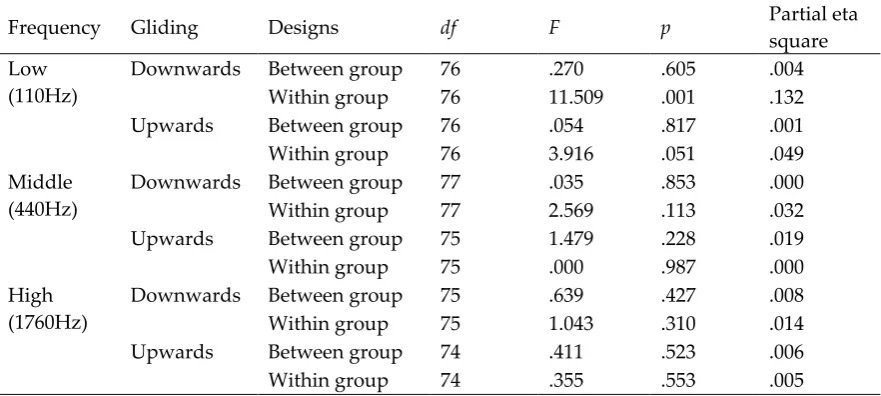
The other five conditions, with five between-subject tests and five within-subject tests found no significant differences, p-value of the tests >.05. Table 2 shows the statistical results with the p-values and effect sizes.
Table 2. The statistical test of the repeated measures ANOVAs
Frequency Gliding Designs df F p Partial eta
square Low
(110Hz)
Downwards Between group 76 .270 .605 .004
Within group 76 11.509 .001 .132
Upwards Between group 76 .054 .817 .001
Within group 76 3.916 .051 .049
Middle (440Hz)
Downwards Between group 77 .035 .853 .000
Within group 77 2.569 .113 .032
Upwards Between group 75 1.479 .228 .019
Within group 75 .000 .987 .000
High (1760Hz)
Downwards Between group 75 .639 .427 .008
Within group 75 1.043 .310 .014
Upwards Between group 74 .411 .523 .006
Within group 74 .355 .553 .005
Note. Between group compare the difference between blindfold and visual cue condition, while the within group compare the difference between control and experimental session.
Table 3. Means and standard deviations of FDL in the control and experimental sessions
Frequency Gliding Session Valid N M (Hz) SD
Low (110Hz) Downwards Control 78 2.365 2.722
Experimental 78 1.401 1.604
Upwards Control 79 7.920 13.067
Experimental 79 13.243 29.342
Middle (440Hz)
Downwards Control 80 8.986 15.165
Experimental 80 6.730 8.588
Upwards Control 78 5.991 7.500
Experimental 78 5.682 9.113
High (1760Hz)
Downwards Control 77 67.566 178.954
Experimental 77 82.747 203.867
Upwards Control 78 8.870 9.921
Experimental 78 8.281 11.493
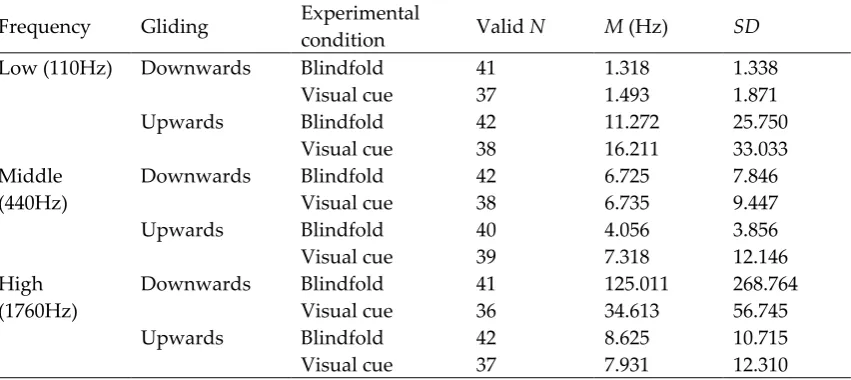
Table 4. Means and standard deviations of FDL in the blindfold and visual cue condition
Frequency Gliding Experimental
condition Valid N M (Hz) SD
Low (110Hz) Downwards Blindfold 41 1.318 1.338
Visual cue 37 1.493 1.871
Upwards Blindfold 42 11.272 25.750
Visual cue 38 16.211 33.033
Middle (440Hz)
Downwards Blindfold 42 6.725 7.846
Visual cue 38 6.735 9.447
Upwards Blindfold 40 4.056 3.856
Visual cue 39 7.318 12.146
High (1760Hz)
Downwards Blindfold 41 125.011 268.764
Visual cue 36 34.613 56.745
Upwards Blindfold 42 8.625 10.715
Visual cue 37 7.931 12.310
3.2 Visual Synesthesia Experience in Auditory Perception
In total, eight participants reported the presence of visual associations when hearing music (n = 8). Twelve Mann-Whitney U-tests were conducted to evaluate the hypothesis that people with synesthetic experience would have a smaller FDL. No significant differences were found, p-values >.05. Table 5 summarizes the statistical results and the descriptive statistics.
3.3 Music training
As the perfect pitch/absolute pitch was a confounding variable in this study, twelve Mann-Whitney U-tests were conducted to evaluate the difference of the FDL between the perfect pitch/absolute pitch participants (n = 5) and the remaining participants. Only in the condition of ‘middle frequency, gliding downwards, control session’, the perfect pitch/absolute pitch participants showed a lower FDL (Mdn = 0.920, Range = 4.831) than did the other participants (Mdn = 5.751, Range = 89.835), Z (79) = -2.494, p = .015. Yet, as the other conditions did not show a significant difference of FDL, p-values >.05, the results suggested no difference between the perfect pitch/absolute pitch participants and the normal participant in the present study.
Fifty participants had been engaged in music training (M of training years = 6.187, SD = 4.804) while 31 participants reported no music training. The presence of music training was defined as having played a musical instrument, such as piano, violin, flute and guitar. Fourteen independent sample t-tests were conducted to examine the effect of music training experience on the FDLs, VVIQ scores and PAT scores. Eight tests, including the analysis of some FDLs and PAT scores, showed significant differences, p-values <.05. Table 6 presents the statistical results with the p-values and effect sizes.
In general, the participants with music training showed a significantly smaller FDL than did the participants without music training in the conditions of ‘Low frequency, gliding upwards’, ‘Middle frequency, gliding downwards, experimental session’, ‘Middle frequency, gliding upwards’, ‘High frequency, gliding downwards’. The p-values, means and standard deviations are shown in Table 6.
4. Discussion
4.1 Visual-auditory interaction and FDL
The present study found that providing visual cues and minimizing visual inputs were not effective in reducing FDLs in most of the conditions. In particular, the experimental session (i.e., being provided with visual cues or blindfolded) showed a significantly smaller FDL than did the control session only in the ‘low frequency, gliding downwards’ condition. Nonetheless, as the between-subject factors (blindfold/visual cue) did not yield a significant difference, it was unclear what contributed to the reduced FDLs. The multiple resource model assumes that visual cues facilitate auditory perception while blindfolding helps to allocate more resources to auditory perception according to the common resource theory. The present results gave partial support to the two theories in that both using visual cues and visual deprivation seemed to reduce FDL.
Nevertheless, as most of the conditions did not show a significant improvement in the FDL, the reduction of FDL in some conditions might be due to some specific characteristics. For instance, the finding that the downwards glide favored a smaller FDL could be explained by the cell organization that the majority of cells in auditory cortex are responsive to downward sweeps [54]. In addition, a previous study of synthetic vowels with 120 Hz steady fundamental frequency (F0) also demonstrated an FDL of 0.3Hz [55]. Accordingly, low frequency sounds might have smaller FDLs. These two characteristics might favor a better visual-auditory interaction in the low frequency, gliding down condition, and thus, minimize the FDL. In the condition of ‘low frequency, gliding upwards’, the result showed a marginally significant difference (p = .051) that the control session had a smaller FDL than did the experimental session. In this case, the significant difference might be a random result in view of its small effect size (ηp² = .049).
Indeed, most of the conditions failed to exhibit smaller FDLs. Therefore, except the ‘low frequency, gliding downwards’ condition, visual-auditory interaction was not helpful to boost the auditory perception. This result suggested that human could only discriminate a fixed, limited range of frequencies and could not overcome the limit through the re-allocation of attentional resources. A similar phenomenon was observed in the visual perception that human could only perceive a certain kind of visual objects at the same time [56]. Not only visual object perception but also visual acuity has certain limits. In a previous experiment, the image resolution reached a plateau at 40-50 cycles/degree (cpd); that is, the visual acuity could not be improved after this range [57]. In other words, FDL was similar to visual acuity and instant visual-auditory interaction could not overcome the perceptual limit in FDL.
Apart from that, there were a few factors that led to the failure of minimizing FDLs through visual cues or blindfolding. The neural systems that are sensitive to detect gliding frequencies (frequency shift detectors) have an optimal range of 120 cents (f2/f1 = 1.071) [58]. However, the FDL applied in this study was continuously being reduced to the level smaller than 120 cents; therefore, the FDLs beyond this optimal range were not susceptible to modifications. In other words, the facilitation of the cross-modal perception might occur only in its optimal range of frequencies. Moreover, as an identification task (discriminate the directions of glide) was much more difficult than the detection task (identify the occurrence of glide) [59], identifying the directions of glides might interfere the judgement of detecting the FDL, which then caused a larger FDL.
Indeed, the common resource theory was not totally rejected in the present study. Despite no significant difference being found between the blindfold and visual cue conditions, the FDL tended to be smaller in the blindfold condition. This slightly supported the common resource theory that depriving one sensory modality could favor the processing of another modality by allocating more resources to that modality processing [24]. By temporarily depriving visual perception, it could slightly reduce the FDL and facilitate better performance in an auditory task. On the basis of the current results, the visual modality and the auditory modality seem to operate within the domain general context, such that they share and fight for the same pool of cognitive resources.
However, it should be noted that this tendency only occurs in the low (110Hz) and middle frequencies (440Hz) but not in the high frequency (1760Hz). This phenomenon could be explained by the frequency theory in perceiving sounds, according to which the basilar membrane vibrates with the sound synchronously and generates the action potentials at the same frequency in auditory nerve axons (i.e., a frequency of 110 Hz would produce 110 action potentials per second in the auditory nerve) [61]. The refractory period of neuron is around 1 ms and the maximum firing rate of a neuron is 1000Hz [62]. Since the high frequency applied in this study was 1760 Hz, which was higher than the possible range of firing rate, the hearing mechanism might change from the frequency theory to another theory, such as place theory. According to the place theory, sound perception is the frequency activation in a specific place of the hair cells along the basilar membrane, such that frequency discrimination is based on the difference of neuron responses between different places [63]. With reference to these two theories, the mechanism of auditory perception might shift, depending the frequency range that the participants were perceiving. Therefore, visual cues and visual deprivation might have dissimilar effects on high and low frequency ranges of auditory perception.
4.2 Synesthetic Experience and FDL
Participants who had synesthetic experience did not have a significantly lower FDL in comparison with the participants without synesthetic experience. This indicated that cross-modal interaction in synesthesia fails to improve the ability to discriminate frequencies. In fact, there is evidence that the sensory enhancement is related to the same modality of synesthetic experience, such as color sensitivity being enhanced only in those synesthetes who have color synesthetic experience [64]. To enhance the auditory perception, sounds should be the synesthetic experience instead of the stimuli that trigger the synesthetic experience. Therefore, visual synesthetic experiences examined in the present study might not be conducive to auditory perception.
4.3 Music training and FDL
Music training is an important factor for auditory perception given the finding that the presence of music training minimized the FDL in most of the conditions. In fact, the benefits of music training on enhancing auditory perception have already been documented in the literature [46,47]. A previous experiment demonstrated that compared with non-musicians, musicians had six times smaller thresholds in pitch discrimination [65]. That experiment further indicated that the non-musicians required at least fourteen hours of training in order to attain the similar thresholds discriminating pitch to the musicians [65]. Therefore, ordinary people can acquire an enhanced pitch discrimination ability if they receive music training.
Bianchi, Santurette, Wendt and Dau (2015) explained that music training can enhance pitch representation in the auditory system and thus, improve auditory perception [66]. Likewise, Schellenberg and Moreno (2009) asserted that musically trained participants would have more comprehensive mental representation and more profound memory because music training involves cross-modal encoding of stimuli [67].
participants who had music training were strong associators. An associator tends to have synesthesia experiences in the mind’s eye rather than external space [36,68].
It is reasonable that musicians have a stronger association between sensory modalities as learning musical instruments involves the interaction of serval modalities and high-order cognitive functions [69]. For example, crowding effect is a phenomenon that each musical note is crowded by an adjacent note on the five-line staff, which slows down music-reading. However, with extensive practices, musicians would acquire specific music-reading visual skills to tackle this crowding effect and eventually develop better visual spatial resolution [70]. As illustrated by this example, music training not only enhances auditory perception but also visual spatial ability.
4.4 Limitations and Future Studies
One of the major limitations of this study was the fatigue effect. As the study proceeded around thirty minutes and consisted of both experimental and control sessions, the participants might feel tired to do the experiments. Considering this, they might react to the program randomly. Hence, the recorded FDL might not reflect the true FDL of the participants, which impaired the internal validity of FDL. It is recommended to apply another simpler experimental design to find out the FDL in the future. To be specific, a ‘ABX’ paradigm, in which participants are asked to answer whether tone X is equal to tone A or tone B, is a simpler method to determine the FDL.
Another limitation was the design of visual cues. Participants might ignore the visual cues and might only focus on the sound track. Therefore, the visual cues might not be effective to induce the expected visual-auditory interaction. To improve the study, a pilot test is recommended. For example, before testing the FDL, it is better to apply visual cues to a discrete frequency discrimination task with a larger and more obvious frequency change. By checking the accuracy, the effectiveness of the visual cues can be guaranteed.
The VVIQ score and the background questionnaire were applied to identify synesthetic experiences. Very few participants in the current study reported such experiences. It is suggested that the sample size should be enlarged to recruit participants who are potentially synesthetic.
Future studies may also be carried out to explore the mechanisms of perceiving gliding upwards and downwards frequencies given the observed two different results of the FDL in the gliding upwards and downwards frequencies.
Last but not least, the effect of music training was found to be prominent in minimizing FDLs., Future studies may explore the effect of music practice on other perceptual limits, such as visual acuity and picture resolution.
5. Conclusions
In conclusion, this study investigated the effect of visual cues, blindfold, synesthetic experience and music training on behavioral FDLs. Although FDLs were not significantly lowered by visual cues and synesthetic experience, there was a trend that blindfolding would reduce FDLs. The common resource theory is slightly supported because visual deprivation implies more resources being allocated to auditory perception. Participants who had synesthetic experience and those who did not performed similarly in the FDL tasks. However, very few participants in the current study reported synesthetic experiences. Therefore, whether synesthetes might have a similar FDL requires further investigation. Finally, music training could lower FDLs. This suggests that perceptual limits in auditory perception can be overcome through practice.
6. Patents
References
1. Xu, Q.; Gong, Q. Frequency difference beyond behavioral limen reflected by frequency following response of human auditory Brainstem. Biomed Eng Online 2014, 13, 114, http://dx.doi.org/10.1186/1475-925x-13-114. 2. Formby, C. Differential sensitivity to tonal frequency and to the rate of amplitude modulation of broadband noise by normally hearing listeners. J. Acoust. Soc. Am. 1985, 78, 70-77, http://dx.doi.org/10.1121/1.392456. 3. Baharloo, S.; Johnston, P.A.; Service, S.K.; Gitschier, J.; Freimer, N.B. Absolute Pitch: An Approach for
Identification of Genetic and Nongenetic Components. Am. J. Hum. Genet. 1998, 62, 224-231, http://dx.doi.org/10.1086/301704.
4. Nelson, D.A.; Stanton, M.E.; Freyman, R.L. A general equation describing frequency discrimination as a function of frequency and sensation level. J. Acoust. Soc. Am. 1983, 73, 2117-2123, http://dx.doi.org/10.1121/1.389579.
5. Micheyl, C.; Xiao, L.; Oxenham, A.J. Characterizing the dependence of pure-tone frequency difference limens on frequency, duration, and level.Hear. Res. 2012,292, 1-13, http://dx.doi.org/10.1016/j.heares.2012.07.004.
6. Freyman, R.L.; Nelson, D.A. Frequency discrimination as a function of tonal duration and excitation‐ pattern slopes in normal and hearing‐impaired listeners. J. Acoust. Soc. Am. 1986, 79, 1034-1044, http://dx.doi.org/10.1121/1.393375.
7. Wier, C.C.; Jesteadt, W.; Green, D.M. Frequency discrimination as a function of frequency and sensation level.J. Acoust. Soc. Am. 1977,61, 178-184, http://dx.doi.org/10.1121/1.381251.
8. Lyzenga, J.; Carlyon, R.P.; Moore, B.C.J. The effects of real and illusory glides on pure-tone frequency discrimination. J. Acoust. Soc. Am. 2004, 116, 491-501, http://dx.doi.org/10.1121/1.1756616.
9. Dai, H.; Micheyl, C. Psychometric functions for pure-tone frequency discrimination. J. Acoust. Soc. Am.
2011, 130, 263-272, 10.1121/1.3598448.
10. Harris, J.D. Pitch discrimination. J. Acoust. Soc. Am. 1952, 24, 750-755. http://dx.doi.org/10.1121/1.1906970. 11. Hartmann, W.M.; Rakerd, B.; Packard, T.N. On measuring the frequency-difference limen for short
tones. Percept Psychophys 1985, 38, 199-207, 10.3758/bf03207145.
12. Moore, B.C.J. Frequency difference limens for short‐duration tones. J. Acoust. Soc. Am. 1973, 54, 610-619, doi: 10.1121/1.1913640.
13. Wier, C.C.; Jesteadt, W.; Green, D.M. A comparison of method-of-adjustment and forced-choice procedures in frequency discrimination. Percept Psychophys 1976, 19, 75-79, 10.3758/bf03199389.
14. Bulkin, D.A.; Groh, J.M. Seeing sounds: visual and auditory interactions in the brain. Curr. Opin. Neurobiol.
2006, 16, 415-419, http://dx.doi.org/10.1016/j.conb.2006.06.008.
15. Hirata, Y.; Kelly, S.D. Effects of lips and hands on auditory learning of second-language speech sounds.J. Speech Lang. Hear. Res. 2010, 53, 298-310, http://dx.doi.org/10.1044/1092-4388(2009/08-0243).
16. Wickens, C.D. Multiple resources and performance prediction. Theor Issues Ergon Sci 2002, 3, 159-177, http://dx.doi.org/10.1080/14639220210123806.
17. Marks, L.E. On cross-modal similarity: Auditory-visual interactions in speeded discrimination.J Exp Psychol Hum Percept Perform 1987, 13, 384-394, http://dx.doi.org/10.1037//0096-1523.13.3.384.
18. Ben-Artzi, E.; Marks, L.E. Visual-auditory interaction in speeded classification: Role of stimulus difference. Percept Psychophys 1995, 57, 1151-1162, http://dx.doi.org/10.3758/bf03208371.
19. Busse, L.; Roberts, K.C.; Crist, R.E.; Weissman, D.H.; Woldorff, M.G. The spread of attention across modalities and space in a multisensory object. Proc. Natl. Acad. Sci. U. S. A. 2005, 102, 18751-18756, http://dx.doi.org/10.1073/pnas.0507704102.
20. Abadi, R.V.; Murphy, J.S. Phenomenology of the sound-induced flash illusion. Exp Brain Res 2014, 232, 2207-2220, http://dx.doi.org/10.1007/s00221-014-3912-2.
21. Alais, D.; Burr, D. The ventriloquist effect results from near-optimal bimodal integration. Curr Biol 2004, 14, 257-262, http://dx.doi.org/10.1016/j.cub.2004.01.029.
22. Mcgurk, H.; Macdonald, J. Hearing lips and seeing voices. Nature 1976, 264, 746-748, http://dx.doi.org/10.1038/264746a0.
24. Kahneman, D. Attention and Effort; Prentice-Hall: Englewood Cliffs, NJ, 1973; 978-0130505187.
25. Taylor, M.M.; Lindsay, P.H.; Forbes, S.M. Quantification of shared capacity processing in auditory and visual discrimination. Acta Psychol 1967, 27, 223-229, http://dx.doi.org/10.1016/0001-6918(67)99000-2. 26. Ciaramitaro, V.M.; Chow, H.M.; Eglington, L. G. Cross-modal attention influences auditory contrast
sensitivity: Decreasing visual load improves auditory thresholds for amplitude- and frequency-modulated sounds.J Vis 2017,17, 20, http://dx.doi.org/10.1167/17.3.20.
27. Bonnel, A.M.; Haftser, E.R. Divided attention between simultaneous auditory and visual signals. Percept Psychophys 1998, 60, 179-190, 10.3758/bf03206027.
28. Wahn, B.; König, P. Audition and vision share spatial attentional resources, yet attentional load does not disrupt audiovisual integration.Front Psychol 2015,6, http://dx.doi.org/10.3389/fpsyg.2015.01084.
29. Gherri, E.; Eimer, M. Active listening impairs visual perception and selectivity: an ERP study of auditory dual-task costs on visual attention. J Cogn Neurosci 2011, 23, 832-844, http://dx.doi.org/10.1162/jocn.2010.21468.
30. Razon, S.; Basevitch, I.; Land, W.; Thompson, B.; Tenenbaum, G. Perception of exertion and attention allocation as a function of visual and auditory conditions. Psychol Sport Exerc 2009, 10, 636-643, http://dx.doi.org/10.1016/j.psychsport.2009.03.007.
31. Cowan, N.; Barron, A. Cross-modal, auditory-visual Stroop interference and possible implications for speech memory.Percept Psychophys 1987,41, 393-401, http://dx.doi.org/10.3758/bf03203031.
32. Gaab, N.; Schulze, K.; Ozdemir, E.; Schlaug, G. Neural correlates of absolute pitch differ between blind and sighted musicians.Neuroreport 2006,17, 1853-1857, http://dx.doi.org/10.1097/wnr.0b013e3280107bee. 33. Hamilton, R.H.; Pascual-Leone, A.; Schlaug, G. Absolute pitch in blind musicians. Neuroreport 2004, 15,
803-806, http://dx.doi.org/10.1097/00001756-200404090-00012.
34. Landry, S.P.; Shiller, D.M.; Champoux, F. Short-term visual deprivation improves the perception of harmonicity. J Exp Psychol Hum Percept Perform 2013, 39, 1503-1507, http://dx.doi.org/10.1037/a0034015. 35. Williams, P. Visual Project Management, 1st ed.; Lulu. com, 2015; 978-1312827165
36. Eagleman, D.M.; Kagan, A.D.; Nelson, S.S.; Sagaram, D.; Sarma, A.K. A standardized test battery for the study of synesthesia. J. Neurosci. Methods 2007, 159, 139-145, http://dx.doi.org/10.1016/j.jneumeth.2006.07.012.
37. Lehman, R.S. A multivariate model of synesthesia. Multivariate Behav Res 1972, 7, 403-439, http://dx.doi.org/10.1207/s15327906mbr0704_1.
38. Sagiv, N.; Ward, J. Crossmodal interactions: lessons from synesthesia. Prog. Brain Res. 2006, 259-271, http://dx.doi.org/10.1016/s0079-6123(06)55015-0.
39. Hubbard, E.M.; Arman, A.C.; Ramachandran, V.S.; Boynton, G.M. Individual differences among grapheme-color synesthetes: brain-behavior correlations. Neuron 2005, 45, 975-985, http://dx.doi.org/10.1016/j.neuron.2005.02.008.
40. Neufeld, J.; Sinke, C.; Zedler, M.; Dillo, W.; Emrich, H.M.; Bleich, S.; Szycik, G.R. Disinhibited feedback as a cause of synesthesia: Evidence from a functional connectivity study on auditory-visual
synesthetes. Neuropsychologia 2012, 50, 1471-1477,
http://dx.doi.org/10.1016/j.neuropsychologia.2012.02.032.
41. Barnett, K.J.; Newell, F.N. Synaesthesia is associated with enhanced, self-rated visual imagery. Conscious Cogn 2008, 17, 1032-1039, http://dx.doi.org/10.1016/j.concog.2007.05.011.
42. Bor, D.; Rothen, N.; Schwartzman, D.J.; Clayton, S.; Seth, A.K. Adults can be trained to acquire synesthetic experiences. Sci Rep 2014, 4, http://dx.doi.org/10.1038/srep07089.
43. Neufeld, J.; Sinke, C.; Dillo, W.; Emrich, H.M.; Szycik, G.R.; Dima, D.; Bleich, S.; Zedler, M. The neural correlates of coloured music: A functional MRI investigation of auditory–visual synaesthesia. Neuropsychologia 2012, 50, 85-89, http://dx.doi.org/10.1016/j.neuropsychologia.2011.11.001. 44. Saenz, M.; Koch, C. The sound of change: visually-induced auditory synesthesia. Curr. Biol. 2008, 18,
R650-R651, http://dx.doi.org/10.1016/j.cub.2008.06.014.
46. Kishon-Rabin, L.; Amir, O.; Vexler, Y.; Zaltz, Y. Pitch discrimination: are professional musicians better than non-musicians? J Basic Clin Physiol Pharmacol 2001, 12, http://dx.doi.org/10.1515/jbcpp.2001.12.2.125 47. Nikjeh, D.A.; Lister, J.J.; Frisch, S.A. Hearing of note: An electrophysiologic and psychoacoustic comparison of pitch
discrimination between vocal and instrumental musicians. Psychophysiology 2008, 45, 994-1007, http://dx.doi.org/10.1111/j.1469-8986.2008.00689.x.
48. Tervaniemi, M.; Just, V.; Koelsch, S.; Widmann, A.; Schröger, E. Pitch discrimination accuracy in musicians vs nonmusicians: an event-related potential and behavioral study. Exp Brain Res 2004, 161, 1-10, http://dx.doi.org/10.1007/s00221-004-2044-5.
49. Gottfried, T.L.; Riester, D. Relation of pitch glide perception and Mandarin tone identification. J. Acoust. Soc. Am.2000, 108, 2604, https://doi.org/10.1121/1.4743698.
50. Demany, L.; Carlyon, R.P.; Semal, C. Continuous versus discrete frequency changes: Different detection mechanisms?J. Acoust. Soc. Am. 2009,125, 1082-1090, http://dx.doi.org/10.1121/1.3050271.
51. Note Names, MIDI Numbers and Frequencies. 2017. Available online: http://newt.phys.unsw.edu.au/jw/notes.html (accessed on 17 August 2018)
52. Geringer, J.M. Tuning preferences in recorded orchestral music. J Res Music Educ 1976, 24, 169, http://dx.doi.org/10.2307/3345127.
53. Lutman, M.E. Frequency discrimination test. 2004. Available online: http://resource.isvr.soton.ac.uk/audiology/Software/FD_test.htm (accessed on 17 August 2018)
54. Handel, S. Perceptual Coherence: Hearing and Seeing; Oxford University Press: Oxford, 2007; pp. 73-74, 978-0195169645.
55. Klatt, D.H. Discrimination of fundamental frequency contours in synthetic speech: implications for models of pitch perception. J. Acoust. Soc. Am. 1973, 53, 8-16. http://dx.doi.org/10.1121/1.1913333.
56. Tsubomi, H.; Kondo, H.; Watanabe, K. Common capacity limit for visual perception and working memory. J Vis 2010, 8, 205-205, http://dx.doi.org/10.1167/8.6.205.
57. Masaoka, K.; Niida, T.; Murakami, M.; Suzuki, K.; Sugawara, M.; Nojiri, Y. Perceptual limit to display resolution of images as per visual acuity. Hum. Vis. Electron. Imaging XIII 2008, 6806, 68061G1-68061G9, http://dx.doi.org/10.1117/12.767143.
58. Demany, L.; Pressnitzer, D.; Semal, C. Tuning properties of the auditory frequency-shift detectors. J. Acoust. Soc. Am. 2009, 126, 1342-1348, http://dx.doi.org/10.1121/1.3179675.
59. Semal, C.; Demany, L. Individual differences in the sensitivity to pitch direction. J. Acoust. Soc. Am.
2006, 120, 3907-3915, 10.1121/1.2357708.
60. Lewald, J. More accurate sound localization induced by short-term light deprivation. Neuropsychologia
2007, 45, 1215-1222, http://dx.doi.org/10.1016/j.neuropsychologia.2006.10.006.
61. Rutherford, W. A new theory of hearing. J Anat Physiol 1886, 21, 166-168, PMC1288671.
62. Yeomans, J. The absolute refractory periods of self-stimulation neurons. Physiol. Behav. 1979, 22, 911-919, 10.1016/0031-9384(79)90336-6.
63. Békésy, G.V. Experiments in Hearing; McGraw Hill: New York, 1960; 978-0883186305
64. Banissy, M.J.; Walsh, V.; Ward, J. Enhanced sensory perception in synaesthesia. Exp Brain Res 2009, 196, 565-571, http://dx.doi.org/10.1007/s00221-009-1888-0.
65. Micheyl, C.; Delhommeau, K.; Perrot, X.; Oxenham, A.J. Influence of musical and psychoacoustical training on pitch discrimination. Hear. Res. 2006, 219, 36-47, http://dx.doi.org/10.1016/j.heares.2006.05.004.
66. Bianchi, F.; Santurette, S.; Wendt, D.; Dau, T. Pitch discrimination in musicians and non-musicians: effects of harmonic resolvability and processing effort. J. Assoc. Res. Otolaryngol. 2015, 17, 69-79, http://dx.doi.org/10.1007/s10162-015-0548-2.
67. Schellenberg, E.G.; Moreno, S. Music lessons, pitch processing, and g. Psychol Music 2009, 38, 209-221, 10.1177/0305735609339473.
68. Dixon, M.J.; Smilek, D.; Merikle, P.M. Not all synaesthetes are created equal: Projector versus associator synaesthetes. Cogn Affect Behav Neurosci 2004, 4, 335-343, http://dx.doi.org/10.3758/cabn.4.3.335.
69. Herholz, S. C.; Zatorre, R. J. Musical training as a framework for brain plasticity: behavior, function, and structure. Neuron 2012, 76, 486-502, http://dx.doi.org/10.1016/j.neuron.2012.10.011.