VISUALIZATION OF CAVITATING MICRO JETS
Róbert OLŠIAK, Branislav KNÍŽAT, Marek MLKVIKxAbstract: The paper deals with one experimental set up integrated for research of the cavitating micro flows, which is incipient behind the micro channel or micro discharge nozzle outlet port. Experimental system is integrated from three major systems: hydraulic circuit with installed discharge nozzle (or micro channel), subsystem for data acquisition and data processing (DAQ system) and vision system compound of high speed video camera and pulse light source with high-frequency repetition. First few results of experiments (parameters such as inlet pressure, downstream pressure were changed) is also discussed.;
1. INTRODUCTION
Most publications, where presenting results of their work are most often focused on the fluid flow in channels of very small scales, where the cross section of the channel is of a non-circular shape (rectangular, square, trapezoidal….). Hydraulic characteristics of the tested micro fluidics devices are strictly depending on used manufacturing technology (most often technologies also used in manufacturing of semiconductors, MEMS components etc.: lithography, microlithography, etching wet process, dry process [6], micromachining, etc.). In the next part of the paper there are described experiments focused on the analysis of cavitation beginning and continuance by a high speed flow through the jet of a microscopic scale. For experimental research of cavitation in hydraulics devices with micro scale is used experimental test ring, which enabling investigation of cavitation (bubble, cloud) by visualisation method in parallel with measurement of hydraulic parameters and cavitation attendants (e.g. acoustic emission, noise, luminescence, etc). Results from realised experiments are analysed by advanced digital signal processing methods (vision data and DAQ data too).
2. T
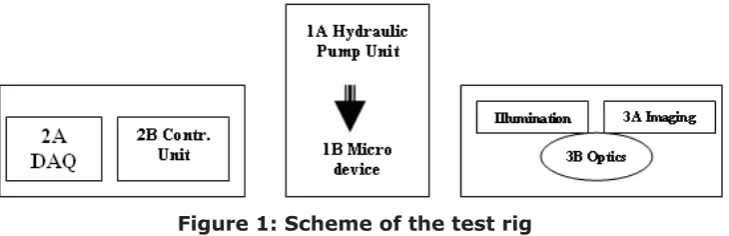
EST RIG LAYOUTExperimental system is integrated from three major systems: hydraulic circuit with installed discharge nozzle (or micro channel), system for data acquisition and data processing (DAQ system) and vision system compound of high speed video camera and pulse light source with high-frequency repetition. All of the systems are assembled from great number of subsystems and separate component, however, test rig is relatively complicated technical equipment. The block diagram introducing of the test rig is in the Figure 1. In the following are described the subsystems and components (with briefly definition of his functions and parameters). Functions and parameters of assembled
x Róbert Olšiak ([email protected]), Branislav Knížat ([email protected]), Marek Mlkvik ([email protected])
subsystem and components having fundamental influence on application field and quality and quantity of the experimental data, they will be discussed in next chapters.
Hydraulic circuit (Figure 1. sign. 1A) includes: the model of the investigated micro devices (micro orifice, channel, etc.) placed on the carrier unit made from a transparent material. Modular design of this component is enabling easy modify and change construction parts.
Hydraulic subsystem (sign. 1B) consisting of a source of hydraulic fluid on the inlet port of the channel (hydraulic pump unit) and vacuum recipient on the outlet port. For more information about hydraulic circuit see previous papers [7].
Figure 1: Scheme of the test rig
DAQ & Control Unit (Figure 1. sign. 2A, and 2B), where is used for measurement of physical parameters, transmission, archiving and manipulation with non-visual data. System is built-in as a Power Workstation (inside INTEL Xeon processor) with add on PCI, resp. PCI-e DAQ and Control card. For visual observation cavitation (bubble or cloud) the vision system is necessary. Vision system, in presented application, is built-up from three subsystems (Figure 1. sign. 3A, 3B and 3C). The first: digital imaging subsystem 3A, is intended for video data capturing and transferring to DAQ system. The second: optics subsystem 3B is intended for transport of the optical data (optical image) to vision subsystem. The third: illumination subsystem 3C, is intended for illuminate of examined phenomenon.
3. V
ISION SYSTEM DESCRIPTIONThe setup with three cameras has been used for further visualization analysis: - 1st configuration based on commercial digital camera OLYMPUS 7070 WZ, capture stationary images or color video stored in XD memory card. Only local display, export video data is necessary.
- 2nd configuration based on laboratory HiRes analog video camera SONY ExWave (CCD sensor inside). Analog video signal is attached to DAQ Workstation via High Performance PCI Frame Grabber National Instruments.
- 3th configuration based on High Speed digital video camera Redlake Y3 (CMOS sensor inside). Video data are stored in embedded video memory, and consequently transferred in DAQ Workstation via USB or Giga Ethernet link.
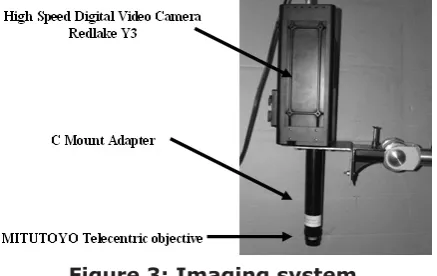
All digital imaging systems is fitted with optical equipment. Camera OLYMPUS 7070 WZ is used with integrated lenses OLYMPUS ED WIDE 5.7-22.9, f 1:208-4.8. HiRes analog video camera SONY ExWave is used with microscopic objectives build in laboratory microscope LEICA. High Speed digital video camera Redlake Y3 is used with NIKON 50 f 0.98 objective or MITUTOYO telecentric objectives (constant magnification). They are easily integrated into C-Mount imaging systems with our Mitutoyo C-Mount camera tube, Figure 3. What are preference of latest configuration? Long Working Distances allow for integration into Vision Measurement System (much greater than laboratory microscope). Compact Design and long parfocal length simplifies mounting (needed for test rig modification). Mitutoyo telecentric objectives are ideal for high-resolution, high power vision measurement and optical gauging systems (e.g. small or moving objects).
Figure 3: Imaging system
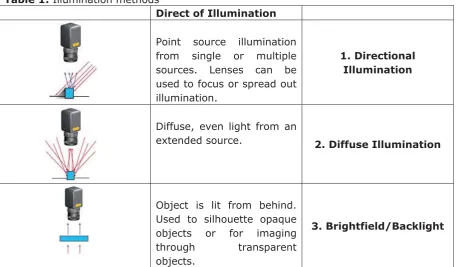
Table 1: Illumination methods
Direct of Illumination
Point source illumination from single or multiple sources. Lenses can be used to focus or spread out illumination.
1. Directional Illumination
Diffuse, even light from an
extended source. 2.Diffuse Illumination
Object is lit from behind. Used to silhouette opaque objects or for imaging through transparent objects.
3. Brightfield/Backlight
Usage of various light sources for illumination is possible. In discussed application is used:
continual microscopic light source (adjustable temperature and wavelength), pulse laser light
(green diode module), spark flash lamp (white light mono flash with high energy, or high
repetition flashes with low energy).
4. DAQ AND CONTROL
5. RESULTS AND DUSCUSSION
Vision system setup
Camera OLYMPUS 7070 WZ Diffuse Illumination
Continual microscopic light source
Figure4: Set of experimental video data.
Vision system setup
SONY ExWave Diffuse Illumination
Continual microscopic light source
Figure5: Set of experimental video data.
Vision system setup
Redlake Y3
Diffuse Illumination
Continual microscopic light source
Figure6: Set of experimental video data.
Vision system setup
Redlake Y3
Brightfield/Backlight Spark flash lamp
6. CONCLUSIONS
Using of a high speed camera in combination with telecentric objective and pulse white light illumination is very helpful in research of fluid flow in channels of all sizes. In Figure 8 is presented cavitation cloud in the small space inside a microchannel, where a simple flow is assumed, a very complicated flow with number of vortexes can develop as a result of high speeds. The video sequence clearly shows that the cavitation cloud is of a very dynamic structure, pulsing and changing its shape and size in frequency higher than 2 kHz. The frequency of capturing is only one of influences which determines the quality of the video. Time of exposition is also very important factor which has a very strong influence on sharpness of the pictures. To “freeze” the motion, this time must be set to value less than 10s for conditions of our experiment. For exposition short like this, a very intensive illumination is necessary. Illumination is reached by laboratory light source with fibre optics. Through these fibres the light is conducted to the area of the cavitation cloud. It can be testified that the problem of illumination is handled on a very good level and the system of illumination does not need to be changed in the near future.
7. R
EFERENCES[1] Brennen C.E.: Cavitation and Bubble Dynamics, New York, Oxford, Oxford University Press, 1995
[2] Bahrami M, Yovanovich MM, Culham JR, Pressure drop of fully developed, laminar flow in rough microtubes, PROCEEDINGS OF 3rd INTERNATIONAL CONFERENCE ON MICROCHANNELS AND MINICHANNELS, TORONTO, CANADA, 2005
[3] GAD-EL-HAK, M. The MEMS Handbook. Introduction and Fundamentals. CRC Press Taylor & Francis Group, 2006.
[4] Hutli E.A, Nedeljkovic, M. Ilic V.: Visualization of Submerged Cavitating Jet: Part One, 16th Australasian Fluid Mechanics Conference Crown Plaza, Gold Coast, Australia 2-7 December 2007, pages 876-880
[5] Chandan M., Peles Y.: Cavitation in flow through a micro-orifice inside a silicon microchannel, PHYSICS OF FLUIDS 17, 013601 (2005), pages 013601-1, 013601-15
[6] NGUYEN, T. N., WERELEY, S. T. Fundamentals and applications of microfluidics. Artech house, 2006.
[7] OLŠIAK, R. Experimentálne zariadenie na výskum prúdenia v kanáloch vemi malých rozmerov, Zborník XVII medzinárodnej vedeckej konferencie „Aplikácia experimentálnych a numerických metód v mechanike tekutín a v energetike“, Bojnice 2010, ISBN 978-80-554-0189-8