Aus dem Institut für Klinische Radiologie der Ludwig-Maximilians-Universität Direktor: Prof. Dr. med. Dr. h. c. Maximilian Reiser, FACR, FRCR
Gender- and Age-Dependent Brand Perception
Evaluation of Cortical Activation Patterns with
Functional Magnetic Resonance Imaging
Dissertation
zum Erwerb des Doktorgrades der Humanmedizin an der medizinischen Fakultät der
Ludwig-Maximilians-Universität zu München
Vorgelegt von
Anikó Steffanie Ute Sztrókay
aus Salzburg
Mit Genehmigung der Medizinischen Fakultät
der Universität München
Berichterstatter: Prof. Dr. med. Dr. h. c. Maximilian Reiser, FACR, FRCR
Mitberichterstatter: Prof. Dr. rer. nat. Dr. med. habil. Till Roenneberg Prof. Dr. med. Axel Steiger
Mitbetreuung durch den promovierten Mitarbeiter: PD Dr. med. Thomas Meindl
Dekan: Prof. Dr. med. Dr. h. c. Maximilian Reiser, FACR, FRCR
Abstract
Background:
Neuroimaging studies today are of great interest for marketing strategists who try to understand the different brand perception of people. Using modern imaging methods, researchers are now able to go beyond marketing surveys and gather information on how the brain responds to a particular brand at the most basic level. This study was performed to evaluate differences of brain activation while watching different title pages of well known german news magazines. Of particular interest are the differences in brand awareness between the age classes and genders.
Methods:
Within the framework of this study 31 participants were examined. The functional magnetic resonance imaging (fMRI) examination took place at the Institute for Clinical Radiology of the Ludwig-Maximilians-University, Munich in Großhadern. For the scans an ultra high field MRI (3.0T, Magnetom, Siemens, Erlangen, Germany) was used. The preconditions for the participants were physical and psychological health, as well as brand knowledge of the three magazines and an appropriate reading condition. The participants were recruited from three age classes (young: 20-35y; middle: 36-49y; elderly: 50-65y) and gender classes (16 women; 15 men). The precondition was that each age class or gender class has the same allocation of participants. For the beginning of the fMRI experiment, the nature, the rules and possible risks of the experiment were explained to each participant included. The study was approved by the Ethics Committee of the Medical Faculty of Ludwig-Maximilians-University Munich.
Objective:
It was the aim of the study to evaluate the neural correlates of brand perception with special regard to the difference between age classes and gender classes. The brands referred to three different well-known German news magazines (Brand1, 2 and 3, respectively).
Results:
There were clear distinctions discovered between the different news magazines with regard to the brain activation. In this connection the central issue was made by the different lateralization of the brain activation.
Brand2 showed a left dominant activation pattern whereas Brand1 and Brand3 showed a right dominant activation pattern. In comparison Brand1 and Brand3 showed a weaker brand perception and brand presence. These results correlated with the evaluation of the questionnaires.
Equally, clear results are shown by the differentiation between the three age classes. While the young participants had a left dominant activation pattern and had the lowest activation in comparison with the other age classes, the middle-old and elderly subjects showed a bilateral activation with increasing activity in correlation to the age. This holds for all three age classes and showed that the age dependent decreasing brain achievement is compensated by increasing brain activation. Besides, the left dominance of the young could be explained by a more emotional brand perception in comparison to the elderly. The elderly participants evaluated brands more rationally because of their life experience.
The comparison of gender showed clear distinctions, too. The men showed a right dominance with high brain activity. This could be interpreted as a rational and less emotional evaluation. In comparison to this the women showed a clear left dominance with lower activity.
Conclusion:
Deutsche Übersetzung der Zusammenfassung
Hintergrund:
Kernpunkt der Arbeit war die Evaluation von kortikalen Aktivierungen während der visuellen Präsentation verschiedener Marken (es handelte sich hierbei um drei bekannte deutsche Nachrichtenmagazine) mittels funktioneller Magnetresonanztomographie (fMRT). Besonderes Augenmerk lag hierbei auf den Geschlechts- und Altersunterschieden. Das Gehirn mit seinen komplexen Funktionen und Strukturen ist nach wie vor ein Feld von höchstem Interesse für die Wissenschaft, die das Geheimnis um den Ursprung der Gefühle, des Denkens, der Entscheidungsfindung und anderer Gehirnaktivierungen zu lösen versucht. Studien mit Hilfe der funktionellen Magnettomographie sind von großem Interesse in der Marktforschung, die sich erhofft, die unterschiedliche Markenwahrnehmung und Markenbevorzugung der Konsumenten zu verstehen. Mit dieser neuen bildgebenden Methode ist es nun möglich über die Marktforschung hinaus Informationen darüber zu sammeln, auf welche Weise das Gehirn auf bestimmte Marken reagiert.
Methoden:
waren mit kurzen Fragen untertitelt, die der Proband mit Hilfe von vier verschiedenen Druckknöpfen auf einer Skala von 1-4 spontan zu bewerten hatte.
Ziele:
Ziel der Studie war es die kortikalen Aktivierungen während der visuellen Stimulation mit verschiedenen Marken zu evaluieren. Bei den Marken handelte es sich um drei bekannte deutsche Nachrichtenmagazine (Marke1, 2 und 3), deren Titelbilder miteinander verglichen wurden.
Ergebnisse:
Es wurden klare Unterschiede zwischen den verschiedenen Magazinen hinsichtlich ihrer Auswirkung auf die Hirnaktivierung entdeckt. Kernpunkt hierbei war die unterschiedliche Lateralisation der Hirnaktivierungen.
Marke2 zeigte ein linksdominantes Aktivierungsmuster wohingegen Marke1 und Marke3 ein rechtsdominantes Aktivierungsmuster aufwiesen. Dies spricht für eine gute Markenwahrnehmung der Marke2 und, auf Grund der insgesamt am niedrigsten Aktivierungsgröße, auch für eine anstrengungslose Verarbeitung, welche für eine gute Markenpräsenz spricht. Marke1 und Marke3 wiesen dagegen eine schwächere Markenpräsenz und Markenwahrnehmung auf. Diese Ergebnisse wurden auch durch die Fragebogenauswertung gestützt.
Klare Ergebnisse zeigte auch die Differenzierung zwischen den drei Altersklassen. Während die jungen Probanden ein linksdominantes Aktivierungsmuster aufwiesen und im Vergleich zu den anderen Altersklassen eine insgesamt niedrigere Aktivität, zeigten die Probanden der mittlern und älteren Altersklassen eine beidseitige Aktivierung mit ansteigenden Aktivierungen im Verhältnis zum steigenden Alter auf. Dies war für alle drei Marken gleich und könnte darauf hinweisen, dass mit zunehmendem Alter die sinkende Leistung der ursprünglich aktiven Hirnregionen durch eine Umverteilung und steigende Aktivierung kompensiert wird. Die Linksdominanz in jungen Jahren könnte mit einer emotionaleren Markenwahrnehmung erklärt werden, wohingegen die älteren, erfahreneren Probanden die Marken eher nüchterner bewerteten.
Linksdominanz mit niedrigerer Hirnaktivität aufwiesen, was wiederum als emotionale Beurteilung des Gesehenen interpretiert werden könnte.
Ausblick:
Gender- and Age-Dependent Brand Perception
Evaluation of Cortical Activation Patterns with
Functional Magnetic Resonance Imaging
Table of Contents:
1
Introduction ... 1
1.1
Role of fMRI in Cognitive Neuroscience ...3
1.2
Magnetic Resonance Imaging...4
1.3
Functional MRI...7
1.4
Perception of Brand-related Information - the Mechanism of Brain
Branding...9
1.5
Differences between Age and Gender in fMRI ...11
2
Working Hypothesis... 13
3
Materials and Methods ... 17
3.1
Subjects...19
3.2
Methods ...20
3.2.1 Functional (fMRI) Data Acquisition and Data Analysis... 20
3.2.1.1 Data Acquisition ... 20
3.2.1.2 Data Analysis... 21
3.2.1.2.1 Data Post-processing...21
3.2.1.2.2 Statistical Analysis ... 21
3.2.2 Stimuli and Experimental Design... 22
3.3
Questionnaires ...24
4
Results ... 27
4.1
Behavioural Response Data ...29
4.1.1 Brand1 vs. Brand2 vs. Brand3... 29
4.1.2 Age Class... 31
4.1.3 Gender ... 35
4.2
Brain Activation during the Perception of Stimuli ...39
4.2.1 Brand1 vs. Brand2 vs. Brand3... 40
4.2.2 Age Class... 45
4.2.3 Gender ... 58
4.3
Correlation with Questionnaires ...66
4.3.1 Brand1 vs. Brand2 vs. Brand3... 66
4.3.2 Age Class... 67
5
Discussion... 71
5.1
Differences in Cortical Activation between Brand 1, 2 and 3 ...73
5.2
Age Class ...79
5.3
Gender...83
5.4
Prospects ...85
6
Conclusion... 87
7
List of Figures... 91
8
List of Tables ... 95
9
Bibliography ... 101
Acknowledgment ... 109
List of Abbreviations
Ant. INS Anterior Insula
ACPC Anterior Commissur Posterior Commissur
BA Brodmann Area
BOLD Blood Oxygenation Level Dependent
BV Brain Voyager
CBF Cerebral Blood Flow CBV Cerebral Blood Volume
Cu Cuneus
DTPA Diethylene Triamine Pentaacetic Acid EPI Echo Planar Imaging
FA Flip Angle
FDR False Discovery Rate
fMRI Functional Magnetic Resonace Imaging FoV Field of View
GC Cingulate gyrus (Gyrus cinguli)
GFd Gyrus frontalis superior pars medialis (Gyrus frontalis medialis) GFi Inferior frontal gyrus (Gyrus frontalis inferior)
GFm Middle frontal gyrus (Gyrus frontalis medius) GML General Linear Model
Gsm Supramarginal gyrus (Gyrus supramarginalis) GTm Middle temporal gyrus (Gyrus temporalis medius) GTs Superior temporal gyrus (Gyrus temporalis superior) HF-Impuls High Frequence Impulse
Loc Localisation
LPi Inferior parietal lobule (Lobus parietalis inferior)
MPRAGE Magnetization Prepared Rapid Acquisition Gradient Echo
MR Magnetic Resonance
NC Caudate nucleus (Nucleus caudatus)
PACS Picture Archiving and Communicating System
PCu Precuneus
Pu Putamen
SPSS Statistical Package for the Social Sciences
T Tesla
TE Echo Time
TR Repitition Time
VS Versus
„The processes in brain come just as near to the science as the source of universe.” (Antonio Damasio, University of Iowa, Neurology) (1).
Up to these days the brain with its complex functions and structures has been a field of highest scientific interest. Many scientists are still questing to disclose the secrets of feelings, thinking, decision making and other brain activations.
What are the structures that coordinate information and where does defined thinking take place? How does decision making take place in daily life? Does the thinking of elderly people differ from that ofyoung people or is it indistinguishable? Are there any differences between the gender classes and if so, what are the differences and how do they look like?
1.1
Role of fMRI in Cognitive Neuroscience
In the past cognitive neuroscience, which tries to understand correlations between cognitive phenomena and biological patterns, definitely made a lot of effort using electroencephalography, positron emission tomography or single photon emission tomography and provided a basis for today’s research, but it is only since functional magnetic resonance imaging has been established that cognitive neuroscience made a great leap in development.
Thus technical effort has been able to cast some light on this field of research and during the last fifteen years a kind of revolution in cognitive neuroscience took place because of the new imaging technique. The study of human brain function has been greatly facilitated by neuroimaging techniques that enabled research on increasingly complex cognitive phenomena, including emotions, personality features, and real-world behaviours.
This progress was the result of the invention of functional magnetic resonance imaging (fMRI) in 1990. Since then, fMRI has proven a useful tool for observing neural BOLD (blood-oxygenation-level dependent) signal changes during complex cognitive and emotional tasks. Functional magnetic resonance imaging is of particular interest for widespread non-invasive (therefore allowing a greater degree of repeatability than before) and widespread use by the research community.
The application of fMRI can be compared to a window opening up on the human brain works, awareness processes, decision-making and assimilation. The human brain is no longer a “black box”. The conscious and unconscious processes of the brain can be better understood and the respective shares of cognitive and affective processes of brain regions can be determined. The direction (positive or negative), the intensity and kind of affects (i.e. happiness, anger and sorrow) can be understood (2).
1.2
Magnetic Resonance Imaging
The advantages of magnetic resonance imaging are its high spatial resolution and contrast, its lack of ionising radiation and its ability to make the images sensitive for blood flow and blood composition, therefore providing a method of measuring the function of neurons by virtue of their localised coupling to hemodynamics in brain.
The magnetic properties of haemoglobin were discovered by Pauling and Coryell as early as in 1936 (3). The technical principle of MRI was discovered by Bloch and Purcell in 1946 and forty-four years later (1990) (4) researchers found out that the properties of haemoglobin can be used for measuring brain activity in mice and rats without any help of contrast agents, only through the structural shift of the oxygen concentration (5, 6). The same researchers were able to apply this method to human studies (7) and thus the technical principle of functional MRI was discovered.
Figure 1: Nucleus spin without and with external magnetic field.
(a): Without the external magnetic field the not aligned magnetic dipoles of the separated nucleus spin neutralize each other. (b): Under the effect of the external magnetic field Bo the magnetic dipoles align in parallel or in antiparallel. The parallel alignment is lower energetic and so it is the more frequent alignment and the net magnetism is M.
A high-frequence-impulse (hf-impulse) has to be irradiating in addition to the constant magnetic field. Thus the atomic nuclei can rise to a higher energetic level and tip the additional vector downward from z-axis to xy-axis (= transverse magnetisation).
Normally the hf-impulse is produced by a transmitter coil (for example a head coil or body coil) and with it the synchronisation of the precession movement is achieved and the magnetic vector straightens to xy-axis.
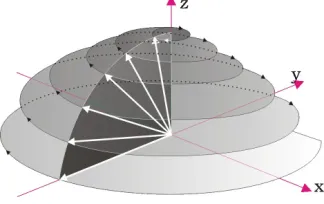
Figure 2: Alignment of the magnetic vector M with an hf-impulse. The magnetism rotates with the lamor frequence ώo around the z-axis Bo.
After the disconnection of hf-impulse the hydrogen atomic nuclei return to their original position and give back their acquired energy. The changes in magnetisation generally only last a few seconds. The return of the magnetic vector into its original position (= relaxation) is described by the relaxation time T1, T2 and T2*.
The T1 relaxation time means the half-life which is needed to return from transverse to longitudinal magnetisation.
This procedure is caused by the exponential energetic delivery of the atomic nuclei to their surroundings. The T1 relaxation time is dependent on the external magnetic field Bo and on the energetic coupling of the atomic nuclei to the general system. If the movements of the protons and neutrons in the tissue correspond to the movements of the atomic nuclei and if they are near the lamor sequence ώo, the energetic transfer is maximal. Hence it follows that different tissues have different T1 relaxation times.
The T2 relaxation time (or spin-spin relaxation time) states the half-life which is needed by the part vector Mxy after an hf-impulse for losing its energy. The loss of phase coherence of the spins is the source of this.
After the hf-impulse is turned off, the atomic nuclei dephase, because of the fluctuation of the magnetic inhomogenities in their close surroundings, but independently of the external magnetic field. By contrast to the T1 relaxation time no energy transfer is needed.
The third mechanism of relaxation, the T2* relaxation time, is caused by external field inhomogenities. These interactions produce another factor that triggers a dephasation. The inhomogenities are caused by different magnetic attributes of non-ferromagnetic substances i.e. the susceptibility. The susceptibility describes the dimension in which a substance is magnetized if an external magnetic field is produced. The source of this phenomenon is the reciprocal action between the external magnetic field Bo and the magnetic moment of the electron covering.
In diamagnetic substances, as water or other organic molecules, the induced magnetisation points to direct opposition to the external magnetic field.
In paramagnetic substances, like deoxyhemoglobin, or metallchelates, as Gadolinium-DTPA a magnetisation is built in the same direction as the external magnetic field. Because of this support of the local magnetisation it results in a signal loss, which is characterised by the time constant T2*. This effect increases in proportion to the field straightness of the system.
By applying a spin-echo pulse frequency we can get rid of the nuisance signal, which can be caused by the equipment (an imperfect external field). After the excitation pulse another echo-generating pulse is applied at a defined point or time. This reverses the dephasing and that part of it which is caused by external field inhomogenities is eliminated (8, 9, 19). For deeper comprehension detailed literature of magnetic resonance (11, 12, 13) and magnetic resonance imaging should be consulted (14, 15).
1.3
Functional MRI
Functional Magnetic Resonance Imaging (fMRI) is a special method within the field of Nuclear Magnetic Resonance Imaging. With fMRI it is possible to measure neuronal reactions to external stimuli, especially in the neocortex. The fMRI is based on local blood flow changes and blood oxygenation changes in response to neural activity. Functional magnetic resonance imaging can detect these hemodynamic changes.
Whenever neurons process information their metabolic requirements increase. Energy is provided through glucose and oxygen, i.e. the oxygen is bound to hemoglobin molecules. The differential magnetic properties of deoxygenated and oxygenated hemoglobin can be used to measure images by blood-oxygenation-level dependent (BOLD) contrast. This contrast is a consequence of a series of indirect effects. It results from changes in the magnetic properties of water molecules, which in turn reflect the influence of paramagnetic deoxyhemoglobin. The deoxyhemoglobin is the physiological correlate of oxygen consumption, which in its turn is a correlate of a change in neural activity evoked by cognitive processes.
blood. Thus neural activity can be measured indirectly with the help by means of T2*changes. In summary, the BOLD response provides unprecedented visibility of the neural activity in the human brain. The BOLD signal has been shown to be correlated to the presynaptic activity and to the local neuronal activity.
Figure 3: The principle of BOLD contrast:
The changes in hemodynamics cause a rise in MR signals. The cerebral blood flow (CBF) and the cerebral blood volume (CBV) rise under neuronal activity. The oxygen content drops because of the higher use-up of oxygen and so the deoxyhemoglobin content of venous blood drops, too (modified according to LeBihan 1996) (16).
A fMRI experiment needs a series of anatomical scans, which at a later point of time will be used to relate the functional findings to known anatomical landmarks in the brain. The anatomical scans provide the information for a better localization of the place of the activation due to cognitive tasks.
There are two major design formats for fMRI experiments. The design of the task may be block design, where a “steady state” of neuronal and hemodynamic change is set up, or event-related design, where the hemodynamic response to each stimulus is measured. The design has to include other tasks or a period of rest, as activation results are based on the comparison between two cognitive states. The advantage of block-designed tasks is that they are less susceptible to disturbances than event-related design, but not every stimulus can be assigned exactly to its hemodynamic response.
The signal modulation in fMRI typically is 0.5-1.5%. In the magnetic field it is very important to minimise head motion to be able to detect the actual signal. The fMRI technique is particularly effective at 3.0 Tesla (T), owing to its sensitivity, resolution and high signal, reduced scanning times and overall improved diagnostic ability. 3.0 Tesla allows an exploration in greater detail of more complex phenomena, which are not clearly depicted on 1.5 Tesla systems (17).
The radio-frequency magnetic field oscillations do generate internal body heat. However, there are guidelines that secure a safe environment for the subject (18, 19, 20, 21, 22, 23).
1.4
Perception of Brand-related Information - the Mechanism of Brain
Branding
Brain branding is a new, interdisciplinary approach to improve the understanding of the question: How does the mind perceive and process brands? Using modern imaging methods, for example functional magnetic resonance imaging, researchers are now able to go beyond marketing surveys and gather information on how the brain responds to a particular brand at the most basic level. Brand is essentially the sum of all experience related to the product, service and companies that make and deliver the product. Brand perception is shaped by functional experience (i.e. speed, quality, reliability, ease of use) as well as the emotional experience that the customer associates with the product and the company.
for the measurement of brain activity in connection with the brand perception. It is the interest of the marketing strategists to revolutionize brand science and brand management with the assistance of brain science.
“…with the use of neurobiological science in the economy we stand in front of a new way of looking at brands and their effects to the thinking and behaviour of the costumer…” (Vernon L. Smith, Nobel Prize winner for economy 2002) (24).
Neuroeconomic methods offer the hope of separating and characterizing distinct components of the purchase decision process in individual consumers. One of these new methods is named brain branding, which means the interaction of brand management and brand science. It is the head objective of this approach to make the effort of brain science usable for brand management. Especially the combination of both competences offers an enormous potential for the marketing, because brain science may open a new perspective on the consumer.
The method of brain branding is built on three columns:
Market analysis, which means identification of the potential of a brand, followed by the positioning of the functional imaging and at last the optimizing of the embedding of the brand. Here the functional magnetic resonance imaging combines experimental procedures like the measuring of reaction time and classical examination with qualitative and quantitative procedures. This combination guarantees quality and is a precondition for the correct interpretation of the results. Using the new knowledge of brain branding, the marketing strategists aim at rendering a customer a purposeful consumer and getting the brands anchored in the brain of the customer. Besides, it is a point of interest for them to optimize the reflection of brands, enterprises and products (25).
1.5
Differences between Age and Gender in Brand Perception
Familiar brand images are processed in brain areas associated with positive emotions, while unfamiliar brands require more effort in brain processing and activate areas of the brain associated with negative emotions. Thus it can be concluded that both strong and weak brands may be perceived as familiar or unfamiliar and cause the corresponding activation patterns. Additionally, activation was measured in areas which are related to potentially negative outcomes (26).
For marketing it is important to examine and classify the different brands. So the question matters why one brand is more successful than another one. In this connection it is not only important to determine which brand performed better or worse in the mind of the consumer, but to consider, which collective was examined. Today there exist many functional resonance imaging studies about brain perception and brain activation in general. But one point which seems to have been neglected until today is the difference of cortical activation among the different age classes and among the different genders.
That women and men should react variably to different products may seem probable, but hasn‘t been established yet. It would be very informative to see if different brain areas are activated. Another interesting point would be to examine the different age classes, because it seems to be probable that life time experience plays an important role in product perception and it would be enlightening if there could be detected different cortical activation areas correspondingly.
It was the aim of the study to detect cortical activation patterns caused by well established brands. For the experimental setting three well known German brands (news magazines) were chosen, which have been well established for years and show a similar layout and similar contents (political information as well as society themes).
In this connection the primary objective was to show that there exists a significant difference in cortical perception and semantic processing between them. It was a matter of particular interest to examine if there can be observed any difference in their cortical activation and if it is possible to show the same grading in different activation patterns between supposedly well established brands that are already shown in comparison between familiar and unfamiliar brands.
Another important aim was to prove that there exists a change in brand perception between the age classes. Therefore, the subjects were split up into three age classes with similar allocation. One assumption was that the region of cortical activation may change in the course of life or/and that the intensity of possible activation may increase or decrease.
After the examination of the different age classes it is consequent to observe the difference of brand perception among the genders. Accordingly, here as well the participants were split up into gender groups with identical numbers of participants. Matter of particular interest was the question if there can be shown any different cortical activation patterns during the experiment and if so, what the difference is about.
3.1
Subjects
Thirty-one physically and psychologically healthy participants were included in the study. The recruiting of the subjects took place with an announcement inside the University Hospital of Großhadern. The examined brands were three well known German news magazines (Brand1: „Focus”, Hubert Burda Media, since 1993, QII 2009: circulation of 656.776 copies; Brand2: „Der Spiegel”, SPIEGEL-Verlag Rudolf Augstein since 1947, QII 2009: circulation of 1.029.558 copies; Brand3: „Stern”, Gruner + Jahr, since 1948, QII 2009: circulation of 949.546 copies).Precondition was that the probationers knew and read the news magazine occasionally (see chapter 3.3). The participants were subdivided in three age classes and two gender classes. The precondition was that every age class or gender class had nearly the same number of participants (Table 1).
Age Class Gender
female male n=
young 6 5 11
middle-aged 5 5 10
elderly 5 5 10
n= 16 15 31
Table 1: Resorting of participants.
Every age class or gender class with its number of participants, n = number.
3.2
Methods
3.2.1 Functional (fMRI) Data Acquisition and Data Analysis
3.2.1.1 Data Acquisition
Functional imaging was performed using a state-of-the-art, clinically approved MRI systems with a multi-channel capability and coil concept operating with following specifications: The 3.0 T whole body magnetom (Magnetom, Siemens Erlangen, Germany) with its maximum gradient strength of 45mT/m, its maximum slew rate of 200T/m/s and its 12 element head coil. The head coil was equipped with a detachable double mirror system.
For the functional imaging, an echoplanar gradient-echo sequence was used with the following imaging parameters: repetition time (TR) 3000ms, echo time (TE) 30ms, flip angle (FA) 90deg, spatial resolution 3x3x3mm, matrix 64, Field of View (FoV) 192mm, number of slices 36. Exactly the same sequence parameters were used for the phantom measurements.
The functional images were acquired in axial orientation, parallel to the ACPC (anterior commissur – posterior commissur) line, covering a subject’s brain from the cerebellum to the vertex. For anatomical reference, a sagittal high resolution 3D inversion recovery gradient-echo sequence (MPRAGE) was performed (FoV, 250mm, spatial resolution, 0.8x0.8x0.8mm, TR, 14ms, TE, 7.61ms, FA, 20deg, number of slices 160).
3.2.1.2 Data Analysis
3.2.1.2.1 Data Post-processing
All data were archived by the institutional PACS (picture archiving and communicating system) and subsequently transferred to a stand-alone evaluation platform (Windows2000, Microsoft, USA) for further evaluation.
All the image post-processing and statistical analysis was done by BrainVoyagerQX®, Ver. 1.7 (BrainInnovations BV, Maastricht, Netherlands). Before further processing, the first 4 functional volumes of each run were discarded to avoid T1 saturation effects. The functional data pre-processing was done in a standardised fashion provided by BrainVoyager® using the following procedures: Slice scan time correction, motion correction and the spatial smoothing following the talairach transformation were performed using a 4 mm (full width at half maximum) isotropic Gaussian filter. For anatomical reference, the high resolution T1-weighted sequence was used. Functional data were co-registered simultaneously with the anatomical sequence in an automated process using spatial position files produced by the scanner for each scan. Afterwards the results of the alignment process was visually evaluated and corrected whenever necessary for optimal alignment. The anatomical sequence was transferred to talairach reference space. Using the parameters of this transformation, functional data were also transferred to the reference space.
Results and success of motion correction and talairach transformation (e.g. misalignment, distortion) were reviewed by two radiologists with neuroradiological training (a fellow of radiology and an attending radiologist, section MRI) in agreement.
3.2.1.2.2 Statistical Analysis
For each contrast, identification of activation clusters was made by two radiologists in agreement. Anatomical regions were identified in correspondence with the Talairach and Tournoux atlas (27) and using the nomenclature of Brodmann (1909).
3.2.2 Stimuli and Experimental Design
At the beginning of the fMRI experiment, each included participant was explained its nature and rules. All participants filled in a questionnaire, which was standardised and included the evaluation of brand knowledge and strength and the individual involvement of the participants with them was measured by ten questions with subordinate points. While lying in the scanner, the participants watched a 1.5 x 1.5 meter screen through a mirror that was attached to the head coil. The stimuli were projected to this screen by a video projector. Stimuli in this study were the covers of three well-known German news magazines (Brand1, Brand2 and Brand3). Under each picture there was set a short question (i.e. “Offers more than another”, “Provides topics”, “Is pleasant”, “I like it”, “Differs from others”) to evaluate the perception of the brand according to a four-point scale ranking from “I agree strongly” to “not agree” (Figure 4, Figure 5). The test person had the possibility to press four different buttons to evaluate the pictures shortly after he/she had seen them and was instructed to press the button immediately after his/her first impression of the picture and question.
“Provides topics” “I like it” “Offers more”
Figure 4: Covers of the three brands.
All the components of the experimental design had to be MR-compatible. The stimulus unit and the workstation necessary for performing the scans were located outside the MR room. The participant held response buttons in his/her hands.
Figure 5: Experimental fMRI setup with the Magnetom TRIO, Siemens in Großhadern.
a) 1.5x1.5 meter screen and video projector, b) 12-channel headcoil with an attached mirror, response buttons, c) computer set-up.
The subjects of the experiment were instructed to press four different buttons with two fingers of the right and left hand whenever they had seen a picture. One picture was projected for three seconds before it changed to the next. Prior to the scanning it was emphasised that the individual should be concentrated and answer the accompanying question quickly and spontaneously. As a control condition, a coloured abstract image was displayed for 24 seconds after every eighth picture (Figure 6).
Figure 6: The relaxation picture for the baseline control condition was shown for 24 seconds after every eighth picture.
b)
During the fMRI session, none of the subjects reported any difficulties in performing the task. Two different fields of the behavioural response data were examined: Which button was pressed by the participant during the experiment and what time he needed for this decision. So the assessment as well as the reaction time of the participants had to be analysed. A precondition for the measurement was that the participant wasn’t allowed to move his head during the scans. To make it easier for him the participant’s head was fixed up with vacuum cushions in the head coil.
Figure 7: Stimuli paradigm.
Four active blocks consisting of eight stimuli every three seconds.
The fMRI was block-designed with 4 active blocks consisting of 8 stimuli every three seconds for each news magazine’s title page, which meant that a “steady state” of neuronal and hemodynamic change was set up (Figure 7). For anatomical reference 3D-T1w images were obtained. The whole analysis took approximately 40 minutes. Shortly after the scanning the participants were tested again by means of a further questionnaire to evaluate the effect of the pictures and the imagination of the different products.
3.3
Questionnaires
All subjects filled in a questionnaire developed by professionals in marketing (BBDO Consulting and Burda-Media Germany), which was standardised and included the evaluation of brand knowledge and strength and the individual involvement of the participants. First the personal data of the participants were documented: age, gender and handedness for the statistical analysis. After that some questions about their reading behaviour were asked. The inclusion criteria were that a participant should know the individual news magazines and read
Image x10
1 0 Pa ra di gm Rest 7 0 0 0 2 0 3
0 40
5 0
6 0
Rest Rest Rest
Active Active
them. Next the participants were classified into three age classes [young: <35y (middle age 28y); middle: 35-49y (middle age 41y); elderly: >50y (middle age 60y)] and gender classes (female: 16; male: 15).
The questionnaire was divided into two parts: the first part was answered before the fMRT examination; the second part was answered immediately after the scans to record the examination result.
In the first part of the questionnaire the participant had to answer 4 main questions. The first question was about the participant himself: gender, age, handedness and visual aid. The second referred to his general brand knowledge of six different German newspapers (brand 1, 2 and 3 were included). The participants were asked, how often they read these. Then the brand image and the brand attractiveness were questioned.
I. Before the experiment
S0 Gender: Man Woman
S1 Age class: < 35y 35y < 50y 50y <
S2 Handedness: left right
S4 Seeing aid: yes no
S5a Brand knowlegde: read/leafed only known not known Brand1
Brand2 Brand3
S5b Reading condition: every edition 2./3. edition seldom never Brand1
Brand2 Brand3
S5b Imagination: very clear clear less clear not very clear unclear Brand1
Brand2 Brand3
S8b Attractiveness:
very
attractive attractive less attractive
not very
attractive unattractive Brand1
Brand2 Brand3
II. After the experiment
3a Contents Brand1:
agree
strongly agree
agree moderately
rather not
agree not agree
..is truthworthy ..is comprehensible ..gives topics ..is objective ..is clear
3b Contents Brand2:
agree
strongly agree
agree moderately
rather not
agree not agree
..is truthworthy ..is comprehensible ..gives topics ..is objective ..is clear
3c Contents Brand3:
agree
strongly agree
agree moderately
rather not
agree not agree
..is truthworthy ..is comprehensible ..gives topics ..is objective ..is clear
Table 2: Summary of the questionnaire.
The questions number 3 a-b are only a short version of the nineteen original questions of the questionnaire.
4.1
Behavioural Response Data
During the fMRI session, none of the subjects reported any difficulties in performing the task.
4.1.1 Brand1 vs. Brand2 vs. Brand3
Reaction time:
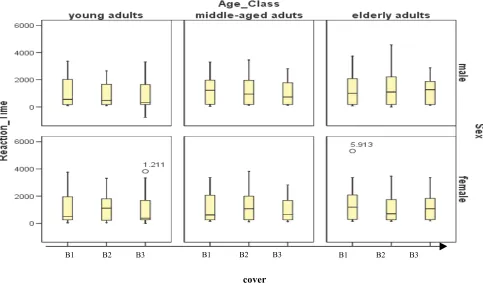
The reaction time of the participants was analysed first to control the usability of the response data. The response time (RT) is the length of the time interval between the moment when the stimulus (the different title pages with questions) appears on the screen and the moment when the subject presses the button making his choice. The reaction time of the participants for the three news magazines kept within the limits and there were no significant differences between them (ANOVA-test between the gender classes: p=0.641 and between the three title pages: p=0.114). Only the reaction time for Brand3 had a wider frequency range (Figure 8).
Figure 8: The boxplot graph of the reaction time.
Reaction times of the participants for news magazines kept within the limits, no significant difference between them. The boxplot is a graph which is used to show number lines.
cover
Figure 9: Reaction time of the different age and gender classes.
No significant differences between the different age and gender classes (B1=Brand1, B2=Brand2, B3=Brand3).
The reaction time was approximately 900ms on the average. The medians, 25th and 75th percentile, showed no difference. The statistical anomaly (marked with a circle in the graph) represents participants who reacted very late on different occasions (Figure 9).
Response data:
The evaluation of Brand1 showed a similar result. 49.3% (235/425) of the participants pressed the buttons for “agree strongly” and “agree”, 44.9% (191/425) for “agree moderately” and “not agree”. The participants evaluated Brand2 at 65.1% (276/424) with “positive” answers (“agree strongly” and “agree”) whereas merely 34.9% (148/424) opted for the “negative” answers (“agree moderately” and “not agree”) and just 6.4% (27/424) for “not agree” at all. Brand3 showed a result with 53.5% (202/377) for the “negative” answer possibilities and only 46.7% (175/377) for the “positive” answers.
cover
Figure 10: Response number of the different brands. Evaluation of the three news magazines of all participants
The three news magazines showed significant difference in ranking (Figure 10, Table 3).
Chi2 p-value
B1 pos > B2 pos 0.00351
B1 pos > B3 pos 0.00001
B3 pos > B2 pos 0
B1 neg > B2 neg 0.0004
B1 neg > B3 neg 0.4
B3 neg > B1 neg 0.00001
Table 3: Response data of the three brands in summary.
Strongly agree and agree = positive evaluation; moderately agree and not agree = negative evaluation. B1=Brand1, B2=Brand2, B3=Brand3.
In summary, there was a general ranking: Brand2 first, Brand1 second and Brand3 third.
4.1.2 Age Class
As mentioned before, the participants were subdivided into three age classes [young: <35y (middle age 28y); middle: 35-49y (middle age 41y); elderly: >50y (middle age 60y)] and checked for the difference.
Response Number
Age classes Brand1:
The young adults assessed Brand1 at 31.4% (48/153) with “agree” and at 42.5% (65/153) with “agree moderately”. With “agree” judged 36.2% (43/124) of the middle-aged adults and 30.8% (38/124) with “agree moderately”. The elderly adults evaluated Brand1 at 42.4% (63/149) with “agree” and at 25.3% (37/149) with “agree moderately” and so Brand1 got its best score of the three age classes in this gender group (Figure 11).
Figure 11: Response number cover Brand1.
Evaluation of the cover Brand1 among all age classes.
Table 4 shows the significance between the evaluation of the young and evaluation of the elderly participants.
Chi2 p-value
young>middle agree 0.1
young>elderly 0.005
elderly>middle 0.3
young>middle not agree 0.06
young>elderly 0.00001
elderly>middle 0.02
Table 4: Evaluation of Brand1 among the different age classes. Response_
Number
On the whole, the assessment of Brand1 was ambiguous within each age class. The younger adults didn’t prefer Brand1, the middle-aged judged Brand1 inconspicuous and the elderly voted positively.
Age classes Brand2:
Brand2 was evaluated best within the three age classes: 32.6% (47/144) chose “strongly agree” and 29.2% (42/144) “agree”, 6.2% (9/144) voted “not agree”. Brand2 was placed fist by the young adults. The middle-aged adults evaluated Brand2 with 41.6% (52/125) opting for “agree” and 24.0% (30/125) for “strongly agree”. “Not agree” was chosen by 4.8% (6/125). This means the best result for Brand2 among the three news magazines. The elderly adults voted at 48.4% (75/155) with “agree” and at 19.4% with “strongly agree” (30/155). The elderly participants responded most strongly to Brand2, too (Figure 12).
Figure 12: Response number cover Brand2.
Evaluation of the cover of Brand2 among all age classes.
As presumed; there was no significant difference in the evaluation of the age classes in the Qui²-test, because all three age classes ranked the news magazine Brand2 first. All in all, of the three news magazines Brand2 was the preferred one.
Response_ Number
Age classes Brand3:
The young adults assessed Brand3 at 45.1% (60/132) with “moderately agree” and at 15.9% (21/132) with “not agree”. So from 132 examined reactions, there were 82 negative ones for Brand3. The middle-aged adults voted at 39.8% (60/103) with “agree moderately” but on the other hand at 34.0% (40/103) with “agree”. The elderly adults evaluated at 34.6% (35/142) with “agree” and 38.5% (41/142) with “agree moderately”. In comparison with the other age classes they voted more positively in tendency (Figure 13).
Figure 13: Response number cover Brand3.
Evaluation of the cover of Brand3 among all age classes.
Table 5 shows the significance between the negative evaluation of the young and the more positive evaluation of the elderly participants.
Chi2 p-value
young>middle Agree 0.3
young>elderly 0.005
elderly>middle 0.1
young>middle not agree 0.08
young>elderly 0.04
elderly>middle 0.9
Table 5: Evaluation of Brand3 among the different age classes. Response_
Number
On the whole, Brand3 got a less positive assessment. Its shared the last place in ranking with Brand1 among the young and elderly adults and had its worst result among the middle-aged adults in comparison with the other news magazines.
Summary of the age class results Brand1, Brand2 and Brand3:
Brand2 was best assessed among the three age classes. The ranking among all age classes was the same: Brand2 on top, Brand1 next and Brand3 last. The young and elderly participants saw Brand1 and Brand3 ranking pari passu, but on different levels. The young adults evaluated both magazines more negatively in contrast to the elderly adults who, on the whole, voted for both in a positive way. The middle-aged participants ranked Brand3 last.
4.1.3 Gender
The subjects were subdivided equally into gender classes and the difference between them considering the different news magazines was analysed. The thirty-one participants consisted of sixteen women and fifteen men.
Gender Brand1:
Figure 14: Response code Brand1, male
Figure 15: Response code Brand1, female.
Table 6 shows the significance between the mediocre assessment of the male and the quite good assessment of the female participants regarding Brand1.
Chi2 p-value
male>female agree 0.003
male>female not agree 0.0003
Table 6: Evaluation of the different gender classes of Brand1. Percent
Brand1 male
Brand1 female
Brand1 took a more mediocre position with the male and quite a good position with the female subjects. Only this time Brand1 was generally ranked first.
Gender Brand2:
The male participants estimated Brand2 at 31.9% (69/216) with “strongly agree” and at 41.2% (89/216) with “agree”. So Brand2 got its best score from the male participants compared to Brand1 and Brand3 (Figure 16). 38.5% (80/208) of the female participants rated it with “agree” and 34.6% (72/208) with “agree moderately” (Figure 17). The women thought of Brand2 fairly positively but not as positively as the men.
Figure 16: Response code Brand2, male.
Figure 17: Response code Brand2, female. Percent
Brand2 male
Percent
Table 7 shows the significant differences between the male and female assessments as far as Brand2 is concerned.
Chi2 p-value
male>female agree 0.0007
male>female not agree 0.00002
Table 7: Male and female assessments, Brand2.
The male participants put Brand2 on top of the ranking of the news magazines. The female participants saw Brand2 second. This was the only time that Brand2 was not generally ranked first.
Gender Brand3:
The male participants evaluated Brand3 at 45.0% (86/190) with “moderately agree” and at 35.0% (67/190) with “agree” (Figure 18). The female participants assessed at 33.5% (63/187) with “agree” and 34.3% (64/187) of them with “moderately agree” (Figure 19).
Figure 18: Response code Brand3, male. Percent
Figure 19: Response code Brand3, female.
There was no significant difference between the gender classes in the Qui²-test of Brand3. In comparison with the other news magazines Brand3 got its worst score from the women. The judgment of the male participants regarding Brand3 was similar to Brand1. The strength of both news magazines was regarded as modest.
Summary of the gender results brands 1, 2 and 3:
The male participants judged Brand2 first, followed by Brand1 and Brand3. The female participants gave Brand1 the best mark, Brand2 the second best and ranked Brand3 third.
4.2
Brain Activation during the Perception of Stimuli
In the following chapter the focus is on the results of brain activation during the perception of stimuli. First of all an explanation of a few parameters of the analysis of the brain activation has to be given. The functional base data were analysed with the false discovery rate (FDR) which is a representative number for a population. The comparison with the baseline is shown by a FDR of q: 0.001 and the comparison between the different groups with a FDR of q: 0.01. So the results are highly significant. For each ROI there was determined a t-value with a minimum and a maximum value. The scans of one participant (elderly adult, male) had to be excluded because of movement artefacts.
Percent
4.2.1 Brand1 vs. Brand2 vs. Brand3
The hypothesis was that established brands within one product category generate differences in the cortical activation caused by them. The news magazines were compared to each other and importance was attached to the difference in activation as a function of gender and age class. The three news magazines were considered to be well-known in Germany. For the study the print media were examined and compared to each other. First the general difference was measured without any discrimination of gender and age classes.
Cortical activations Brand1:
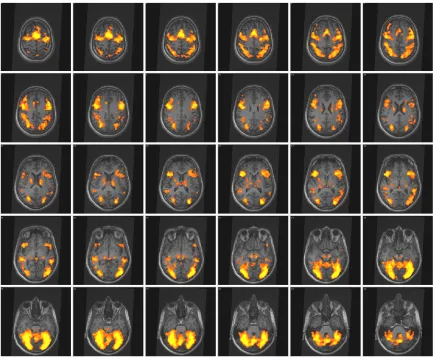
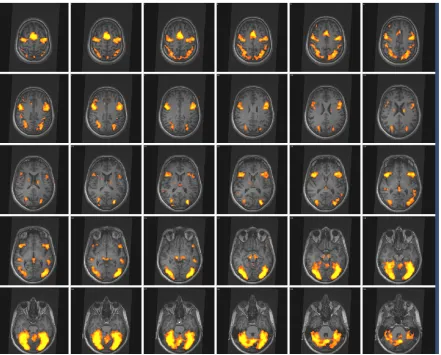
Altogether there was rather more activation on the right hemisphere than on the left. Especially the middle temporal gyrus (GTm) showed a high activation on the right hemisphere and a smaller one on the left hemisphere. The anterior insula was activated more on the right than on the left hemisphere, too. The parietal cortex was activated more on the right hemisphere than on the left, the putamen only on the left hemisphere.
Figure 20: Cortical activation Brand1, all participants.
Displayed in axial view, radiological convention. Comparison with the baseline shown by a FDR of q: 0.001.
Anatomical region Right Left
BA No.voxel t-value No.voxel t-value Superior frontal gyrus (pars medialis) 6 n/a n/a 7672 6.83
Inferior parietal lobule 40 5822 5.36 5508 5.23
Inferior frontal gyrus 44 9095 5.47 5568 5.7
Anterior Insula 45 8511 5.37 7598 5.03
Middle temporal gyrus 21 3871 4.91 3595 5.04
Table 8: Different regions of cortical activation and the number of voxels, Brand1.
n/a means not applicable, No.Voxel = number of voxels, BA= Brodmann area, FDR = q: 0.001.
Cortical activations Brand2:
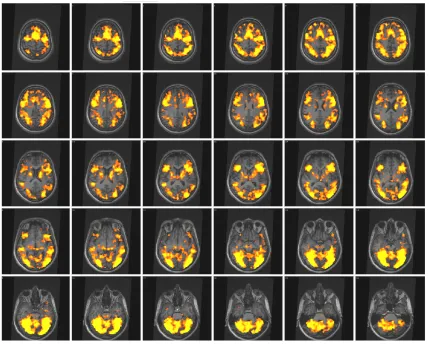
middle temporal gyrus (GTm). The caudate nucleus (NC) and the parietal cortex were activated more on the left hemisphere than on the right one.
The data of Brand2 were compared with the observations of Brand1 and Brand3. Brand2 versus Brand1 showed no activation, neither showed Brand2 versus Brand3. As the analysis of Brand1 had been examined before, no relevant activation could be seen in the separate brain areas even on a higher level of significance (Figure 21, Table 9).
Figure 21: Cortical activation Brand2, all participants.
Displayed in axial view, radiological convention. Comparison with the baseline shown by a FDR of q: 0.001.
Anatomical region Right Left
BA No.voxel t-value No.voxel t-value
Precentral gyrus 6 5042 5.58 5544 5.53
Anterior Insula 45 3907 5.53 4408 5.29
Middle temporal gyrus 21 727 4.75 803 4.78
Caudate nucleus n/a n/a n/a 703 4.78
Inferior parietal lobule 7 n/a n/a 4684 5.16
Table 9: Different regions of cortical activation and the number of voxels, Brand2.
Cortical activations Brand3:
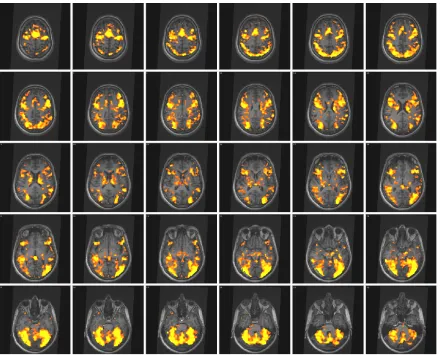
The activations were predominantly right-sided. Similar to the results for Brand1 the anterior insula showed more activation on the right than the left hemisphere as well as on the middle temporal gyrus (GTm). In general, Brand3 evoked the highest activation level in comparison with Brand2 and Brand1 (Figure 22, Table 10).
Figure 22: Cortical activation Brand3, all participants.
Displayed in axial view, radiological convention. Comparison with the baseline shown by a FDR of q: 0.001.
Anatomical region Right Left
BA No.voxel t-value No.voxel t-value
Inferior frontal gyrus 44 6658 6.35 7566 6.36
Inferior parietal lobule 40 6255 6.04 6255 6.04
Anterior Insula 45 7264 6.30 6451 5.97
Middle temporal gyrus 21 6246 5.29 5328 5.32
Table 10: Different regions of activation and the number of voxels, Brand3.
Contrasts:
The differences of Brand3 versus Brand2 and Brand3 versus Brand1 were also measured. Brand3 versus Brand2 showed activation in the cingulate gyrus region predominantly on the right side. The superior temporal gyrus (GTS, BA21) was activated on the right hemisphere. A clear activation in the superior frontal gyrus (GFs) could be observed rather more on the left than on the right hemisphere with a more frontal located activation on the left side. The comparison of Brand3 versus Brand1 showed no activation on a higher level of significance (Figure 23, Table 11).
Cingulate gyrus Superior temporal gyrus
Figure 23: Cortical activation Brand3 vs Brand2, all participants.
Displayed in axial view, radiological convention. Comparison between the different groups is shown by a FDR of q: 0.01.
Anatomical region Right Left
BA No.voxel t-value No.voxel t-value
Superior frontal gyrus 8 n/a n/a 524 4.2
Cingulate gyrus 32 1744 4.58 1037 4.28
Superior temporal gyrus 21 1049 4.40 n/a n/a
Table 11: Comparison of different cortical activations Brand3 vs Brand2 and the number of voxels. n/a means not applicable, No.Voxel = number of voxels, BA= Brodmann area, FDR = q: 0.01.
4.2.2 Age Class
The different patterns of brain activation between age class and gender are of high interest with respect to marketing and must be taken into special account for the interpretation of the results. As described above, the participants were subdivided into three age classes [young: <35y (average age 28y); middle: 35-49y (average age 41y); elderly: >50y (average age 60y)] and the difference between them was ascertained. One elderly man had to be excluded because of movement artefacts and so the data from 11 young, 10 middle-aged and 9 elderly participants were analysed. The results of our measurements were highly significant because of a FDR of 0.001 was chosen for the analysis of the functional data.
Age class Brand1:
Young subjects:
Figure 24: Cortical activations Brand1, young participants.
Displayed in axial view, radiological convention. Comparison with the baseline shown by a FDR of q: 0.001.
Anatomical region Right Left
BA No.voxel t-value No.voxel t-value
Precuneus 19 845 4.68 175 4.41
Cingulate gyrus 32 1109 5.10 1399 5.00
Middle temporal gyrus 39 n/a n/a 1319 4.79
Anterior Insula n/a 1530 4.93 2289 5.22
Middle temporal gyrus 21 523 4.65 1783 4.95
Table 12: Different regions of cortical activation and number of voxels, Brand1 young vs baseline. n/a means not applicable, No.Voxel = number of voxels, BA= Brodmann area, FDR = q: 0.001.
Middle-aged subjects:
(Figure 25, Table 13). The comparison of middle-aged participants with young and elderly was also measured. The middle-aged versus the young displayed minimal activation on the right hemisphere only, but it was too little and not significant. The middle versus the elderly population showed no significant activation at all.
Figure 25: Cortical activation Brand1, middle-aged participants.
Displayed in axial view, radiological convention. Comparison with the baseline shown by a FDR of q: 0.001.
Anatomical region Right Left
BA No.voxel t-value No.voxel t-value
Precuneus 7 711 5.18 1294 4.70
Inferior frontal gyrus 45 912 4.82 1858 5.28
Caudate nucleus n/a n/a n/a 1006 4.76
Putamen n/a 969 4.74 1194 4.81
Middle temporal gyrus 21 417 4.69 1173 4.83
Anterior Insula n/a 2580 5.03 4340 5.60
Elderly subjects:
The elderly participants showed significant activation in a few regions. The middle temporal gyrus was activated only on the right hemisphere while the anterior insula was activated predominantly on the right hemisphere. The cingulate gyrus and the putamen were activated more on the left one. The precuneus was activated bilaterally (Figure 26, Table 14).
In addition, the elderly, young and middle-aged subjects were also measured and the characteristic brain activation patterns were compared. No significant activation could be observed in comparison of the elderly with the young participants. A similar result was obtained when the elderly were compared with the middle-aged subjects.
Figure 26: Cortical activation Brand1, elderly participants.
Anatomical region Right Left
BA No.voxel t-value No.voxel t-value
Cingulate gyrus 32 795 5.83 1958 6.78
Precuneus 7 817 5.59 718 6.14
Anterior Insula n/a 2371 5.13 1966 5.04
Middle temporal gyrus 21 2122 4.89 n/a n/a
Putamen n/a 201 4.33 324 4.66
Table 14: Different regions of cortical activation and number of voxels, Brand1 elderly vs baseline. n/a means not applicable, No.Voxel = number of voxels, BA= Brodmann area, FDR = q: 0.001.
Age class Brand2:
Young subjects:
Figure 27: Cortical activation Brand2, young participants.
Displayed in axial view, radiological convention. Comparison with the baseline shown by a FDR of q: 0.001.
Anatomical region Right Left
BA No.voxel t-value No.voxel t-value Superior frontal gyrus (pars medialis) 6 1532 5.77 3259 6.24
Precuneus 7 1869 5.40 2908 5.29
Putamen n/a n/a n/a 1491 4.70
Anterior Insula n/a 3239 5.58 4344 5.61
Middle temporal gyrus 21 580 4.81 1478 4.73
Table 15: Different regions of cortical activation and number of voxels, Brand2 young vs baseline. n/a means not applicable, No.Voxel = number of voxels, BA= Brodmann area, FDR = q: 0.001.
Middle-aged subjects:
measurement compared activation between the middle-aged and the young participants on the one hand and between the middle-aged and elderly ones on the other the results were as follows: While the middle-aged versus the young participants showed activation in the middle temporal gyrus and activation on the right hemisphere only (Table S40), no relevant activation at all could be detected in the group of the middle-aged versus the elderly, however.
Figure 28: Cortical activation Brand2, middle-aged participants.
Displayed in axial view, radiological convention. Comparison with the baseline shown by a FDR of q: 0.001.
Anatomical region Right Left
BA No.voxel t-value No.voxel t-value
Cingulate gyrus 32 n/a n/a 1885 5.43
Anterior Insula n/a 1950 5.04 327 4.72
Middle temporal gyrus 21 1177 5.05 n/a n/a
Precuneus 7 106 4.56 n/a n/a
Elderly subjects:
The elderly participants displayed activation in the anterior insula predominantly on the right hemisphere and in the cingulate gyrus only on the left hemisphere. The precuneus and middle temporal gyrus (GTm) were activated rather on the right hemisphere (Figure 29, Table 17). Once again the comparison of activation was measured between elderly and young subjects on the one hand and between elderly and middle-aged participants on the other. The elderly versus the young participants showed activation in the precuneus, anterior insula and parietal lobule respectively on the right hemisphere (Table S39). The elderly versus the middle-aged on the whole showed no activation.
Figure 29: Cortical activation Brand2, elderly participants.
Anatomical region Right Left
BA No.voxel t-value No.voxel t-value
Cingulate gyrus 32 377 5.42 1589 6.06
Precuneus 19 2520 5.52 1435 6.26
Middle temporal gyrus 19 2240 5.35 1763 5.28
Anterior Insula n/a 3443 5.12 2484 5.35
Table 17: Different regions of cortical activation and number of voxels, Brand2 elderly vs baseline. n/a means not applicable, No.Voxel = number of voxels, BA= Brodmann area, FDR = q: 0.001.
Age class Brand3:
Young subjects:
The young participants’ activation was significant in the anterior insula, putamen and parietal lobule rather on the left side than on the right. The cingulate gyrus and middle temporal gyrus were activated more on the right hemisphere. Because of the very high activation patterns of the young participants during the Brand3-task a higher p-value had to be chosen, so it should be taken into consideration that the pictures and the determination of voxel were taken with the high p-value, too (Figure 30, Table 18).
Figure 30: Cortical activation Brand3, young participants.
Displayed in axial view, radiological convention. Comparison with the baseline shown by a p-value of p<1.175e-09.
Anatomical region Right Left
BA No.voxel t-value No.voxel t-value
Inferior parietal lobule 40 n/a n/a 1973 8.77
Inferior parietal lobule 40 2474 8.52 2041 9.28
Putamen n/a 1357 7.93 1933 8.68
Anterior Insula n/a 2355 9.17 2354 9.48
Cingulate gyrus 24 2110 9.85 1588 9.35
Middle temporal gyrus 21 1974 8.69 1369 7.05
Table 18: Different regions of cortical activation, Brand3 young vs baseline.
Middle-aged subjects:
The middle-aged participants exhibited activation in the areas of the precuneus (PCu), the caudate nucleus (NC) and the putamen exclusively on the left hemisphere. The anterior insula was activated predominantly on the right, the middle temporal gyrus, however, on both hemispheres (Figure 31, Table 19). The difference in activation between the middle-aged participants on the one hand and the young and elderly ones on the other was that the middle-aged participants versus the young showed no relevant activation, nor did the middle-middle-aged participants versus the elderly.
Figure 31: Cortical activation Brand3, middle aged participants.
Anatomical region Right Left
BA No.voxel t-value No.voxel t-value
Caudate nucleus n/a n/a n/a 137 4.84
Putamen n/a n/a n/a 66 4.93
Precuneus 7 n/a n/a 396 5.17
Middle temporal gyrus 21 171 5.11 88 4.94
Anterior Insula n/a 1161 5.07 411 5.01
Table 19: Different regions of cortical activation and number of voxesl, Brand3 middle vs baseline. n/a means not applicable, No.Voxel = number of voxels, BA= Brodmann area, p-value p<1.175e-09.
Elderly subjects:
Figure 32: Cortical activation Brand3, elderly participants.
Displayed in axial view, radiological convention. Comparison with the baseline shown by a p-value of p<1.175e-09.
Anatomical region Right Left
BA No.voxel t-value No.voxel t-value
Precuneus 7 1338 8.73 1834 9.34
Putamen n/a n/a n/a 400 7.59
Anterior Insula n/a 2225 8.56 1221 8.61
Caudate nucleus n/a 862 8.00 n/a n/a
Cingulate gyrus 24 409 7.58 n/a n/a
Middle temporal gyrus 21 921 8.29 n/a n/a
Middle temporal gyrus 39 1030 8.06 2294 9.89
Table 20: Different regions of cortical activation, Brand3 elderly vs baseline.