Available Online atwww.ijcsmc.com
International Journal of Computer Science and Mobile Computing
A Monthly Journal of Computer Science and Information Technology
ISSN 2320–088X
IJCSMC, Vol. 3, Issue. 10, October 2014, pg.344 – 348
RESEARCH ARTICLE
Image Resolution Enhancement
Based on DWT & SWT
S A Desai
SSBT COET, Bambhori, Jalgaon, India
[email protected]
U S Bhadade
SSBT COET, Bambhori, Jalgaon, India
[email protected]
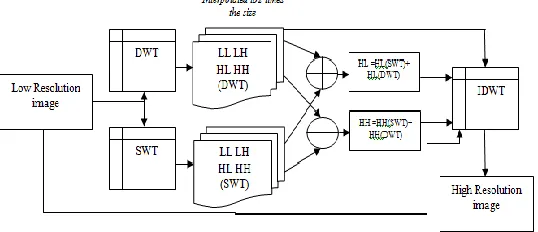
Abstract—In this correspondence, an image resolution enhancement technique based on interpolation of the high frequency subband images obtained by discrete wavelet transform (DWT), stationary wavelet transform (SWT) and the input image has been proposed. The image quality has been enhanced by incorporating stationary wavelet transform (SWT). DWT decomposes an input image into four subbands. Out of these four subbands, two high frequency subbands as well as the input image are interpolated. These estimated high frequency subbands are being modified by making use of two high frequency subband obtained through SWT. Then all these resultant subbands are combined that generates a new high resolution image by using inverse DWT (IDWT). The quantitative results are showing the superiority of the proposed technique over the conventional image resolution enhancement techniques.
Index Terms— Image resolution enhancement, Discrete wavelet transform, stationary wavelet transform
I. INTRODUCTION
advantage of including low complexity of computations, manipulating the frequency composition of the image, ease of viewing and easy applicability of special transformed domain properties. The basic limitations including are that it cannot simultaneously enhance all parts of image very well and it is also difficult to automate the image enhancement procedure. Working of traditional methods of image enhancement is to enhance the appearance of low quality image. [6]It does not contain any high quality background information because in the dark image some areas are so dark that all the information is already lost in those regions. It will not be able to bring back lost information no matter how much illumination enhancement you apply. The DWT eliminates this disadvantage by enhancing low resolution image.
II. IMPLEMENTATION
A) Discrete Wavelet Transform for Image Interpolation
The proposed method preserves much of the sharp edge features in the image and lessens the amount of artifacts. Effectiveness of the proposed algorithm has been demonstrated based on evaluation of PSNR quality metrics with a large database of different types of images. [2]
i) Discrete Wavelet Transform
DWT can be implemented by filtering operations with well-defined filter coefficients. In traditional convolution based approach to compute forward DWT, the input signal (x) is filtered separately by a low-pass filter ( h~ ) and a highpass filter ( g~ ). The two output streams are then sub-sampled by simply dropping the alternate output samples in each stream to produce the low-pass ( yL ) and high-pass ( yH ) subband outputs as shown in Fig. 1. The original signal can be reconstructed by a synthesis filter bank (h, g) starting from yL and yH. The two filters ( h~ , g~ ) constitutes the analysis filter bank.. Given a discrete signal
x(n) , the output signals yL (n) and yH (n) can be computed as
where τ L and τ H are the lengths of the low-pass ( h~ ) and high-pass ( g~ ) filters respectively. For inverse transform, both yL
and yH are first up-sampled by inserting zeros in between two samples and then filtered by low-pass (h) and high-pass (g) filters respectively. Then they are added to obtain the signal (x').
Fig. 1: Analysis and Synthesis filtering in DWT. [2]
For multi-resolution wavelet decomposition, the low-pass subband (yL) is further decomposed in a similar fashion in order to get the second-level of decomposition, and the process is repeated. The inverse process follows similar multi-level synthesis filtering to reconstruct the signal. Image signals are two-dimensional signals. [3]
enlargement. Also in wavelet domain, the low resolution image is obtained by lowpass filtering of the high resolution image i.e. low frequency subband is the low resolution of the original image. Therefore, we are using the input image for the interpolation of low frequency subband image instead of using low frequency subband that contains less information than the original high resolution image. Making use of input image instead of low frequency subband increases the quality of the low resolution image. Fig. 2 illustrates the block diagram of the proposed image resolution enhancement technique. [3]
Fig. 2. Block diagram of the proposed super resolution algorithm.
2.1 Experimental Results for BABOON Image:-
PSNR values are used to measure the quality of an image. Peak signal-to-noise ratio (PSNR) is implemented in order to obtain some quantitative results for comparison. PSNR can be obtained by using the following formula :
PSNR = 10 log 10 (R2/MSE)
where R is the maximum fluctuation in the input image (255 in here as the images are represented by 8 bit, i.e., 8- bit grayscale representation have been used radiometric resolution is 8 bit) and MSE is mean square error.
Results of five techniques are compared using parameter like PSNR keeping wavelets as under SWT - db2, DWT – db1
Table 1. Results for PSNR between Nearest Neighbour, Bilinear method, Bicubic method, Implemented method, Proposed method
Sr. No.
Size of image NN Bilinear Bicubic Implemented Proposed
1 128*128 35.6679 35.3865 36.1638 36.8086 40.124
2 256*256 31.8537 31.6304 32.1409 31.7558 34.2891
3 512*512 31.9203 31.8885 32.2058 32.2378 26.503
2.2 Experimental Results for LENA Image:-
Table 2. Results for PSNR between Nearest Neighbour, Bilinear method, Bicubic method, Implemented method, Proposed method
Sr. No. Size of image
NN Bilinear Bicubic Implemented Proposed
1 128*128 28.8395 28.913 28.7539 30.4485 31.2892
2 256*256 28.8616 28.8004 28.8747 29.5781 24.9699
3 512*512 32.5893 32.2212 32.9569 34.4491 31.0549
2.3 Experimental Results for PEPPERS Image:-
Table 3. Results for PSNR between Nearest Neighbour, Bilinear method, Bicubic method, Implemented method, Proposed method
Sr. No. Size of image NN Bilinear Bicubic Implemented Proposed
1 128*128 25.7825 25.7177 25.9704 28.7706 26.2556
2 256*256 38.4838 38.6659 38.8918 39.4145 24.8861
III. CONCLUSIONS
From the above proposed method and experimental results it can be seen that the low resolution image can be restored with the help of known interpolation techniques such as Nearest Neighbour, Bilinear, Bicubic methods.Further to improve the Results of interpolation this work proposes Image Enhancement method. The proposed method of enhancement i.e. wavelet based image enhancement provides better results than the conventional methods. Each technique is having its advantages and disadvantages.
Since wavelet family consist of large number of wavelets, experiments are performed on the set of important wavelets. From wavelet family, daubechies wavelets are selected. To check the resolution result at every stage different performance parameters are used like peak signal to noise ratio. However, MSE can also be used as one of the evaluation parameters. For good quality resolved image the expected value of RMSE should be as minimum as possible. Value of peak signal to noise ratio should be maximum.
1) When we work on Low resolution images i.e., on 128*128, our proposed system gives better results as compared with
other techniques results. This shows the preservation of Low Resolution Images.
2) As we increase the resolution of image from 128*128 to 256*256, better results are obtained from techniques that uses three sub bands. This must be because, some information related to edges i.e., LH band are not included in two sub band method. This might be considered as disadvantage of our proposed system.
3) On more increasing the dimension of images up to 512*512, results from conventional techniques gives satisfactory improvement in preservation of images.
4) This can be explained as, for high resolution images, we can make use of any of the conventional techniques available.
But for Low resolution images, even if we use only two sub bands, we can preserve our most of the image information.
IV. FUTURE SCOPE
This work selected two sub bands method i.e. HL and HH, there are significant drawbacks of this as compared to the readings of three sub bands method. Two sub bands gives low PSNR values for some of the images, whereas high PSNR for rest of the images. This is because, images with three sub bands have considered LH sub band also. It contains some information related to high frequency components. Since we have only considered two sub bands, some information related to edges might have escaped. To eliminate this, we have directly used our main input image during Interpolation. From this we suppress the limitation of each of our method.
To get more accurate results, we can make use of LL sub band, interpolate it by applying a bicubic enlargement of factor 2. A difference image can be obtained by subtracting Interpolated LL sub band from original Low resolution image. This will leave only the high frequency components that will be used for preservation of edges. This difference image can be utilised further during Interpolation stages.
From above changes, we can expect to get more accurate results.
![Fig. 1: Analysis and Synthesis filtering in DWT. [For multi-resolution wavelet decomposition, the low-pass subband (2] ) is further decomposed in a similar fashion in](https://thumb-us.123doks.com/thumbv2/123dok_us/1969891.1259932/2.612.196.414.428.546/analysis-synthesis-filtering-resolution-wavelet-decomposition-subband-decomposed.webp)