© 2014, IJCSMC All Rights Reserved 185
Available Online atwww.ijcsmc.com
International Journal of Computer Science and Mobile Computing
A Monthly Journal of Computer Science and Information Technology
ISSN 2320–088X
IJCSMC, Vol. 3, Issue. 10, October 2014, pg.185 – 191
RESEARCH ARTICLE
COMPARATIVE STUDY ON DIFFERENT
CLASSIFICATION TECHNIQUES FOR
BREAST CANCER DATASET
Ahamed Lebbe Sayeth Saabith
1, Elankovan Sundararajan
2, Azuraliza Abu Bakar
31
Centre of Software Technology and Management, Faculty of Information Science and Technology,
Universiti Kebangsaan Malaysia, UKM Bangi, 43600, Selangor-DE, Malaysia
2
Faculty of Information Science and Technology, Universiti Kebangsaan Malaysia, UKM Bangi, 43600,
Selangor-DE, Malaysia
3
Faculty of Information Science and Technology, Universiti Kebangsaan Malaysia, UKM Bangi, 43600,
Selangor-DE, Malaysia
1 [email protected], 2 [email protected], 3 [email protected]
Abstract
Breast cancer is one of the most common cancers among women in the world. Early detection of breast cancer is essential in reducing their life losses. Data mining is the process of analyzing massive data and summarizing it into useful knowledge discovery and the role of data mining approaches is growing rapidly especially classification techniques are very effective way to classifying the data, which is essential in decision-making process for medical practitioners. This study presents the different data mining classifiers on the database of breast cancer, by using classification accuracy with and without feature selection techniques. Feature selection increases the accuracy of the classifier because it eliminates irrelevant attributes. The experiment shows that the feature selection enhances the accuracy of all three different classifiers, reduces the Mean Standard Error (MSE) and increase Receiver Operating Characteristics (ROC).
Keywords:
Data mining, feature selection, breast cancer dataset, decision tree, neural network, rough set.
1. Introduction
© 2014, IJCSMC All Rights Reserved 186
In general, a data mining system accomplishes one or more of the following data mining tasks. Those are class description, association rule mining, classification, prediction, clustering, time series analysis and outlier analysis. Classification is one of the most necessary and essential tasks in data mining.
Data mining approaches in medical domains is increasing rapidly due to the improvement effectiveness of these approaches for classification and prediction. In addition to its importance in finding ways to improve patient outcomes, it reduces the medical cost and enhances early disease discovery.
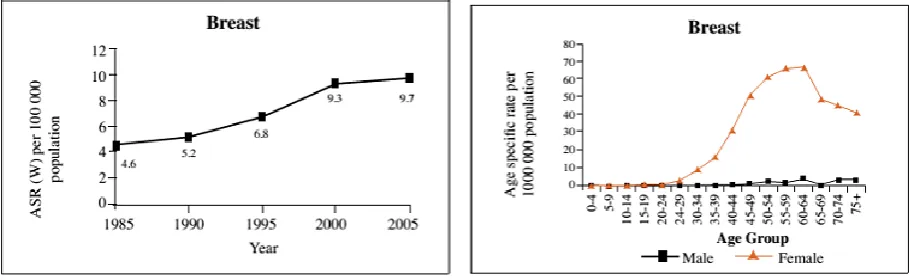
In medical field, breast cancer is considered the most common invasive cancer in women, with more than one million cases and nearly 600,000 deaths occurring worldwide annually[1]. Breast cancer among women has increased in Sri Lanka within the last twenty years. The National Cancer Control Programme (NCCP) report revealed that 18.4 women in every 100,000 had suffered breast cancer in 2005 [4] and the numbers had increased by 6.6 within the last six years. NCCP quoted that currently 25 women for every 100,000 suffered from breast cancer. NCCP statistics reveal that breast cancer has caused the highest number of cancer deaths among women. According to the current statistics 4.7 for every 100,000 women in Sri Lanka has died of breast cancer annually [4].
Figure 1: Breast cancer data statistic 2005 in Sri Lanka
The most effective way to reduce breast cancer deaths is to detect it earlier. Earlier diagnosis needs an exact and solid diagnosis procedure that could be used by physicians to identify benign breast tumors from malignant ones without going for surgical biopsy. The objective of these predictions is to assign patients to one of the two groups either a “benign” that is noncancerous or a “malignant” that is cancerous.
Developing the data mining applications to predict the outcome of a disease is one of the most fascinating and challenging tasks. The use of computers with automated tools, massive volumes of medical and biological data are being collected and made available to the medical research groups. Data mining techniques has become popular research tool for medical researchers to identify and exploit patterns and relationships among large number of variables, and made them able to predict the outcome of a disease using the historical datasets.
Many analyses performed on medical datasets using multiple classifiers and feature selection techniques. The overall objective of this study is to analyze and compare the performance of three different classification techniques with and without feature selection techniques using the data mining tools such as WEKA and ROSETTA
.
2. Classification techniques
© 2014, IJCSMC All Rights Reserved 187
2.1 Decision tree
Decision trees have become one of the most powerful and popular classification approaches in knowledge discovery and data mining, which classify the labeled trained data into a tree or rules. Once the tree or rules are derived in learning phase to test the accuracy of a classifier, test data is taken randomly from training data. After verification of accuracy, unlabeled data is classified using the tree or rules obtained in learning phase. Both theoreticians and practitioners are continually seeking techniques to make the process more efficient, cost-effective and accurate. Decision trees are frequently used in applied fields such as finance, marketing, engineering and medicine. Decision tree classifiers are used extensively for diagnosis of diseases such as breast cancer, ovarian cancer and heart sound diagnosis and so on ([2],[6],[7],[17],[18]). There are several algorithms to classify the data using decision trees. The frequently used decision tree algorithms are J48, ID3, C4.5 and CART. In this study J48 algorithm has been used to analyze the performance with and without feature selection techniques.
2.2 Neural network
An Artificial Neural Network (ANN), generally known as "Neural Network" (NN), is a mathematical model or computational model based on biological neural networks. It consists of an interconnected group of artificial neurons and processes information using a connectionist approach to computation. In most cases, an ANN is a robust system that changes its structure based on external or internal information that flows through the network during the learning phase [13].
ANN has confirmed as a powerful method for cancer prognosis [3]. It is also superior to conventional methods employed for breast cancer prediction such as TNM (Tumor, Node and Metastasis) staging system and logistic regression [9]. One of the main advantages of ANN over conventional methods is their ability in capturing the complex and nonlinear interaction between prognostic markers and the outcome to be predicted. An ANN can have different structures based on the type of its input-output data and also its application. Among available structures, multilayer perception (MLP) has been more widely used for the aim of cancer prediction and prognosis [15]. Back propagation neural network is also used for detection of breast cancer and it is considered more suitable to compare with other neural network models [11]. In this study, MLP algorithm has been selected to compare the performance considering with and without feature selection techniques
.
2.3 Rough set
Rough set theory, proposed in 1982 by Zdzislaw Pawlak, is in a state of constant development. Its methodology is concerned with the classification and analysis of imprecise, uncertain or incomplete information and knowledge, and it is considered one of the first non-statistical approaches in data analysis [12]. Over the years rough set theory has become a valuable tool in the resolution of various problems, such as: representation of uncertain or imprecise knowledge, knowledge analysis, evaluation of quality and availability of information, identification and evaluation of date dependency, reasoning based an uncertain and reduce of information data. In a research done by [16] to improve the accuracy of diagnosis, they used Wisconsin Breast Cancer Dataset (WBCD) and found out that there is a better performance when using attributes reduction under rough set theory. The extent of rough set applications used today is much wider than in the past, principally in the areas of medicine, analysis of database attributes and process control. In this study, Standard Voting and Johnson reducer has been used to analyze the performance of three different classification techniques. Standard Voting and Johnson reducer is an efficient algorithm under rough set. Also this algorithm is very fast because it uses a greedy search to find out reduction.
3. Feature selection
Feature selection (FS) plays an important role in classification. This is one of the preprocessing techniques in data mining. Feature selection is extensively used in the fields of statistics, pattern recognition and medical domain. Feature selection means reducing the number of attributes. The attributes are reduced by removing irrelevant and redundant attributes, which do not have significance in classification task. The feature selection improves the performance of the classification techniques. The processes of feature selection are as follows:
• Generation of candidate subsets of attributes from original feature set using searching techniques.
• Evaluation of each candidate subset to determine the relevancy towards the classification task using measures such as distance, dependency, information, consistency, classifier error rate.
© 2014, IJCSMC All Rights Reserved 188
Training Testing J48 MLP Rough Set
1 90 10 79.31% 79.31% 48.28%
2 80 20 64.91% 64.91% 59.65%
3 70 30 69.77% 63.95% 65.12%
4 60 40 71.93% 68.42% 64.91%
5 50 50 70.63% 67.83% 63.38%
6 40 60 70.35% 69.19% 64.9123
7 30 70 71.50% 71% 59.30%
8 20 80 73.36% 73.80% 57.89%
9 10 90 69.26% 70.43% 41.80%
71.22% 69.87% 58.36%
Accuracy (%) without Feature Selection TEchnique Data Allocation
(%)
AVERAGE
Model
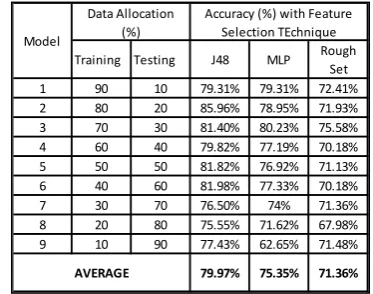
4. Methodology
The figure 2 describes the methodology. The benchmark breast cancer dataset obtained from UCI repository site is used to carry out this research.
4.1 Data preprocessing
In this study has used breast cancer dataset with 286 records supplied by the UCI machine learning repository. There are ten attributes describing various properties of breast cancer like age group of the woman (age), size of the tumor (tumor-size), side of the breast (breast), menopause, inv-nodes, node-caps, deg-malig, breast-quad, irradiat, class variable (No, Yes) <no-recurrence-events, recurrence-events>. The classification experiment is run with various data allocation (training set and testing set) on the same breast cancer dataset. There are eight missing values in node-caps and one missing value in breast-quad. Missing values were replaced by using the WEKA pre-processing techniques.
4.2 Developing classification model
To develop the classification model, we used ROSETTA for rough set classification and WEKA (Waikato Environment for Knowledge Analysis) for neural network and decision tree. ROSETTA is a software package that implements rough set-based rule induction and includes a number of additional features such as model validation. This software is implemented with a user friendly graphical interface and is used by a large community of scientists whereas WEKA is a comprehensive suite of Java class libraries that implement many data mining algorithms.
5. Experimental results
Table 1: exhibits the classification accuracy without feature selection technique. This shows the percentages of accuracy for J48, MLP and Rough set (Standard Voting and Johnson reducer). To find the percentage of accuracy, dataset has been changed as training set and testing set according to the mentioned ratio. The table shows the average accuracy for J48, MLP and Rough set are 71.22%, 69.87% and 58.36% respectively.
Table 1: Average Accuracy without Feature Selection Technique Figure 2: Classification Process
UCI repositories Breast Cancer Dataset
Preprocessing Dataset Classification Techniques (Decision
Tree, Neural Network, Rough Set) Testing, Evaluation and
© 2014, IJCSMC All Rights Reserved 189
Training Testing J48 MLP Rough Set
1 90 10 79.31% 79.31% 72.41%
2 80 20 85.96% 78.95% 71.93%
3 70 30 81.40% 80.23% 75.58%
4 60 40 79.82% 77.19% 70.18%
5 50 50 81.82% 76.92% 71.13%
6 40 60 81.98% 77.33% 70.18%
7 30 70 76.50% 74% 71.36%
8 20 80 75.55% 71.62% 67.98%
9 10 90 77.43% 62.65% 71.48%
79.97% 75.35% 71.36%
Data Allocation (%) Model
Accuracy (%) with Feature Selection TEchnique
AVERAGE
7
1
.2
2
%
6
9
.8
7
%
5
8
.3
6
%
7
9
.9
7
%
7
5
.3
5
%
7
1
.3
6
%
J48 MLP Rough Set
Accuracy comparison with and without feature selection
Accuracy(%) Without Feature Selection Accuracy(%) With Feature Selection
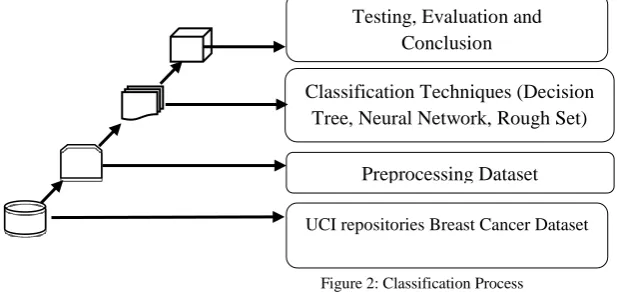
The classification accuracy with feature selection technique has been illustrated in Table 2. This shows the percentages of accuracy for J48, MLP and Rough set (Standard Voting and Johnson reducer). To find the percentage of accuracy dataset has been changed as training set and testing set according to mentioned ratio. The table shows the average accuracy for J48, MLP and Rough set are 79.97%, 75.35% and 71.36% respectively.
Table 2: Average Accuracy with Feature Selection Technique
The accuracy comparison with and without feature selection techniques has been shown in Chart 1. Experimental results shows the accuracy of the above three classification algorithms of J48, MLP and Rough set without feature selection techniques are 71.22%, 69.87% and 58.36% respectively. The accuracy of feature selection techniques for J48, MLP and Rough set are 79.97%, 75.35% and 71.36% respectively. The accuracy of all three classification algorithms has been increased under the with feature selection techniques. Therefore the feature selection technique is one of important factors to diagnose breast cancer earlier.
Table 3: illustrates the median standard error (MSE) with and without feature selection techniques. Under the without feature selection techniques, the average MSE of J48 is 0.4784 and MSE of MLP is 0.5155. On the other hand, under the with feature selection techniques the average of MSE are 0.3961 and 0.4481 respectively. Median standard error has been reduced with feature selection techniques of J48 and MLP algorithms. Pictorial representation of the comparison of both with and without feature selection techniques has been illustrated in chart 2.
Chart 1:
Classification Accuracy without FS
Chart 3:
Classification Accuracy with FS
© 2014, IJCSMC All Rights Reserved 190
J48 MLP J48 MLP
1 90_10 0.4186 0.597 0.799 0.802 2 80_20 0.459 0.56 0.785 0.736 3 70_30 0.486 0.514 0.669 0.705 4 60_40 0.551 0.637 0.684 0.651 5 50_50 0.551 0.631 0.685 0.649 6 40_60 0.567 0.663 0.689 0.678
7 30_70 0.578 0.616 0.5 0.65
8 20_80 0.617 0.671 0.57 0.699
9 10_90 0.5 0.602 0.5 0.567
0.5253 0.6101 0.6534 0.6819 Model Data
Allocation
ROC without Feature Selection
ROC with Feature Selection AVERAGE 0.5253 0.6534 0.6101 0.6819 0.0000 0.1000 0.2000 0.3000 0.4000 0.5000 0.6000 0.7000 0.8000 ROC for J48 without FS ROC for J48 with FS ROC for MLP without FS ROC for MLP with FS ROC Comparison with and without FS
0.4784 0.3961 0.5155 0.4491 0.0000 0.1000 0.2000 0.3000 0.4000 0.5000 0.6000 MSE for J48 without FS MSE for J48 with FS MSE for MLP without FS MSE for MLP with FS MSE Comparison with and without
feature selection
J48 MLP J48 MLP
1 90_10 0.526 0.4645 0.3617 0.39 2 80_20 0.4915 0.5367 0.3328 0.413 3 70_30 0.48 0.5501 0.384 0.4117 4 60_40 0.4592 0.4977 0.392 0.4267 5 50_50 0.475 0.5131 0.3971 0.4244 6 40_60 0.4757 0.5241 0.3894 0.4415 7 30_70 0.4672 0.5188 0.4241 0.4749
8 20_80 0.459 0.5 0.4488 0.4878
9 10_90 0.4722 0.5347 0.4347 0.5716 0.4784 0.5155 0.3961 0.4491
MSE with FS MSE without FS
Model Data Allocation
AVERAGE
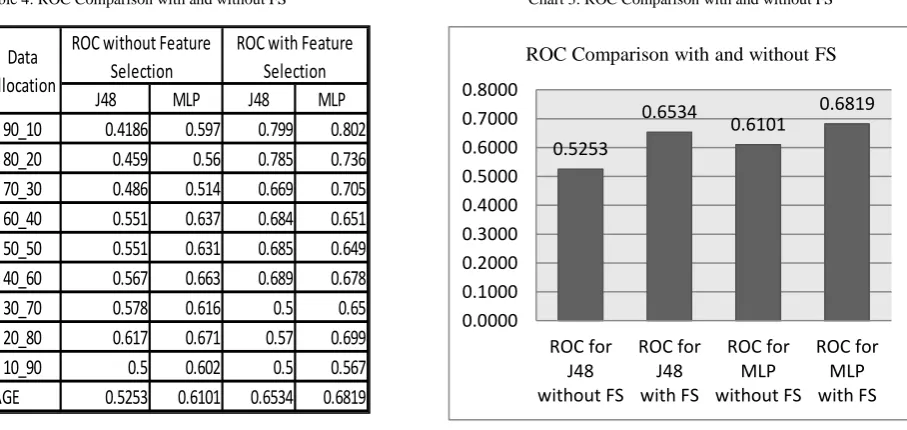
Table 4: exhibits the receiver operating characteristics (ROC) with and without feature selection techniques. Under the without feature selection techniques, the average ROC of J48 is 0.5253 and ROC of MLP is 0.6101. The averages of ROC under with feature selections are 0.6534 and 0.6819 respectively. Therefore, it can be said that J48 and MLP algorithms are more efficient with feature selection techniques. Chart 3: also illustrates MSE comparison with and without feature selection techniques in graphical way.
6. Conclusion
In this research, the three classification techniques such as J48, MLP and Rough set were used to evaluate the percentage of accuracy with and without feature selection techniques for breast cancer effective prediction. In order to achieve the objective breast cancer dataset from UCI machine learning dataset has been utilized. Several tests were done by changing the testing and training dataset ratio and obtained significant results under with feature selection technique. The feature selection techniques are used to eliminate those attributes that have no significance in the classification process. Therefore, feature selection technique is the most reliable significant method to improve the accuracy of different classification techniques, to reduce the Median Standard Error (MSE) and to increases Receiver Operating Characteristics (ROC) to diagnosis the breast cancer disease.
Chart 2:MSE Comparison with and without FS Table 3:MSE Comparison with and without FS
© 2014, IJCSMC All Rights Reserved 191
References
[1] American Cancer Society (2013).
[2] Aruna, S. P. R. a. L. V. N. (2011). An Empirical Comparison of Supervised learning algorithms in Disease Detection.
International Journal of Information Technology Convergence and Services (IJITCS), 1(4), 81-92.
[3] Burke, H. B., Rosen, D. B., & Goodman, P. H. (1994). Comparing artificial neural networks to other statistical methods
for medical outcome prediction. Paper presented at the Neural Networks, 1994. IEEE World Congress on
Computational Intelligence., 1994 IEEE International Conference on. [4] Cancer Incidence Data. (2009) (Vol. 7). Sri Lanka.
[5] Endo, A., Shibata, T., & Tanaka, H. (2008). Comparison of Seven Algorithms to Predict Breast Cancer Survival (< Special Issue> Contribution to 21 Century Intelligent Technologies and Bioinformatics). Biomedical fuzzy and human
sciences: the official journal of the Biomedical Fuzzy Systems Association, 13(2), 11-16.
[6] Kuo, W.-J., Chang, R.-F., Chen, D.-R., & Lee, C. C. (2001). Data mining with decision trees for diagnosis of breast tumor in medical ultrasonic images. Breast cancer research and treatment, 66(1), 51-57.
[7] Lavanya, D., & Rani, D. K. U. (2012). Ensemble Decision Tree Classifier for Breast Cancer Data. International Journal of
Information Technology Convergence and Services (IJITCS) Vol, 2.
[8] Lavanya, D., & Rani, K. U. (2013). A Hybrid Approach to Improve Classification with Cascading of Data Mining Tasks.
International Journal of Application or Innovation in Engineering & Management, ISSN, 2319-4847.
[9] Mojarad, S. A., Dlay, S. S., Woo, W. L., & Sherbet, G. (2010). Breast Cancer prediction and cross validation using
multilayer perceptron neural networks. Paper presented at the Communication Systems Networks and Digital Signal
Processing (CSNDSP), 2010 7th International Symposium on.
[10] Mumtaz, K., Sheriff, S., & Duraiswamy, K. (2009). Evaluation of three neural network models using Wisconsin breast
cancer database. Paper presented at the Control, Automation, Communication and Energy Conservation, 2009.
INCACEC 2009. 2009 International Conference on.
[11] Pawar, P. S., & Patil, D. R. (2013). Breast Cancer Detection Using Neural Network Models. Paper presented at the Communication Systems and Network Technologies (CSNT), 2013 International Conference on.
[12] Pawlak, Z. (1982). Rough sets. International Journal of Computer & Information Sciences, 11(5), 341-356.
[13] S.Neelamegam, D. E. R. (2013). Classification algorithm in Data mining: An Overview. International Journal of P2P
Network Trends and Technology (IJPTT), 3(8), 369 - 374.
[14] Salama, G. I., Abdelhalim, M., & Zeid, M. A.-e. (2012). Breast cancer diagnosis on three different datasets using multi-classifiers. Breast Cancer (WDBC), 32(569), 2.
[15] Schwarzer, G., Vach, W., & Schumacher, M. (2000). On the misuses of artificial neural networks for prognostic and diagnostic classification in oncology. Statistics in medicine, 19(4), 541-561.
[16] Sridevi, T., & Murugan, A. (2012). Rough set theory based attribute reduction for breast cancer diagnosis. Indian Journal
of Innovations and Developments, 1(5), 309-313.
[17] Stasis, A. C., Loukis, E., Pavlopoulos, S., & Koutsouris, D. (2003). Using decision tree algorithms as a basis for a heart
sound diagnosis decision support system. Paper presented at the Information Technology Applications in Biomedicine,
2003. 4th International IEEE EMBS Special Topic Conference on.
[18] Vlahou, A., Schorge, J. O., Gregory, B. W., & Coleman, R. L. (2003). Diagnosis of ovarian cancer using decision tree classification of mass spectral data. BioMed Research International, 2003(5), 308-314.