Algorithms for Minimizing Analytical Variability in Multiplexed
Pneumococcal IgG Measurements
Thomas M. Daly,aJerry W. Pickering,bXiaochun Zhang,aHarry E. Prince,dHarry R. Hillb,c
Robert J. Tomsich Department of Pathology, Cleveland Clinic, Cleveland, Ohio, USAa
; ARUP Laboratories, Salt Lake City, Utah, USAb
; Departments of Pathology, Pediatrics, and Medicine, University of Utah, Salt Lake City, Utah, USAc
; Focus Diagnostics, Cypress, California, USAd
Pneumococcal vaccination is frequently used to assess a patient’s humoral immune function. The comparison of pre- and postvaccination levels of antipneumococcal antibodies is widely held to be the gold standard for documenting a response. However, many of the published criteria for defining an adequate response are based on assays that are no longer widely available. We compared the clinical classification of patient response by multiplex pneumococcal assays currently per-formed at three large reference laboratories using a variety of published criteria for defining responses in adults. The clas-sification of responders agreed for 79% of the patients when using a threshold-based algorithm compared to 57 to 96% of the patients when using various fold-change-based algorithms. The highest rate of discordance was seen when the most stringent criteria for response were used (4-fold increase postvaccination in 70% of serotypes). The discordant samples tended to show similar patterns of response across all three assays, with small variations in the final number of serotypes converting postvaccination. We conclude that the use of published cut points for documenting response to pneumococcal vaccination can be affected by interlaboratory differences in pneumococcal assays, particularly for algorithms that require large fold changes for a response to be documented. However, the overall patterns of response were similar in virtually all samples, regardless of the assay used.
P
neumococcal vaccination is often used to evaluate a patient’sresponse to polysaccharide antigens during a workup for de-ficiencies in antibody production. The adequacy of the specific vaccine response can be assessed by measuring postvaccination levels of antipneumococcal antibodies and by comparing these levels against predetermined cut points for either the absolute antibody level or the fold change relative to the baseline value. Measurements can be performed by a variety of analytical meth-ods, including enzyme-linked immunosorbent assays (ELISAs)
for total pneumococcal antibody level (1), ELISAs for antibodies
against specific pneumococcal serotypes (2), and multiplex assays
which measure the levels of a panel of serotype-specific antibodies
(3–5). Because the vast majority of assays used for this purpose are
lab-developed tests (LDTs) that were created and characterized by individual laboratories, the potential for interlaboratory variation in results exists. This may lead to difficulties when trying to inter-pret analytical results compared to the literature-based definitions for a therapeutic response to vaccination.
The assessment of a patient’s response when only a single (postvaccination) sample is available is usually done by
compar-ing serotype-specific results against a “protective” threshold (6).
However, the use of paired pre- and postvaccination samples is preferred because of the additional information provided for eval-uating humoral immune function, which is the primary objective of these assays. Approaches for evaluating response from paired specimens can be broadly divided into threshold-based and fold-change-based algorithms. For threshold-based approaches, the levels of antibody in the postvaccination specimen are compared
against a predetermined threshold to demonstrate response (6,7).
While similar to the approach used for single specimens, the avail-ability of the baseline sample helps to ensure that conversion of individual serotypes from a nonprotected to a protected status is
due to vaccination, not to prior exposure to pneumococcal infec-tion and/or nonspecific assay interferences for individual sero-types. For the fold-change approaches, the absolute level of pneu-mococcal antibody in the postvaccination specimen is expressed as a ratio to the baseline level to quantify the increase following
vaccination (8). This approach is particularly helpful in patients
who have protective levels of antibody prior to vaccination, be-cause it allows one to quantify the response above what was pres-ent at baseline.
Many different recommendations for what constitutes an ad-equate vaccination response have been published. Historically, the most commonly recommended criteria for an adequate
vaccina-tion response in adults have been either an absolute level of⬎1.3
g/ml or a 4-fold change in antibody levels postvaccination,
usu-ally in 70% of serotypes (6,9–11). However, clinical data on the
relative performance of these thresholds are limited, and as a re-sult, there is not a universal consensus on these recommendations. Lower thresholds have been suggested for the percentage of sero-types (50% versus 70%) and the fold change (2-fold versus 4-fold)
required (10,12) for a response to be documented.
An additional complication is the fact that many of the recom-mendations in the literature are based on analytical methods that
Received14 April 2014Returned for modification23 April 2014
Accepted5 May 2014
Published ahead of print7 May 2014
Editor:C. J. Papasian
Address correspondence to Thomas M. Daly, [email protected].
Copyright © 2014, American Society for Microbiology. All Rights Reserved.
doi:10.1128/CVI.00235-14
on August 17, 2020 by guest
http://cvi.asm.org/
are not commercially available for current use, which calls into question how relevant these cut points will be with the current methodologies. Bead-based multiplex immunoassays are the most widely available technique in commercial U.S. laboratories
for measuring pneumococcal antibody levels (13), but most assays
are LDTs that are unique to a particular laboratory. As a result, it is not clear how the clinical classification of a response would be affected by interlaboratory variability in the assays. To address this, we have evaluated the performance of three multiplex pneu-mococcal IgG assays in a large series of paired pre- and postvacci-nation samples to determine what impact analytical variability has on the final clinical classification of these patients under a variety of algorithms for defining a response.
MATERIALS AND METHODS
Sample acquisition.Serum samples used for this study were residual material from specimens submitted to ARUP Laboratories for pneu-mococcal antibody testing. All samples were deidentified according to protocols approved by the University of Utah Institutional Review Board. Paired pre- and post-pneumococcal vaccination samples were obtained from 47 individuals who ranged in age from 2 to 82 years (median age, 42 years).
Pneumococcal IgG testing.The samples were tested by three refer-ence laboratories using different assays for measuring serotype-specific pneumococcal IgG antibody levels. Although all three assays were based on the same bead-based multiplex immunoassay platform, the specific analytical methods varied among the laboratories. Laboratory A used the TABLE 1Between-assay correlations in absolute pneumococcal antibody levelsa
Laboratory comparison
and serotype r Slope (95% CIb) Intercept Biasc % bias nd
A vs C
1 0.9599 0.979 (0.913 to 1.046) ⫺0.057 ⫺0.176 ⫺3.1 71
3 0.8725 0.833 (0.733 to 0.933) ⫺0.348 ⫺1.057 ⫺28.5 74
4 0.9729 0.868 (0.823 to 0.913) ⫺0.213 ⫺0.429 ⫺30.2 82
6B 0.9442 1.433 (1.315 to 1.552) ⫺2.93 2.34 17.6 66
7F 0.9659 1.076 (1.016 to 1.136) ⫺0.664 ⫺0.262 ⫺5.0 89
8 0.9025 1.242 (1.120 to 1.365) 0.037 1.284 22.2 80
9N 0.9608 1.099 (1.027 to 1.171) ⫺0.607 ⫺0.044 ⫺0.8 74
9V 0.9484 1.19 (1.107 to 1.274) ⫺1.176 ⫺0.277 ⫺6.0 84
12F 0.9404 1.167 (1.055 to 1.278) ⫺1.165 0.143 1.8 54
14 0.9565 1.184 (1.104 to 1.263) ⫺1.214 0.258 3.2 78
18C 0.9652 1.203 (1.125 to 1.280) ⫺0.604 ⫺0.062 ⫺2.3 68
19F 0.3473 8.933 (7.092 to 10.774) ⫺42.688 2.066 31.0 84
23F 0.9605 1.294 (1.210 to 1.378) ⫺0.548 0.345 ⫺10.8 75
A vs B
1 0.6634 0.666 (0.534 to 0.798) 1.661 ⫺0.002 0.0 82
3 0.7889 0.521 (0.435 to 0.608) ⫺0.097 ⫺1.814 ⫺67.7 74
4 0.7399 0.679 (0.564 to 0.795) 0.2 ⫺0.246 ⫺19.4 82
6B 0.7852 0.651 (0.536 to 0.766) 1.07 ⫺1.783 ⫺24.5 63
7F 0.6731 0.468 (0.375 to 0.561) 0.612 ⫺2.088 ⫺51.8 90
8 0.675 0.889 (0.726 to 1.052) 0.841 0.385 9.0 82
9N 0.5103 0.314 (0.212 to 0.416) 1.368 ⫺1.706 ⫺47.0 76
9V 0.6744 1.117 (0.922 to 1.312) ⫺0.961 ⫺0.458 ⫺11.3 84
12F 0.8121 0.255 (0.215 to 0.294) 1.074 ⫺1.728 ⫺59.7 82
14 0.6983 0.685 (0.557 to 0.813) ⫺0.442 ⫺2.846 ⫺45.8 80
18C 0.6609 3.925 (3.232 to 4.619) ⫺2.437 4.749 98.3 74
19F 0.2223 5.84 (4.584 to 7.096) ⫺22.998 2.275 35.8 84
23F 0.7496 0.939 (0.776 to 1.102) 0.07 ⫺0.052 ⫺2.6 69
B vs C
1 0.582 0.404 (0.296 to 0.513) 3.124 ⫺0.698 ⫺11.5 75
3 0.7661 0.548 (0.455 to 0.641) 0.332 ⫺0.916 ⫺39.8 78
4 0.8504 1.024 (0.899 to 1.148) 0.249 0.27 26.6 82
6B 0.7465 0.354 (0.283 to 0.425) 2.467 ⫺3.663 ⫺47.9 70
7F 0.6902 0.304 (0.241 to 0.366) 1.448 ⫺2.676 ⫺58.4 89
8 0.4425 0.296 (0.185 to 0.407) 2.947 ⫺1.668 ⫺29.1 76
9N 0.5121 0.305 (0.207 to 0.404) 1.459 ⫺1.466 ⫺42.1 77
9V 0.7287 0.522 (0.429 to 0.615) 1.584 ⫺1.025 ⫺20.7 86
12F 0.8043 0.188 (0.149 to 0.228) 1.667 ⫺3.24 ⫺73.2 51
14 0.8061 0.422 (0.359 to 0.484) 1.197 ⫺6.302 ⫺64.2 86
18C 0.6582 0.686 (0.548 to 0.823) 4.825 2.362 26.2 80
19F 0.7766 1.738 (1.495 to 1.981) 0.267 3.767 56.9 85
23F 0.9102 0.772 (0.693 to 0.850) 0.225 ⫺0.203 ⫺11.4 73
aAll possible pairwise comparisons of the three assays are shown for each serotype. Regression statistics were calculated by Deming analysis.
b
CI, confidence interval.
cAverage bias is presented as the absolute bias and the percent bias for each comparison.
d
Number of samples which fell within the quantifiable range of the assays in question for a given pairwise comparison.
Multiplex Pneumococcal IgG Interpretation
on August 17, 2020 by guest
http://cvi.asm.org/
xMAP Pneumo 14 pneumococcal immunity panelin vitro diagnostic (IVD) kit previously marketed by Luminex (Austin, TX). This assay de-tects antibodies against 14 pneumococcal serotypes, i.e., 1, 3, 4, 6B, 7F, 8, 9N, 9V, 12F, 14, 18C, 19A, 19F, and 23F. Standard values for the assay are calibrated to FDA-89 reference serum, and assay buffers incorporate cell wall polysaccharide and polysaccharide type 22F as blocking agents. The performance characteristics of this assay have been reported (14,15). The samples assayed at laboratories B and C were tested using LDTs based on the Luminex platform, which measures antibodies against 14 pneumo-coccal serotypes, i.e., 1, 3, 4, 5, 6B, 7F, 8, 9N, 9V, 12F, 14, 18C, 19F, and 23F. As with the IVD assay, the LDTs are calibrated to FDA-89 reference serum and utilize buffers containing cell wall polysaccharide and polysac-charide type 22F to minimize nonspecific binding. All samples were tested once, and the assays were run according to the standard protocols in place at the performing laboratory.
Definition of vaccination response.A threshold-based response was defined as a response in a patient in whom 70% of the serotypes achieved an absolute level of⬎1.3g/ml in the postvaccination sample (6,10). Response calculations were performed for 43/47 patients (four patients were excluded from threshold-based analysis because their prevaccina-tion samples already exceeded the threshold). Fold-change response cal-culations were performed by dividing the postvaccination values by the prevaccination values for all serotypes for which the results fell within the reportable range of the assay. For patients in whom one of the two samples fell out of range (i.e., a result below the limit of detection for the prevac-cination sample or above the limit of detection for the postvacprevac-cination sample), the ratio was calculated by using the corresponding limit of de-tection for the assay (which would represent a minimum estimate of the fold change). For patients in whom both samples fell below the limit of detection, a fold change of 1 was entered to represent a lack of response for that serotype.
Statistical analysis.Method comparisons and correlation statistics for quantitative results were calculated using EP Evaluator software (release 9). Correlations were calculated using Deming regression.
RESULTS
Quantitative variation in pneumococcal IgG measurements be-tween assays. The absolute pneumococcal antibody levels re-ported for each serotype were directly compared across
laborato-ries for the 13 serotypes common to all the assays. A total of 3,666 individual serotype results were generated from the 94 samples in the test set. Pairwise comparisons were performed for all possible combinations of laboratories using specimens in which the values fell within the reportable range of the respective assays. Correla-tion coefficients varied widely between the laboratories and
be-tween serotypes, withrvalues ranging from 0.22 to 0.96 (Table 1).
This was similar to the results seen in our prior study, which
com-pared a different set of LDTs in single specimens (16). However,
unlike the prior study, no systematic bias was seen for any assay relative to the others, and the median values were not significantly different between laboratories for the majority of serotypes (data not shown). Serotypes 18C and 19F showed the most variation between laboratories.
Clinical classification of response using a threshold-based algorithm.Responders were defined as patients in whom 70% of
the serotypes achieved an absolute level of⬎1.3g/ml in the
postvaccination sample, based on previously published
recom-mendations from Paris and Sorensen (6). In the individual
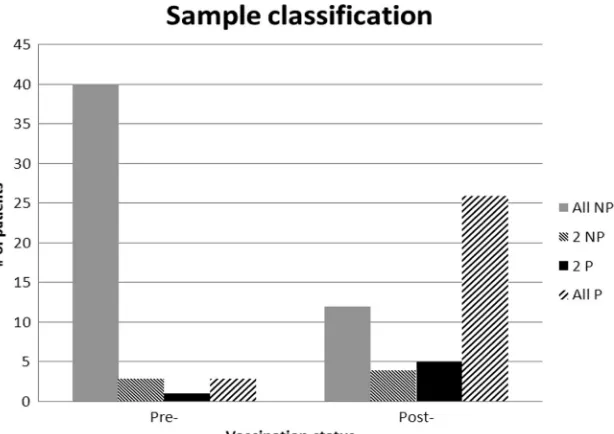
speci-mens tested, 86% (81/94) were classified in the same way by all three laboratories. However, there was a notable difference in agreement rates between the pre- and postvaccination samples, with a higher degree of concordance in the pretreatment samples (Fig. 1). As a result, 79% (34/43) of the evaluable patients received the same final classification from all 3 laboratories (22 responders and 12 nonresponders). The response patterns were fairly consis-tent between laboratories, although the exact number of serotypes
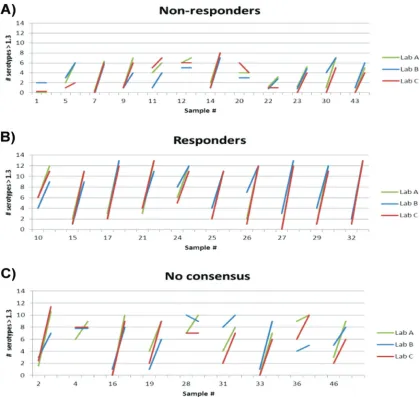
converting varied slightly in some samples (Fig. 2AandB). The
majority of the nine discrepant patients were those in whom the overall trends of serotype conversion were similar across all labo-ratories but whose samples narrowly missed the 70% threshold in
one of the three assays (Fig. 2C).
Clinical classification of response using a fold-change algo-rithm.We next calculated fold-change ratios for each pneumo-coccal serotype (using the criteria described in Materials and
FIG 1Interlaboratory agreement in clinical classifications using a threshold algorithm. Samples were classified as protected ifⱖ9 serotypes had antibody levels of⬎1.3g/ml. NP, nonprotected; P, protected. 2 NP and 2 P indicate the majority classification based on 2 of the 3 laboratories.
on August 17, 2020 by guest
http://cvi.asm.org/
Methods) and classified patients as responders or nonresponders based on the magnitude of increase in antibody level in the post-vaccination sample. Because several different cutoffs have been recommended in the literature, we evaluated multiple response criteria by varying the fold change required for response (2-fold versus 4-fold) and the percentage of serotypes showing this
change (50% versus 70%). Interassay agreement was⬎90% when
using the least stringent definition of response (a 2-fold increase in 50% of the samples), but it dropped with increasing stringency of
response criteria (Table 2). The disparity at higher cut points was
largely driven by samples identified as consensus responders at the 2-fold/50% cut point that shifted to nonresponders at a higher threshold in one or more laboratories.
Comparison of fold-change- and threshold-based classifica-tions.Finally, we examined whether the choice of response algo-rithm had an impact on final patient classification by comparing
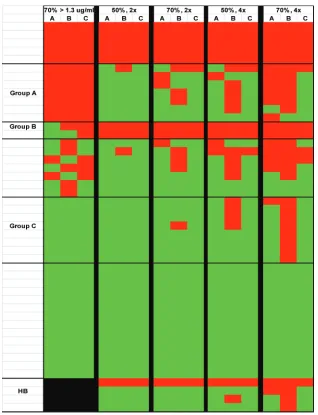
the results for each patient across all the methods (Fig. 3).
Forty-three percent of the patients were classified identically across all
the laboratories using all the algorithms (6 nonresponders [Fig. 3,
red areas] and 14 responders [Fig. 3, green areas]). The majority of
the discrepant samples fell into several distinct categories (Fig. 4).
FIG 2Serotype conversion in paired samples using a threshold algorithm. Each individual line indicates the change between the number of serotypes with values of⬎1.3g/ml in pre- and postvaccination samples from a given patient. Response was defined as havingⱖ9 serotypes reach the 1.3-g/ml threshold postvaccination. (A) Consensus nonresponders. Although many of these patients showed an increase postvaccination, they did not reach the 70% (9-serotype) threshold required to be deemed responders as defined by the algorithm. (B) Consensus responders. Ten representative samples out of 22 total responders identified in the test set are shown. (C) No consensus. Nine samples were classified differently between laboratories. Most of these samples showed similar trends postvaccination between labs but narrowly missed the 9-serotype threshold in one or more laboratories.
TABLE 2Interassay agreement using fold-change approach
Fold changea % agreementb All Rc 2 R 2 NR All NRd
2⫻increase in 50% of serotypes 96 37 2 0 8
2⫻increase in 70% of serotypes 79 29 9 1 8
4⫻increase in 50% of serotypes 68 23 14 1 9
4⫻increase in 70% of serotypes 57 16 12 8 11
a
Fold change was calculated as the postvaccination level/prevaccination level ratio for each serotype.
b
Percent agreement is based on the total number of samples classified by all three laboratories as being from a responder or nonresponder.
c
R, responder.
dNR, nonresponder.
Multiplex Pneumococcal IgG Interpretation
on August 17, 2020 by guest
http://cvi.asm.org/
Seven patients were classified as nonresponders by all the methods using the threshold approach but were called responders by most
methods using the fold-increase definitions (Fig. 3, group A).
These were primarily patients with 5 to 8 serotypes who achieved
a level of⬎1.3 g/ml postvaccination and therefore narrowly
missed the 70% needed to reach the threshold but had widespread
increases in levels across most titers (Fig. 4). Two patients were
classified as nonresponders by all the labs by the fold-change
method but had mixed results by the threshold method (Fig. 3,
group B). These patients had high baseline levels of antibody in multiple serotypes in their prevaccination samples and showed
minimal changes postvaccination (Fig. 4). Finally, an additional 8
patients were classified as consistent responders in most cases us-ing the threshold and fold-change criteria, but their levels failed to
meet the 4-fold threshold for response in laboratory B (Fig. 3,
group C). However, the overall patterns of increased levels
post-vaccination in this group were similar across all the laboratories (Fig. 4), and the patient would likely have been called responders based on the combined trend across all serotypes. The remaining seven discordant samples showed mixed responses across the var-ious laboratories and algorithms.
DISCUSSION
Multiplex immunoassays are some of the most analytically com-plex techniques in clinical use. As such, they can be prone to sub-stantial analytical variability between laboratories, particularly for LDTs that are independently developed in different locations. Multiplex pneumococcal IgG measurements are no exception to
this. As demonstrated in this study and elsewhere (13,16),
inter-assay agreements in quantitative antibody levels can show sub-stantial variation, agreeing well for some serotype-assay combina-tions while disagreeing for others. However, this variability can be
FIG 3Comparison of classifications using threshold or fold-change methods. Patients labeled as responders according to each set of criteria are represented in green, while nonresponders are represented in red. Each row represents the clinical classification for an individual patient, while each column shows results from a single laboratory. HB, high-baseline samples (which were not classified using the threshold approach). Groups A, B, and C represent different response patterns as described in the text. Column headers represent the cutoff values used to define responses by either the threshold (70% of serotypes reaching a level of⬎1.3
g/ml) or fold-change (percentage of serotype, fold change) approach.
on August 17, 2020 by guest
http://cvi.asm.org/
somewhat mitigated by the use of clinical algorithms that consider the serotype profile as a whole.
Overall, threshold-based algorithms for defining response were less affected by interlaboratory variability than algorithms based on fold change. The interlaboratory agreement in response classification was 79% when using a threshold-based definition of response, which is similar to the 82% agreement in protective
status seen in our prior study, which used single specimens (16).
The results for algorithms that used a 2-fold cutoff were also fairly consistent between laboratories, ranging from 79 to 96% agree-ment. However, increasing the definition of response to a 4-fold increase led to more disparity between the methods. Interestingly, individual analysis of the paired results in these discordant pa-tients showed that many of these papa-tients actually had very similar patterns of serotype response. Many of the postvaccination sam-ples that failed to meet a given response criteria (threshold or fold change) in 70% of the serotypes clearly showed an increase above baseline samples in the results from all laboratories and usually reached the 50% threshold. As a result, they would likely have been considered responders based on the overall pattern if inter-preted as a whole.
One area where interassay differences had a noticeable impact was the magnitude of the fold change calculated, which can vary from 10- to 100-fold in some cases. The primary factors underly-ing this effect were differences in the reportable ranges of the var-ious assays, particularly on the low end. For example, laboratory C had the lowest reportable range of the three assays, reporting
re-sults as low as 0.01g/ml for some serotypes (Fig. 4). As a result,
this lower denominator resulted in larger calculated fold changes in many cases compared to those for laboratories A and B. For the most part, this had very little impact on the final clinical classifi-cation, because strongly responding serotypes would consistently
meet the response criteria in all assays. However, assay-specific differences such as this may make it difficult to directly apply literature-derived cut points for fold-change data that are gener-ated using different assays.
One potential limitation to this study is that all of the assays tested were based on a single underlying technology (the Lu-minex-based multiplex bead array). As a result, these assays may show a better level of agreement than one would see when com-paring LDTs based on differing analytical platforms. From a prac-tical standpoint, multiplex bead arrays are the primary technology utilized for most commercially available tests in the United States, so these results should be applicable to current clinical practice. However, clinical implementation of other multiplex methodol-ogies for pneumococcal serotyping, such as plate-based arrays (17–19), may introduce an additional level of potential variability between laboratories.
While the use of predefined algorithms can be helpful in pro-viding standardized definitions for response to vaccination, cau-tion must be used in adhering too rigidly to these criteria. This can be seen in several instances of this study. For example, most of the patients classified as nonresponders according to the threshold approach clearly showed substantial increases in the number of protective serotypes postvaccination, which demonstrates some
capacity for response to the specific vaccine (Fig. 2). Likewise,
many of the patients whose results were discordant between lab-oratories showed very similar overall patterns of response between the assays and differed only in a small percentage of the serotypes measured (i.e., 7 responsive serotypes versus 9). This further em-phasizes the need to apply guidelines in the full context of all findings, both laboratory and clinical, as stressed in a recent
con-sensus document (10). An important point is that this study
fo-cused solely on the use of pneumococcal vaccination as a method
FIG 4Response patterns in samples from patients with discordant results. Group designations refer to different patterns of response as shown in the heat map inFig. 3. A representative patient for each response pattern is shown. Each line represents the change between pre- and postvaccination levels for an individual serotype. Group A, responder by fold increase, nonresponder by threshold. These patients showed increases in most serotypes in all the laboratories but their levels failed to reach the 1.3-g/ml threshold in 9 serotypes. Group B, nonresponders by fold increase, mixed results by threshold. This group tended to have high prevaccination levels and showed little response postvaccination. Group C, nonresponders at 4-fold for lab B but responders under all other criteria and assays. The levels in these patients showed increases for most serotypes in all labs, but samples had a slightly lower response in lab B assays relative to those in the other laboratories.
Multiplex Pneumococcal IgG Interpretation
on August 17, 2020 by guest
http://cvi.asm.org/
for defining immune responsiveness in adults. The use of multi-plex assays for defining protective immunity, particularly in pedi-atric patients, was not addressed. The level of interlaboratory agreement in clinical classifications for those types of applications may differ because of the generally lower cut points used in those
algorithms (0.2 or 0.35g/ml) (20,21) and the differing levels of
immune responses in pediatric patients versus older adults. Fur-ther study in a pediatric population of samples is needed to ad-dress this issue.
Laboratories will always strive to maximize the analytical per-formance of the testing that they perform, but some level of inter-method variability is often unavoidable, particularly for complex assays. With the withdrawal of the Luminex xMAP Pneumo 14 IVD assay, the only options available to clinicians in the United States for pneumococcal testing are LDTs developed and validated by individual laboratories. The results of this study suggest that the impact of interlaboratory variability on determining responses to pneumococcal vaccination is relatively small when using paired samples, particularly under less-stringent response criteria. The presence of multiple measurements within the same sample al-lows one to assess the overall trend, minimizing the impact of analytical variability on any single measurement.
REFERENCES
1.Schauer U, Stemberg F, Rieger CH, Buttner W, Borte M, Schubert S, Mollers H, Riedel F, Herz U, Renz H, Herzog W. 2003. Levels of antibodies specific to tetanus toxoid,Haemophilus influenzaetype b, and pneumococcal capsular polysaccharide in healthy children and adults. Clin. Diagn. Lab. Immunol.10:202–207.http://dx.doi.org/10.1128/CDLI .10.2.202-207.2003.
2.Wernette CM, Frasch CE, Madore D, Carlone G, Goldblatt D, Plikaytis B, Benjamin W, Quataert SA, Hildreth S, Sikkema DJ, Kayhty H, Jonsdottir I, Nahm MH.2003. Enzyme-linked immunosorbent assay for quantitation of human antibodies to pneumococcal polysaccharides. Clin. Diagn. Lab. Immunol.10:514 –519.http://dx.doi.org/10.1128/CDLI.10.4 .514-519.2003.
3.Pickering JW, Martins TB, Greer RW, Schroder MC, Astill ME, Litwin CM, Hildreth SW, Hill HR.2002. A multiplexed fluorescent microsphere immunoassay for antibodies to pneumococcal capsular polysaccharides. Am. J. Clin. Pathol.117:589 –596.http://dx.doi.org /10.1309/LMCH-C4Q2-VFL9-3T1A.
4.Lin J, Kaltoft MS, Brandao AP, Echaniz-Aviles G, Brandileone MC, Hol-lingshead SK, Benjamin WH, Nahm MH.2006. Validation of a multiplex pneumococcal serotyping assay with clinical samples. J. Clin. Microbiol.44: 383–388.http://dx.doi.org/10.1128/JCM.44.2.383-388.2006.
5.Marchese RD, Puchalski D, Miller P, Antonello J, Hammond O, Green T, Rubinstein LJ, Caulfield MJ, Sikkema D.2009. Optimization and validation of a multiplex, electrochemiluminescence-based detection as-say for the quantitation of immunoglobulin G serotype-specific antipneu-mococcal antibodies in human serum. Clin. Vaccine Immunol.16:387– 396.http://dx.doi.org/10.1128/CVI.00415-08.
6.Paris K, Sorensen RU.2007. Assessment and clinical interpretation of polysaccharide antibody responses. Ann. Allergy Asthma Immunol.99: 462– 464.http://dx.doi.org/10.1016/S1081-1206(10)60572-8.
7.Landesman SH, Schiffman G.1981. Assessment of the antibody response to pneumococcal vaccine in high-risk populations. Rev. Infect. Dis. 3(Suppl):S184 –S197.
8.Hare ND, Smith BJ, Ballas ZK.2009. Antibody response to pneumococ-cal vaccination as a function of preimmunization titer. J. Allergy Clin. Immunol.123:195–200.http://dx.doi.org/10.1016/j.jaci.2008.09.021.
9.Beck SC.2013. Making sense of serotype-specific pneumococcal antibody measurements. Ann. Clin. Biochem. 50:517–519. http://dx.doi.org/10 .1177/0004563213500241.
10. Orange JS, Ballow M, Stiehm ER, Ballas ZK, Chinen J, De La Morena M, Kumararatne D, Harville TO, Hesterberg P, Koleilat M, McGhee S, Perez EE, Raasch J, Scherzer R, Schroeder H, Seroogy C, Huissoon A, Sorensen RU, Katial R.2012. Use and interpretation of diagnostic vacci-nation in primary immunodeficiency: a working group report of the Basic and Clinical Immunology Interest Section of the American Academy of Allergy, Asthma & Immunology. J. Allergy Clin. Immunol.130:S1–S24. http://dx.doi.org/10.1016/j.jaci.2012.07.002.
11. Tuerlinckx D, Florkin B, Ferster A, De Schutter I, Chantrain C, Hae-rynck F, Philippet P, Strengers P, Laub R.2014. Pneumococcal antibody levels in children with PID receiving immunoglobulin. Pediatrics133: e154 – e162.http://dx.doi.org/10.1542/peds.2013-1155.
12. Kamchaisatian W, Wanwatsuntikul W, Sleasman JW, Tangsinmankong N.2006. Validation of current joint American Academy of Allergy, Asthma & Immunology and American College of Allergy, Asthma and Immunology guidelines for antibody response to the 23-valent pneumo-coccal vaccine using a population of HIV-infected children. J. Allergy Clin. Immunol.118:1336 –1341.http://dx.doi.org/10.1016/j.jaci.2006.09.036. 13. Whaley MJ, Rose C, Martinez J, Laher G, Sammons DL, Smith JP,
Snawder JE, Borrow R, Biagini RE, Plikaytis B, Carlone GM, Romero-Steiner S.2010. Interlaboratory comparison of three multiplexed bead-based immunoassays for measuring serum antibodies to pneumococcal polysaccharides. Clin. Vaccine Immunol.17:862– 869.http://dx.doi.org /10.1128/CVI.00022-10.
14. Borgers H, Moens L, Picard C, Jeurissen A, Raes M, Sauer K, Proes-mans M, De Boeck K, Casanova JL, Meyts I, Bossuyt X.2010. Labora-tory diagnosis of specific antibody deficiency to pneumococcal capsular polysaccharide antigens by multiplexed bead assay. Clin. Immunol.134: 198 –205.http://dx.doi.org/10.1016/j.clim.2009.10.006.
15. Jeurissen A, Moens L, Raes M, Wuyts G, Willebrords L, Sauer K, Proesmans M, Ceuppens JL, De Boeck K, Bossuyt X.2007. Laboratory diagnosis of specific antibody deficiency to pneumococcal capsular poly-saccharide antigens. Clin. Chem.53:505–510.http://dx.doi.org/10.1373 /clinchem.2006.080051.
16. Zhang X, Simmerman K, Yen-Lieberman B, Daly TM.2013. Impact of analytical variability on clinical interpretation of multiplex pneumococcal serology assays. Clin. Vaccine Immunol.20:957–961.http://dx.doi.org/10 .1128/CVI.00223-13.
17. Goldblatt D, Ashton L, Zhang Y, Antonello J, Marchese RD. 2011. Comparison of a new multiplex binding assay versus the enzyme-linked immunosorbent assay for measurement of serotype-specific pneumococ-cal capsular polysaccharide IgG. Clin. Vaccine Immunol.18:1744 –1751. http://dx.doi.org/10.1128/CVI.05158-11.
18. Klein DL, Martinez JE, Hickey MH, Hassouna F, Zaman K, Steinhoff M.2012. Development and characterization of a multiplex bead-based immunoassay to quantify pneumococcal capsular polysaccharide-specific antibodies. Clin. Vaccine Immunol.19:1276 –1282.http://dx.doi.org/10 .1128/CVI.05535-11.
19. Pickering JW, Hoopes JD, Groll MC, Romero HK, Wall D, Sant H, Astill ME, Hill HR.2007. A 22-plex chemiluminescent microarray for pneumococcal antibodies. Am. J. Clin. Pathol.128:23–31.http://dx.doi .org/10.1309/781K5W6QH7JH2TMA.
20. Jodar L, Butler J, Carlone G, Dagan R, Goldblatt D, Kayhty H, Klug-man K, Plikaytis B, Siber G, Kohberger R, Chang I, Cherian T.2003. Serological criteria for evaluation and licensure of new pneumococcal conjugate vaccine formulations for use in infants. Vaccine21:3265–3272. http://dx.doi.org/10.1016/S0264-410X(03)00230-5.
21. Siber GR, Chang I, Baker S, Fernsten P, O’Brien KL, Santosham M, Klugman KP, Madhi SA, Paradiso P, Kohberger R.2007. Estimating the protective concentration of anti-pneumococcal capsular polysac-charide antibodies. Vaccine25:3816 –3826.http://dx.doi.org/10.1016 /j.vaccine.2007.01.119.