CLINICAL ANDVACCINEIMMUNOLOGY, June 2007, p. 775–781 Vol. 14, No. 6 1556-6811/07/$08.00⫹0 doi:10.1128/CVI.00043-07
Copyright © 2007, American Society for Microbiology. All Rights Reserved.
Evaluation of a Simplified Dual-Platform Flow Cytometric Method for
Measurement of Lymphocyte Subsets and T-Cell Maturation
Phenotypes in the Population of Nouna, Burkina Faso
䌤
T. Bo
¨hler,
1* M. von Au,
1N. Klose,
1K. Mu
¨ller,
1B. Coulibaly,
3F. Nauwelaers,
4H. P. Spengler,
4G. Kynast-Wolf,
2and H.-G. Kra
¨usslich
1Department of Virology1and Department of Tropical Medicine and Public Health,2Institute of Hygiene, University of Heidelberg,
Heidelberg, Germany; Nouna Health Research Centre, Nouna, Burkina Faso3; and BD Biosciences, Erembodegem, Belgium4
Received 21 January 2007/Returned for modification 1 March 2007/Accepted 22 March 2007
In the context of a larger clinical study in Nouna, Burkina Faso, we evaluated a simplified dual-platform (DP) flow cytometric (FCM) method that allows the determination of major lymphocyte subsets in a single test tube. We compared the phenotyping of lymphocytes with DP FCM and simultaneous measurements with standard single-platform (SP) FCM for samples from 177 individuals. Analysis of the comparative measure-ments revealed that DP FCM systematically underestimates the proportion of NK cells, overestimates the percentage of CD3ⴙCD8ⴙlymphocytes, and yields proportions of B cells and CD4ⴙT cells comparable with the results from SP FCM. Bland-Altman analysis showed a low bias between both methods and an acceptable precision for percent values of CD4ⴙT cells (biasⴞprecision,ⴚ1%ⴞ6%) and CD8ⴙT cells (ⴚ3%ⴞ6%). The absolute cell numbers of all lymphocyte subpopulations, however, were systematically biased towards lower values being obtained by DP FCM. Reference values for the distribution of T-cell maturation phenotypes in 177 healthy adults were calculated using DP FCM. The meanⴞstandard deviation (SD) CD4ⴙ-to-CD8ⴙT-cell ratio was 1.61ⴞ0.61, the mean percentageⴞSD of CD4ⴙT cells was 42%ⴞ7%, and that of CD8ⴙT cells 29%
ⴞ7%. Among CD4ⴙlymphocytes, 28%ⴞ7% were classified as central memory (CD45RAlow
CCR7ⴙ), 22%ⴞ 10% as naı¨ve (CD45RAhigh
CCR7ⴙ), 45%ⴞ12% as effector memory (CD45RAlow
CCR7ⴚ); and 5%ⴞ3% as terminally differentiated effector memory expressing CD45RA (CD45RAhigh
CCR7ⴚ). Among CD8bright
lym-phocytes, 3%ⴞ 2% had a central memory phenotype, 27%ⴞ 13% were naı¨ve, 37%ⴞ 13% had an effector memory phenotype, and 34%ⴞ12% were terminally differentiated effector memory cells expressing CD45RA.
In the years 2004 and 2005, a population-based study was performed in Nouna, Burkina Faso, in order to generate site- and gender-specific reference values for lymphocyte subsets in healthy adults in the context of an expanding program for prevention of mother-to-child transmission of human immunodeficiency virus type 1 (HIV-1) (17). During that study, single-platform (SP) flow cytometry (FCM) was used (9), a method which is not available to most labora-tories in developing countries due to its relatively high cost (7).
Since lymphocyte differentiation and counting by FCM is needed for immunological monitoring of antiretroviral treatment in resource-limited settings and immunological field studies on cohorts of young infants suffering from dis-eases other than infection with HIV-1 were planned in our research setting, we wanted to use an FCM test which allows the determination of the complete lymphocyte differential. The test should be reliably performed with low volumes of venous and capillary blood and should be resistant against preanalytic errors. It should be as inexpensive as possible and should be run on a simple flow cytometer equipped with only one laser.
In the present study, we evaluated such a simplified dual-platform (DP) FCM method for its clinical use in Nouna. The method allows the determination of (i) the relative distribution of lymphocyte subsets in peripheral blood in a single test tube (T1) using a mixture of fluorochrome-conjugated monoclonal antibodies on a standard three-color flow cytometer, and (ii) the calculation of absolute values by using lymphocyte num-bers obtained from a standard hematology analyzer. The re-sults of simultaneous measurements using DP and SP FCM were compared.
In addition, we generated reference values of T-cell matu-ration phenotypes for healthy adults living in Nouna, Burkina Faso, by using the linear differentiation model of CD4⫹and CD8⫹ T cells which is based on the expression of the long isoform of the common leukocyte antigen CD45RA and the chemokine receptor CCR7 (13). According to this model, CD45RAhigh CCR7⫹ naı¨ve T cells (T
naı¨ve) develop into
CD45RAlowCCR7⫹central memory cells (T
CM) upon
stimu-lation with their cognate antigen and may then switch to the CD45RAlow CCR7⫺ effector memory phenotype upon
re-stimulation. Infection with HIV-1 was shown to influence the distribution of these T-cell maturation phenotypes by increas-ing the percentage of terminally differentiated, CD45RAhigh
CCR7⫺ CD4⫹ T cells—a population which is very small in healthy individuals and has not been well characterized (1, 11). Data on the frequencies and absolute numbers of these T-cell subpopulations are not available for populations in sub-Saharan Africa.
* Corresponding author. Mailing address: c/o Department of Virol-ogy, University of Heidelberg, Im Neuenheimer Feld 324, D-69120 Heidelberg, Germany. Phone: 49-6221 565002. Fax: 49-6221 565003. E-mail: [email protected].
䌤Published ahead of print on 18 April 2007.
775
on August 17, 2020 by guest
http://cvi.asm.org/
MATERIALS AND METHODS
The study took place in northwestern Burkina Faso (West Africa) in the research zone of the Nouna Health Research Center (Centre de la Recherche en
Sante´ de Nouna [CRSN]). From July 2004 until September 2005, the CRSN
conducted a population-based clinical study (9), recruiting 364 individuals for the generation of immunohematological reference values in collaboration with the Centre Medical avec Antenne Chirurgicale (CMA) in Nouna, the Institute of Virology at the University of Heidelberg, Germany, and BD Biosciences Europe, Erembodegem, Belgium. The study was part of the ongoing longitudinal pre-vention of mother-to-child transmission trial in Nouna, which was approved by both the National Ethics Committee in Burkina Faso and the Institutional Ethics Committee of the University of Heidelberg, Germany. The inclusion of healthy adults for the purpose of generating laboratory reference values in the local population was additionally approved by the Institutional Ethics Committee at the Nouna Health Research Center.
In the study presented here, we evaluated a simplified DP FCM method which allows the simultaneous analysis of the major lymphocyte subpopulations in peripheral blood by the T1 method. Measurements using both SP FCM (10) and the simplified DP FCM method were performed for samples from 177 study participants. In addition, reference ranges for lymphocyte subpopulations and T-cell maturation phenotypes were calculated by using complete data sets from 177 healthy adults (68 males and 105 females). Eighteen percent of these indi-viduals were below 20 years of age, 49 percent were between 20 and 29 years of age, 16 percent were between 30 and 39 years of age, and 17 percent were at least 40 years of age.
Details of blood sample collection and serological testing are described else-where (9). All FCM measurements were performed on a three-color instrument (BD FACScan) generously provided by BD Biosciences. Standard SP FCM was done with BD MultiSET software, BD TruCount tubes, and BD TriTEST re-agents, as recommended by the manufacturer. Hematology testing with an au-tomated device (Sysmex KX21N; Sysmex Corporation, Kobe, Japan) was used to calculate the absolute cell numbers of lymphocyte subpopulations with DP FCM. Samples for the DP FCM test were prepared at climatized room temperatures (range 20 to 30°C) using a monoclonal antibody reagent mixture as recom-mended by the manufacturer (tube 1, CD8-fluorescein isothiocyanate [FITC],
CD19-FITC, CD56-phycoerythrin [PE], CD3-PE, and CD4-peridin-chlorophyll [PerCP]; tube 2, FITC, CCR7-PE, and CD4-PerCP; tube 3, CD45RA-FITC, CCR7-PE, and CD8-PerCP; and tube 4, immunoglobulin G [IgG] isotype control coupled to FITC, PE, and CD4-PerCP). In preparatory experiments on blood samples from healthy laboratory personnel in Heidelberg, CD8-FITC, CD19-FITC, CD56-PE, CD3-PE, and CD4-PerCP were used in combination with monoclonal antibodies coupled with allophycocyanine (APC) (CD14-APC, CD45-APC, or CD94-APC, respectively) in order to check for purity of the electronic gates and to further characterize lymphocyte subpopulations on a four-color flow cytometer (FACSCalibur; BD). Stained cells were kept in the dark at 2 to 8°C until acquisition on the flow cytometer; measurements were always performed within 12 h of staining.
For the subtyping of lymphocytes with the T1 method, at least 10,000 lympho-cytes were acquired by using a forward scatter (FSC)/side scatter (SSC) gate (Fig. 1A). For the determination of T-cell maturation phenotypes on the FACScan
flow cytometer, at least 2,500 lymphocytes expressing CD4⫹(Fig. 2A) or
lym-phocytes with a high expression of CD8 (Fig. 2C) were acquired by using an SSC/fluorescence (FL) channel FL-3 gating strategy. The list mode data were analyzed using CellQuest Pro software. In the T1 lymphocyte differential, the T-, B- and natural killer (NK)-lymphocyte subpopulations were identified due to differences in the fluorescence intensities of defined surface antigens and their typical combinations, as shown in Fig. 1A to D.
T-cell maturation phenotypes were defined by the differential expression of the long isoform of the common leukocyte antigen CD45RA and the C-C chemokine
receptor CCR7 as originally described by Sallusto et al. (13). CD4⫹lymphocytes
were identified as low SSC cells with a high FL-3 staining intensity (Fig. 2A) and analyzed in an FL-1 versus FL-2 dot plot (Fig. 2B) for the expression of CD45RA
and CCR7. In the CD8⫹T-cell subpopulation, maturation phenotypes were
determined only in cells expressing high levels of CD8 (CD8brightlymphocytes),
in order to exclude CD8⫹lymphocytes with intermediate and low CD8
expres-sion. Such cells comprise both NK cells and T cells with NK-like functions; they express only the long isoform of the CD45 antigen (CD45RA) and appear not to
participate in the dynamic maturation pathway seen in CD8brightlymphocytes,
which are nearly 100% T cells (18).
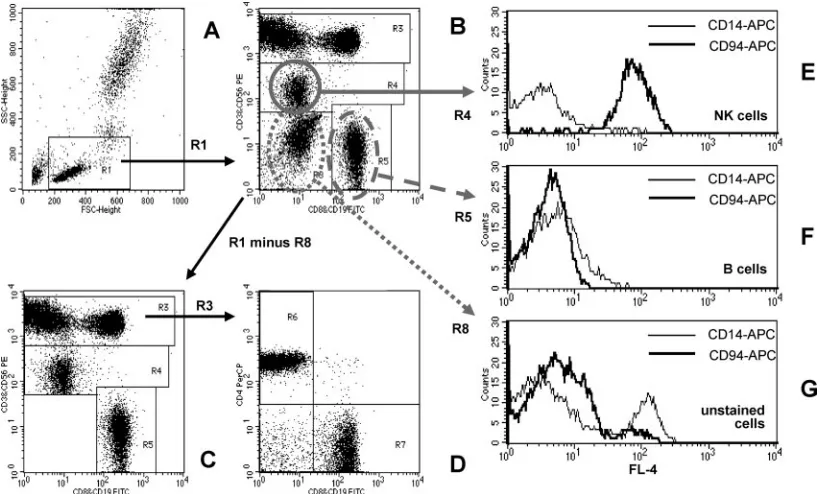
The markers for the discrimination of the T-lymphocyte maturation pheno-FIG. 1. Quantification of peripheral blood lymphocyte subsets by the T1 FCM method. (A) Lymphocytes are identified as low FSC and low SSC cells (region R1). Details of the gating strategy are described in the text. (B) Region R8 contains cells that did not stain with antibodies against CD3, CD8, CD56, or CD19. This cell population is excluded from analysis by defining the lymphocyte gate G1 for R1 and R2 (R2 includes R3 and R4 and R5 but not R8). (C and D) The dot plots for the final analysis are shown. (E and F) The purity of gating of NK and B cells is shown. (E) The NK cell gate (R1 and R4) contains mainly CD94⫹NK cells and very few CD14⫹monocytes. (F) Neither CD94⫹NK cells nor CD14⫹ monocytes are found in the B-cell gate (R1 and R5). (G) Cells that did not stain with antibodies against CD3, CD8, CD56, or CD19 include CD14⫹ monocytes, as well as CD56⫺CD94⫹NK cells.
776 BO¨ HLER ET AL. CLIN. VACCINEIMMUNOL.
on August 17, 2020 by guest
http://cvi.asm.org/
types were set using mouse IgG isotype control antibodies to define the boundary
between CCR7⫹and CCR7⫺cells. The boundary on the FL-1 axis was fixed at
100 arbitrary fluorescence units in order to clearly distinguish cells with high
expression of CD45RA (CD45RAhigh) from cells with low CD45RA staining
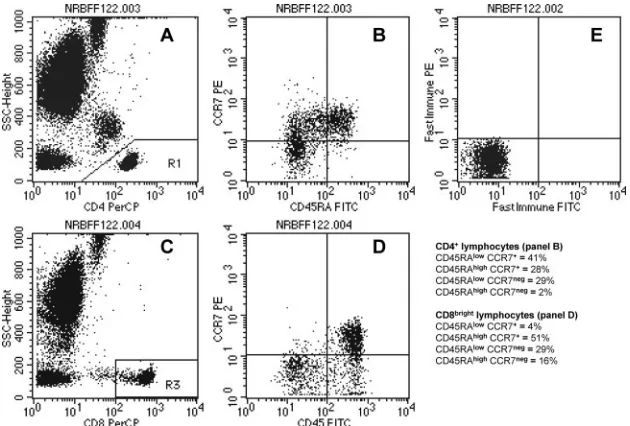
intensity. Thus, the upper right quadrant in Fig. 2B shows naı¨ve CD4⫹
lympho-cytes (CD45RAhighCCR7⫹), the upper left quadrant the central memory
sub-population (CD45RAlow
CCR7⫹), the lower left quadrant effector memory cells
(TEM) (CD45RAlowCCR7⫺), and the lower right quadrant terminally
differen-tiated effector memory cells expressing CD45RA (TEMRA) (CD45RA
high
CCR7⫺). CD8brightlymphocytes were identified as low SSC cells with a
fluores-cence intensity above 100 arbitrary units in the FL-3 channel (Fig. 2C) and analyzed as described before (Fig. 2D).
The calculation of reference ranges (5th and 95th percentiles and arithmetic means and standard deviations [SDs] of all parameters) was performed using SAS for Windows. The comparison of relative and absolute lymphocyte counts obtained by SP and DP FCM was done as described by Bland and Altman (4).
RESULTS
Strengths and weaknesses of the simplified DP FCM method.First, we studied potential limitations of the simplified T1 DP FCM method in blood samples from healthy laboratory personnel by using a four-color flow cytometer (FACSCalibur) in Heidelberg. Figure 1 shows the typical result of such an experiment. An electronic gate (G1; region R1) set on the cell population with low FSC and low SSC characteristics was used to identify peripheral blood lymphocytes (Fig. 1A). The ex-pression of different surface antigens, simultaneously stained with different fluorescence-labeled monoclonal antibodies and analyzed in an FL-1 versus FL-2 dot plot (Fig. 1B), allowed the separation of CD19⫹B cells as events with high FL-1 (FITC) signal intensity from CD3⫹T cells exhibiting high FL-2 (PE)
signal intensity (Fig. 1B and C, regions R5 and R3, respec-tively). NK cells were identified as CD56⫹ cells with lower FL-2 intensity than CD3⫹T cells (region R4 in Fig. 1B and C). Region R8 in Fig. 1B contains cells that did not stain with antibodies against CD3, CD8, CD56, or CD19. This cell pop-ulation was excluded from analysis by electronic gating (region R2 in Fig. 1B). The dot plot used for the final analysis is shown in Fig. 1C. CD3⫹T cells were further separated into CD4⫹and CD8⫹subpopulations in an FL-3 (PerCP) versus FL-1 (FITC) dot plot (Fig. 1D: CD4⫹ T cells, region R6; CD8⫹ T cells, region R7). As shown in the histogram in Fig. 1E, nearly all NK cells identified as CD56⫹ lymphocytes were positive for the NK cell marker CD94; the electronic gate (G4; R1 and R4) contained only very few CD14⫹monocytes. Contamination of the B-cell gate (G5; R1 and R5) by CD14⫹ monocytes or CD94⫹NK cells was also minimal (Fig. 1F). Thus, the gate purity for the detection of NK cells and B cells was high. However, the use of CD56 as the only NK cell marker led to the loss of specific NK cell subsets from analysis. As shown in Fig. 1G, unstained cells in region R8 comprised both CD14⫹ monocytes and CD94⫹NK cells (electronic gate G8; region R1 and region R8).
When unlysed erythrocytes were added to the measurement tubes, these erythrocytes appeared in the lower left part of region R8; they could be electronically excluded and did not disturb the analysis of the lymphocyte subpopulations (data not shown). The results of the lymphocyte subset analysis were also not influenced by increasing numbers of unstained cells in the test tube (data not shown). Thus, the T1 FCM method in
FIG. 2. T-lymphocyte maturation phenotypes. (A) CD4⫹lymphocytes are identified as low SSC cells with a high staining intensity in the FL-3 channel (CD4 PerCP). (B) At least 2,500 events in the CD4⫹lymphocyte gate were analyzed for the expression of CD45RA and CCR7: upper right, naı¨ve (CD45RAhighCCR7⫹), upper left, central memory (CD45RAlowCCR7⫹), lower left, effector memory (CD45RAlowCCR7⫺), and
lower right, terminally differentiated effector memory expressing CD45RA (CD45RAhighCCR7⫺); a typical distribution pattern is displayed.
(C) CD8brightlymphocytes were identified as low SSC cells with a fluorescence intensity above 100 arbitrary units in the FL-3 channel (CD8 PerCP). (D) At least 2,500 events in the CD8brightlymphocyte gate were analyzed for the expression of CD45RA and CCR7; a typical distribution pattern is displayed. (E) Markers for the discrimination of T lymphocyte maturation phenotypes were set using a highly purified mouse IgG isotype control to define the boundary between CCR7⫹(upper left and upper right quadrants in panels B, D, and E) and CCR7⫺(lower left and lower right quadrants). The boundary on the FL-1 axis was fixed at 100 arbitrary fluorescence units in order to identify cells with high CD45RA staining intensities (upper right and lower right quadrants). The quadrant statistics yield the percentages of the T-cell maturation phenotypes for CD4⫹ (B) and CD8bright(D) lymphocytes.
VOL. 14, 2007 SIMPLIFIED DUAL-PLATFORM LYMPHOCYTE FLOW CYTOMETRY 777
on August 17, 2020 by guest
http://cvi.asm.org/
combination with the electronic gating procedure described here was resistant against typical preanalytic confounders of clinical FCM. The intraindividual coefficients of variation in the distribution of lymphocyte subsets were as follows: 3% CD3⫹T cells, 4% CD4⫹T cells, 4% CD8⫹T cells, 7% CD19⫹ B cells, and 13% CD56⫹NK cells (average results of up to 10 measurements on consecutive days in samples from five healthy individuals).
Methodological comparison of DP and SP FCM. We then applied the simplified DP FCM method in a field study of blood samples from 177 healthy adults in Burkina Faso and observed the following distribution of the lymphocyte differ-ential (mean⫾SD): CD3⫹T cells represented the most abun-dant subpopulation (77% ⫾ 8%), followed by CD19⫹ B cells (13%⫾ 5%) and CD56⫹NK cells (10%⫾6%). The mean CD4⫹-to-CD8⫹T-cell ratio was 1.61 ⫾ 0.61, the mean fre-quency of CD4⫹T cells 42%⫾7%, and that of CD8⫹T cells 29%⫾7%. The absolute number of CD3⫹T cells was 1,799⫾ 537l⫺1, of CD19⫹B cells 316⫾168l⫺1, and of CD56⫹NK
cells 238⫾186l⫺1. The mean CD4⫹T-cell counts were 980 ⫾293l⫺1and the mean CD8⫹T-cell counts were 676⫾300 l⫺1.
In order to examine whether the DP FCM method and the
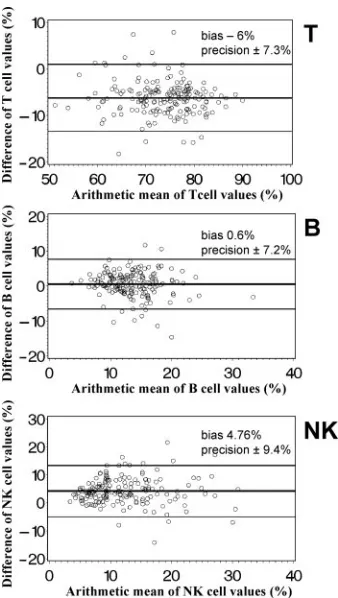
standard SP FCM method agreed sufficiently to be regarded as interchangeable, we analyzed data on simultaneous measure-ments with both methods according to Bland and Altman (4). Both the simplified DP FCM method and the standard SP FCM method gave nearly identical percentages of B cells, while percentages of T cells were higher by DP FCM than by SP FCM and percentages of NK cells were lower (Fig. 3). The absolute numbers of these lymphocyte subpopulations (Fig. 4) were higher if measured by SP FCM than by DP FCM. The bias for T cells was about 10% of the average T-cell number, for B cells about 20% of the average B-cell number, and for NK cells about 50% of the average NK cell number. Thus, the mean bias of absolute cell numbers of these lymphocyte sub-populations was clinically relevant.
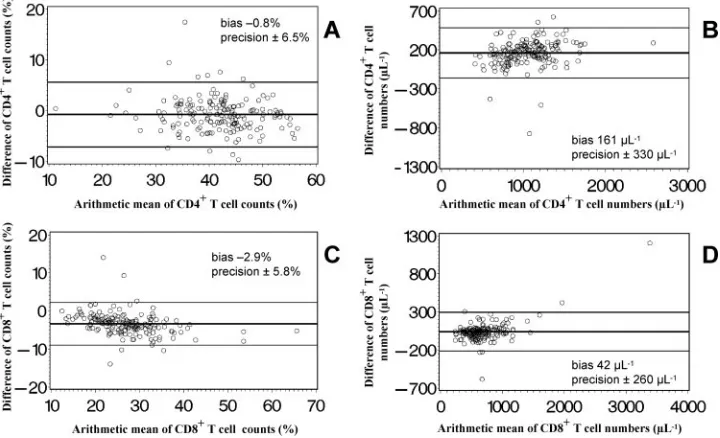
Figure 5 illustrates the comparison between the percent values and absolute numbers of CD4⫹T cells (Fig. 5A and B) and CD8⫹ T cells (Fig. 5C and D) generated with the two FCM methods. Bland-Altman analysis indicates that both methods gave nearly identical percentages of CD4⫹ T cells, while the percentages of CD8⫹T cells were higher if measured by DP FCM. The absolute numbers of both T-cell
subpopula-FIG. 3. Bland-Altman diagrams (4) of the relative distribution of T-, B- and NK-lymphocyte subpopulations determined by an SP no-wash FCM method (MultiSET) and a simplified T1, DP lyse-and-wash method. The arithmetic mean of the lymphocyte percentages (SP FCM plus DP FCM/2) is displayed on thexaxis, and the difference of the lymphocyte percentages (SP FCM minus DP FCM) on theyaxis. The horizontal lines indicate the mean difference (bias)⫾2 SD (pre-cision) of simultaneous measurements with both methods of samples from 177 adults.
FIG. 4. Bland-Altman diagrams (4) of absolute counts of T-, B-and NK-lymphocyte subpopulations determined by a single-platform no-wash FCM method (MultiSET) and a simplified T1, DP lyse-and-wash FCM method. The arithmetic mean of the absolute cell counts (SP FCM plus DP FCM/2) is displayed on thexaxis, and the difference of the absolute cell counts (SP FCM minus DP FCM) on the
yaxis. The horizontal lines indicate the mean difference (bias)⫾2 SD (precision) of simultaneous measurements with both methods of sam-ples from 177 adults.
778 BO¨ HLER ET AL. CLIN. VACCINEIMMUNOL.
on August 17, 2020 by guest
http://cvi.asm.org/
tions measured by SP FCM were higher than those obtained with DP FCM. A comparison of the percent values showed a low bias with an acceptable precision for both CD4⫹ and CD8⫹T cells. The bias in terms of absolute cell numbers was approximately 15% of the average cell number in CD4⫹T cells and approximately 5% of the average cell number in CD8⫹T cells, thus being clinically relevant.
Reference values for T-cell maturation phenotypes.The ref-erence values of the relative distribution (percentages and absolute numbers) of T-lymphocyte maturation phenotypes obtained from 177 healthy adults living in Nouna, Burkina Faso, are shown in Table 1. The characteristic differences be-tween CD4⫹and CD8brightlymphocytes are also illustrated, in
Fig. 2.
DISCUSSION
We developed a DP FCM method that allows (i) phenotyp-ing of major lymphocyte subsets by the T1 FCM method and (ii) quantification of lymphocyte subsets by simultaneous de-termination of lymphocyte numbers with an automated hema-tology counter. Preparatory experiments and analysis of the comparative measurements between simplified DP and stan-dard SP FCM revealed that DP FCM systematically underes-timated the percentage of NK cells, probably because these cells are not completely identified by the exclusive use of CD56 as the sole NK cell marker. It has been shown that human NK cells follow a maturational pathway leading from CD16⫹ CD56⫺precursor cells to mature CD16⫹CD56⫹and CD16⫺ CD56⫹NK cells (5). NK precursor cells are not detected in the T1 assay. Thus, the use of this assay does not permit the quantification of specific subpopulations, such as NK cell
pre-cursors, and is limited to screening for a skewed distribution of major subtypes of lymphocytes.
Additionally, the CD56brightNK cell subset (2) may appear
in the T-cell region of the T1 analysis, thereby decreasing the percentage of NK cells and concomitantly increasing the per-centage of CD3⫹and potentially also of CD8⫹T cells. These subpopulations were slightly overestimated by DP FCM in comparison to the results of SP FCM, whereas similar propor-tions of B cells and of CD4⫹T cells were detected with both methods.
Despite these shortcomings, the T1 FCM method seems to be suitable for immunological field studies in developing coun-tries. Miniaturization of the assay allows the measurement to be performed in samples of 25l of blood at a price of less than $3. It can be reliably performed by skilled laboratory personnel after a short training even on very low volumes of capillary blood from newborn infants (M. von Au, unpublished results), and it is suitable for immunological screening during infectious diseases (or after vaccinations) even in infants suf-fering from malnutrition, which may influence the distribution of lymphocyte subpopulations other than CD4⫹T-cells. Sev-eral inexpensive methods have been developed for CD4⫹ T-cell counting in developing countries; however, these as-says usually do not yield the complete lymphocyte differen-tial count (7).
An FCM method similar to the T1 protocol (lymphogram) was published by Bellido et al. (3). No systematic comparison of the lymphogram method and standard FCM was performed on a larger patient cohort or on samples from healthy controls. Giustolisi et al. (6) compared lymphogram measurements to the results of standard multicolor FCM of lymphocyte samples from patients with suspected leukemia and stated that the
FIG. 5. Bland-Altman diagrams (4) of the relative distribution and absolute cell counts of CD4⫹and CD8⫹T lymphocyte subpopulations determined by an SP lyse-no-wash FCM method (MultiSET) and a simplified T1, DP lyse-and-wash FCM method. The arithmetic mean of the lymphocyte percentages or absolute cell counts (SP FCM plus DP FCM/2) is displayed on thexaxis, and the difference of the lymphocyte percentages or absolute cell counts (SP FCM minus DP FCM) on theyaxis. The horizontal lines show the mean difference (bias)⫾2 SD (precision) of simultaneous measurements with both methods of samples from 177 adults.
VOL. 14, 2007 SIMPLIFIED DUAL-PLATFORM LYMPHOCYTE FLOW CYTOMETRY 779
on August 17, 2020 by guest
http://cvi.asm.org/
results “showed no major discordance.” No calculation of the absolute numbers of T, B, and NK cells was attempted.
In our study, we compared not only percentages of lympho-cyte subpopulations, but also absolute cell numbers, and found a significant systematic bias, showing that SP FCM constantly yielded higher absolute cell counts than DP FCM. This sys-tematic bias had already been described by Nicholson et al. (10), who found higher absolute cell counts (increased by 5 to 10%) with SP FCM using MultiSET/TruCount methodology than with conventional DP FCM (SimulSET and automated hematology). In our cohort in Nouna, Burkina Faso, the ab-solute CD4⫹ T-cell counts obtained with SP FCM were ap-proximately 200 cellsl⫺1 higher than absolute CD4⫹T-cell
counts obtained with DP FCM (calculated by multiplication of the MultiSET data by percentage of CD4⫹ T cells and the lymphocyte number simultaneously measured with the Sysmex hematology analyzer) (9). Thus, the observed bias between DP FCM and SP FCM corresponds to values reported in the literature.
In the second part of our study, we used a panel of mono-clonal antibodies in addition to the T1 DP FCM method in order to assess the relative distribution of naı¨ve and memory subpopulations of peripheral blood T cells. To our knowledge, this is the first description of T-cell maturation phenotypes in a larger cohort of West African healthy adults which is based upon the expression patterns of CD45RA and CCR7. Among CD4⫹lymphocytes, such expression patterns have been previ-ously described for eight healthy controls in the United States (1). In that study, 28%⫾2% (mean⫾standard error of the mean) of CD4⫹T cells were Tnaı¨ve(CD45RA⫹CCR7⫹), 59%
⫾2% were TCM(CD45RA⫺CCR7⫹), 11%⫾1% were TEM
(CD45RA⫺CCR7⫺), and 2%⫾1% were TEMRA(CD45RA⫹
CCR7⫺). In another study (11), results for CD4⫹T cells from 11 healthy adult volunteers in the United States were reported (median and range): 35% (20 to 50%) of cells were Tnaı¨ve, 49%
(15 to 70%) were TCM, 12% (2 to 27%) were TEM, and 2% (0
to 22%) were TEMRA.
When the theoretical model of CD4⫹and CD8⫹ effector and memory T-cell generation was first described (12, 16), the authors made the cautionary comment that the markers used for the discrimination of these T-cell subpopulations are rap-idly and transiently modulated upon cell activation and the phenotypic characterization applies only to resting cells, i.e., those that are not engaged in an antigen-driven response (12). Especially for the CD8⫹ T-cell compartment, it has been shown that both the effector memory and the central memory subsets contain populations at intermediate stages of differen-tiation which may develop into both directions of the differ-entiation pathway (15). The method used in our study is more reliable in the CD4⫹ than in the CD8⫹ T-cell subset. We focused our study on CD8bright T cells because these cells
represent the major CD8⫹T-cell subpopulation (⬎95%). We explicitly excluded CD8dimlymphocytes (representing mainly
NK cells and NK T cells) from the analysis of maturation phenotypes by electronic gating. Both CD8dimNK cells and
CD8dim T cells express high levels of CD45RA, and their
inclusion leads to falsely elevated proportions of the naı¨ve subpopulation. Our gating strategy allows us to exclude these cells (which seem not to participate in the dynamic maturation process of the major CD4⫹and CD8⫹T-cell subpopulations)
TABLE 1. Reference values of CD4 ⫹ and CD8 bright lymphocyte subpopulations obtained from healthy adults in Burkina Faso a Lymphocyte subset Central memory T cells Tnaı ¨v e TEM TEMRA % l ⫺ 1 % l ⫺ 1 % l ⫺ 1 % l ⫺ 1 CD4 ⫹ 28 ⫾ 7 (18–40) 277 ⫾ 104 (126–478) 22 ⫾ 10 (5–41) 228 ⫾ 146 (35–496) 45 ⫾ 12 (26–65) 429 ⫾ 147 (230–686) 5 ⫾ 3 (1–11) 45 ⫾ 36 (8–110) CD8 bright 3 ⫾ 2 (1–5) 16 ⫾ 11 (4–34) 27 ⫾ 13 (7–52) 173 ⫾ 103 (36–363) 37 ⫾ 13 (17–61) 255 ⫾ 188 (88–576) 34 ⫾ 12 (16–55) 232 ⫾ 135 (71–498) aRelative (%) and absolute ( l ⫺ 1) counts of lymphocyte subpopulations from 177 healthy adults (109 female, 68 male) given as the means ⫾ SDs with the lower and upper limits of normal (i.e., 5th and 95th percentiles) shown in parentheses.
780 BO¨ HLER ET AL. CLIN. VACCINEIMMUNOL.
on August 17, 2020 by guest
http://cvi.asm.org/
despite the use of a flow cytometer equipped with only a single laser.
Recently, Saule et al. (14) obtained data on the relative distribution of naı¨ve and memory subpopulations of CD4⫹and CD8⫹ T cells in 101 healthy blood donors in France and showed changes in the distribution patterns with advancing age of the donors. When comparing our data with those of Saule et al. (14) for the age range of 20 to 40 years (65% of the Nouna donors were in that age range), the median percentage of Tnaı¨vein West African donors was only half of that in European
donors, while TEM were nearly twice as numerous (CD4⫹
Tnaı¨ve, 22% versus 50%; TEM, 44% versus 19%; CD8⫹Tnaı¨ve,
26% versus 49%; TEM, 36% versus 17%). In terms of absolute
cell numbers, these differences were also impressive (CD4⫹ Tnaı¨ve, 204 versus 357 cells l⫺1; TEM, 405 versus 136 cells
l⫺1; CD8⫹T
naı¨ve, 151 versus 190 cellsl⫺ 1; T
EM, 215 versus
72 cellsl⫺1) (14). CD4⫹T cells from European donors of
ages above 75 years were 34% Tnaı¨ve(216 cellsl⫺
1) and 24%
TEM(156 cellsl⫺1), and CD8⫹T cells were 12% Tnaı¨ve(49
cellsl⫺1) and 27% T
EM(84 cellsl⫺ 1) (14).
In a study on healthy adults from Wonji, Ethiopia (8), T-cell maturation phenotypes were defined by differential expression of CD45RA and CD27 and the following distribution patterns were observed (median and range): among CD4⫹T cells, 20% (5 to 47%) were naı¨ve (CD45RA⫹CD27⫹), 53% (40 to 66%) had a memory phenotype (CD45RA⫺ CD27⫹), 21% (9 to 45%) showed an effector memory phenotype (CD45RA⫺ CD27⫺), and 1% (0 to 5%) were cytotoxic effector cells (CD45RA⫹CD27⫺). Among CD8⫹T cells, 29% (5 to 60%) were naı¨ve (CD45RA⫹CD27⫹), 21% (6 to 48%) had a mem-ory phenotype (CD45RA⫺CD27⫹), 9% (2 to 53%) showed an effector memory phenotype (CD45RA⫺CD27⫺), and 34% (8 to 78%) were cytotoxic effector cells (CD45RA⫹ CD27⫺). Compared to healthy controls from Amsterdam, The Nether-lands, HIV-negative Ethiopians had significantly reduced naı¨ve and increased effector subsets in both the CD4⫹and CD8⫹ T-cell compartments and increased cytotoxic effector cells in the CD8⫹T-cell compartment.
In summary, data from Burkina Faso (our study) and Ethi-opia (8) indicate substantial T-cell activation in African adults compared to that in people living in France (14). The dis-tribution pattern of T-cell maturation phenotypes may be a surrogate parameter for environmentally driven immuno-senescence. Even compared to Europeans with a chronolog-ical age above 75 years, young West Africans showed a skewed distribution of T-cell maturation phenotypes, with higher numbers of TEMand lower numbers of CD4⫹Tnaı¨ve.
REFERENCES
1.Alexander, T. H., G. M. Ortiz, M. F. Wellons, A. Allen, E. J. Grace, B. Schweighardt, J. Brancato, J. K. Sandberg, S. N. Furlan, G. D. Miralles, D. F. Nixon, and J. A. Bartlett.2003. Changes in CD4⫹T-cell differentiation phenotype during structured treatment interruption in patients with chronic
HIV-1 infection. J. Acquir. Immune Defic. Syndr.34:475–481.
2.Batoni, G., S. Esin, F. Favilli, M. Pardini, D. Bottai, G. Maisetta, W. Florio, and M. Campa.2005. Human CD56bright and CD56dim natural killer cell subsets respond differentially to direct stimulation with Mycobacterium bovis
bacillus Calmette-Guerin. Scand. J. Immunol.62:498–506.
3.Bellido, M., E. Rubiol, J. Ubeda, C. Estivill, O. Lopez, R. Manteiga, and J. F. Nomdedeu.1998. Rapid and simple immunophenotypic characterization of
lymphocytes using a new test. Haematologica83:681–685.
4.Bland, J. M., and D. G. Altman. 1986. Statistical methods for assessing
agreement between two methods of clinical measurement. Lanceti(8476):
307–310.
5.Gaddy, J., and H. E. Broxmeyer.1997. Cord blood CD16⫹56⫺cells with low lytic activity are possible precursors of mature natural killer cells. Cell.
Immunol.180:132–142.
6.Giustolisi, G. M., A. M. Gruszka-Westwood, R. M. Morilla, and E. Matutes.
2001. Lymphogram: a rapid flow cytometry method for screening patients
with lymphocytosis. Haematologica86:1223–1224.
7.Janossy, G., I. V. Jani, N. J. Bradley, A. Bikoue, T. Pitfield, and D. K. Glencross.
2002. Affordable CD4(⫹)-T-cell counting by flow cytometry: CD45 gating for
volumetric analysis. Clin. Diagn. Lab. Immunol.9:1085–1094.
8.Kassu, A., A. Tsegaye, B. Petros, D. Wolday, E. Hailu, T. Tilahun, B. Hailu, M. T. Roos, A. L. Fontanet, D. Hamann, and T. F. De Wit.2001. Distribution of lymphocyte subsets in healthy human immunodeficiency virus-negative adult Ethiopians from two geographic locales. Clin. Diagn. Lab. Immunol.
8:1171–1176.
9.Klose, N., B. Coulibaly, D. M. Tebit, F. Nauwelaers, H. P. Spengler, G. Kynast-Wolf, B. Kouyate´, H.-G. Kra¨usslich, and T. Bo¨hler.2007. Immuno-hematological reference values for healthy adults in Burkina Faso. Clin.
Vaccine Immunol.6:782–784.
10.Nicholson, J. K., D. Stein, T. Mui, R. Mack, M. Hubbard, and T. Denny.
1997. Evaluation of a method for counting absolute numbers of cells with a
flow cytometer. Clin. Diagn. Lab. Immunol.4:309–313.
11.Palmer, B. E., E. Boritz, and C. C. Wilson.2004. Effects of sustained HIV-1
plasma viremia on HIV-1 Gag-specific CD4⫹T cell maturation and
func-tion. J. Immunol.172:3337–3347.
12.Sallusto, F., J. Geginat, and A. Lanzavecchia.2004. Central memory and effector memory T cell subsets: function, generation, and maintenance.
Annu. Rev. Immunol.22:745–763.
13.Sallusto, F., D. Lenig, R. Forster, M. Lipp, and A. Lanzavecchia.1999. Two subsets of memory T lymphocytes with distinct homing potentials and
effec-tor functions. Nature401:708–712.
14.Saule, P., J. Trauet, V. Dutriez, V. Lekeux, J. P. Dessaint, and M. Labalette.
2006. Accumulation of memory T cells from childhood to old age: central
and effector memory cells in CD4(⫹) versus effector memory and terminally
differentiated memory cells in CD8(⫹) compartment. Mech. Ageing Dev.
127:274–281.
15.Schwendemann, J., C. Choi, V. Schirrmacher, and P. Beckhove.2005.
Dynamic differentiation of activated human peripheral blood CD8⫹and
CD4⫹effector memory T cells. J. Immunol.175:1433–1439.
16.Seder, R. A., and R. Ahmed.2003. Similarities and differences in CD4⫹and
CD8⫹effector and memory T cell generation. Nat. Immunol.4:835–842.
17.Tebit, D. M., J. Ganame, K. Sathiandee, Y. Nagabila, B. Coulibaly, and H. G. Krausslich.2006. Diversity of HIV in rural Burkina Faso. J. Acquir. Immune
Defic. Syndr.43:144–152.
18.Winkelstein, A., and A. D. Donnenberg.1997. Clinical applications of FCM,
p. 381–476.InM. S. Leffell, A. D. Donnenberg, and N. R. Rose (ed.),
Handbook of human immunology. CRC Press, Boca Raton, FL.
VOL. 14, 2007 SIMPLIFIED DUAL-PLATFORM LYMPHOCYTE FLOW CYTOMETRY 781