AND EGG WEIGHT IN CHICKENS
MICHAEL F. FESTING A N D A. W. NORDSKOG Department of Poultry Science, Iowa State University, Ames 50010
Received August 25, 1966
W E L L
conducted selection experiments are useful in testing the validity of modern selection theory. Observed genetic changes from selection fre- quently show poor agreement with expectation. The relationship of selection to the genetic variance composition of a population, to correlated responses, to plateaued populations and to selection limits are problems not yet well understood. This study reports the resul-s of a %way selection experiment for both body weight and egg weight in White Leghorns. Body weight is highly responsive to selection in chickens ( SIEGEL 1962a; MALONEY, GILBREATH and MORRISON 1963) and in turkeys ( ABPLANALP, OGASAWARA, and ASMUNDSON 1963) but evidently not in Cotournix quail (COLLINS and ABPLANALP 1965). Egg weight is also highly heritable in chickens (OLSON and KNOX 1940; SNYDER 1945; SHULTZ 1953) and is correlated with body weight (SIEGEL 1963a, b; MALONEY et al. 1963; SHULTZ 1953).Although correlated responses in reproductive traits are of special interest to us in our over-all selection experiment, we will report on that separately. This report is confined to changes in body weight and egg weight over 7 years from 2-way selection f o r each of these traits. Changes in genetic parameter estimates over generations are also given. As experimental checks, both a randombred control line and a companion line of common origin, but selected exclusively for high egg production, are included. NORDSKOG and FESTING (1962) gave a preliminary report of the first 4 years of the experiment.
MATERIALS A N D METHODS
The base population was derived from reciprocal crosses between four commercial Leghorn strains in 1956. Table 1 specifies the lines originating from the base population and the random- bred control population. In the body weight lines, B and C, both sires and dams were selected on their own phenotypes. In the egg weight lines, D and E, the sires were selected on their full sister records.
Line A, selected for high rate of egg production, is included in the study as a supplementary “quasi-control” line. I t has the same origin as the other selection lines and has responded little, if any, to selection for high rate of egg production (NORDSROG, FESTING and WWRLI VERCHESE 1967). Because of limited population number the inbreeding per generation, estimated from F = 1 / ( 8 N , ) f 1 / ( 8 N j ) (WRIGHT 194.0) was about 1.6% in each line except Line A, where F was about 1 % per generation. In the formula, N , and N, are the number of males and females
Journal Paper No. J.-5476 of the Iowa Agricultural and Home Economics Experiment Station, Ames, Iowa, Project No. 132ti, in cooperation with the North Central Regional Poultry Breeding Project NC-47.
220 M. F. FESTING A N D A. W. NORDSKOG
TABLE 1
White Leghorn selection and control populations
Line Year started Selected for:
Number of breeders
Male Femaledinale
A O(1956) High egg production
c%
B O(1956) High 32 week body weight (W) C 0 ( 1956) Low 32 week body weight
(6)
D O( 1956) High 32 week egg weight(2)
E 0 ( 1956) Low 32 week egg weight(i)
RCC 2( 1958) Randombred
16 9-14
8 8-10 8 8-10
9 8-10
8 8-10 50' 5'
* Maintained at the North Central Regional Laboratory, Purdue University
having progeny selected as breeders in the following generation. Because full-sib and half-sib matings were avoided the amount of inbreeding would be less than estimated from the formula. Not all birds had complete records for the December and March body weights and egg weights. For this reason, the number of records per trait varied typically (except for Line A) from 150 to 200 per line (Table 2). All records available were included in the study in order to avoid a possible bias from selectivity. Because Line A was carried in more breeding pens and was more highly reproductive than the other lines, the number of records were generally three or four times larger.
Chicks were produced from three hatches between January and March. They were reared intermingled under infrared brooders and a t 8 weeks of age were transferred to a summer range. After the third generation the lines were quartered separately, more or less according to body size. At 20 to 24 weeks of age the birds were housed in pens of 200 to 400 birds each with control birds in each pen.
Hatching eggs from the Regional Cornel1 Leghorn Control strain (KING, CARSON and DOO-
LITTLE 1959; KING, VAN VLECK and DOOLITRE 1963) produced by the North Central Regional
Poultry Breeding Laboratory, Lafayette, Indiana, were shipped to Ames each year.
Eggs were collected for weighing over a 4-day trapnest period in December and March. Hence, the number of weighed eggs per pullet varied from 0 to 4.
Notation, definitions and statistical procedure: The traits are body weight (W) and egg weight (Z) as shown in Table 1. Lines selected upwards are indicated with a hat ( A ) and lines
selected downwards with an inverted hat ( " ). The March records are primed ( W and Z ) to distinguish them from the December records.
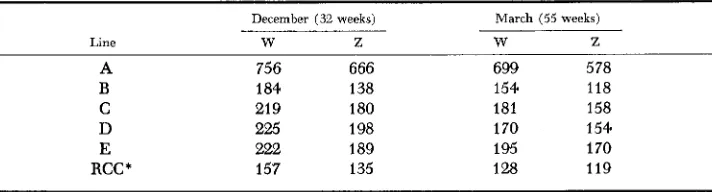
TABLE 2
Mean number of body weight (W) and egg weight (Z) records per generation
December (32 weeks)
Line W Z
March (55 weeks)
w Z
A 756 666
B 184 138
C 219 180
D 225 198
E 222 189
RCC * 157 135
699 5 78
154 118
181 158
170 154
195 170
128 119
In accordance with FALCONER (1960), we define a primary trait as the criterion on which selection is made. Any other trait is a secondary trait. Direct responses to selection in the B and C lines are DR(W) and DR(W) and in the D and E lines are D R ( 2 ) and (DR(5). The corre- lated response, for example, in trait Z from selection on W in the B line, is represented by CR(Z.W). The refression of the response on generation number is the estimator of the realized response per generation to selection. The linear regression of the response on the cumulative se- lection differential per generation is the estimator of the “realized” heritability.
The letter E in place of R in the above notation designates the expected response from selec- tion estimated from population parameter estimates. Thus, for December body weight, DE(W) =
h2,&,,,, where
h Z m = heritability of W estimated from the population. 8 = selection differential in standard deviation units. ut” = phenotypic standard deviation of W.
In general, for any amount of selection applied, 6, we are interested in, for example, how well DE(W) predicts DR(W). Likewise for a correlated response, we are interested in, say, how well CE(Z.W) predicts CR(Z.W).
Most of the data were examined on both the arithmetic and logarithmic scales with the re- sults on either scale leading to essentially the same conclusions. Only the analyses using the arithmetic scale are presented here.
The selection differentials were calculated as a simple average of the difference between the mean of the population and the mean of the selected parents for each sex of the body weight lines and for females of the egg weight lines. The selection differentials for males of the egg weight lines were estimated from the weighted deviation of their sister’s mean egg weight from where n is the number of full sisters in a the line mean. The weighting factor was k =
sire’s family and t = .3 is the assumed phenotypic correlation between full sisters. It can be (1/2)n
1
+
( n - l ) tshown that k is, in fact, the regression of the sire’s genotype on the mean of his n sisters’ pheno- type and hence k is the appropriate correction for the variable number of sisters per family.
Heritabilities and genetic correlations were estimated from an hierarchial analysis of variance within lines and years using twice the fraction of sire and dam variance as the estimate (FAL- CONER 1960). Although such an estimate is inflated by various unknown amounts of non-additive, sex-linked and maternal effects (KEMPTHORNE 1957), its sampling error is only half as large as that from heritability estimated separately from the sire or dam component.
RESULTS
Setection intensity: The selection intensity varied from about one half to one third of all the records. The total selection applied in cumulative standard devia- tion unils (Table 3 ) was greater in the body weight lines than in the egg weight
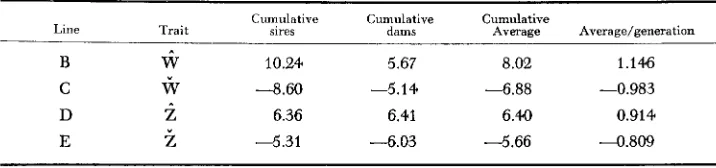
TABLE 3
Cumulatiue selection differentials in standard deviation units ouer seuen generations of selection
Cumulative Cumulative Cumulative
Line Trait sires dams Average Average/generation
B
iJ
10.24 5.67 8.02 1.146C
w
-8.60 -5.14 -6.88 -0.983D
z
6.36 6.41 6.4.0 0.914222 M. F. F E S T I N G A N D A. W. NORDSKOG
1
VI 10
v
E,
*'
3
m 0
0,
W U
0,
0 -1 0
1
L L EI
ti,
0 1 2 3 4 5 6 7
G e n e r a t i o n
0 1 2 3 4 5 6
G e n e r a t i o n
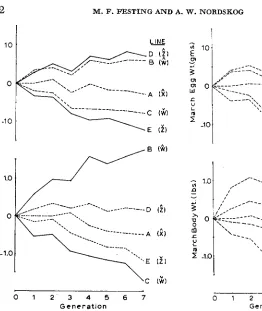
FIGURE 1 .-Response to selection for De- cember body weight and egg weight relative to the RCC control line. Solid lines are direct responses and dotted lines are correlated re- sponses.
FIGURE 2.-Correlated selection responses in March body weight and egg weight rela- tive to the RCC control.
lines because the former is measurable in both sexes but for the latter only in females. Consequently, the selection differential for males was about 70 to 80%
larger than the females in the body weight lines but about the same in the egg weight lines.
in the egg weight lines. An unexpected asymmetry is shown in Figure 1. The cor- related response in egg weight, CR(Z.W) in the B line is strong while that for body weight, CR(W.Z) in the D line is weak. Thus, upward selection on body weight moves egg weight strongly with it but upward selection on egg weight does not move body weight correspondingly. In the down lines, the correlated responses were both fairly strong.
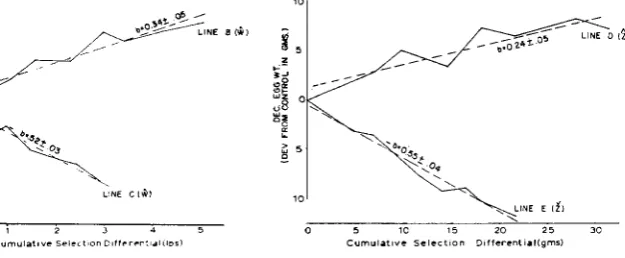
The response curves for the selection criteria plotted against cumulative selec- tion differentials, shown in Figures 3 and 4, are essentially linear. The least squares linear regression coefficients fitted to each of these is an estimate of the realized heritability. For body weight, the heritability for up selection is .34 and for down selection is .52. For egg weight, the heritability for up selection is .24
and for down selection about .55. On a logarithmic transformed scale the dif- ference was essentially unchanged f o r body weight but was slightly greater for egg weight.
A
A
Heritability estimates from the population: Generation trends in population parameter estimates of heritability (full-sib correlations) for body weight (Figure 5 ) and for egg weight (Figure 6) are based on the combined average of the December and March records to reduce sampling error. Neither trait shows clear-cut trends, but the body weight fluctuations from generation to generation (Figure 5 ) are considerably less than for egg weight fluctuations (Figure 6 ) . The results give no indication of a loss in additive genetic variance from selection.
An analysis of variance of the line-generation heritability means is given in Table 4. Differences between lines selected upwards and downwards and differ- ences between generations were statistically significant for body weight herita- bility but not egg weight heritability.
The parameter estimates of heritability are compared with the realized esti- mates in Table 5. In general, the realized heritability estimates are smaller than the parameter estimates for lines selected upwards but larger for lines selected downwards. The parameter estimate of .64 for Line E body weight is significantly
.
0 1 2 3 4 5 0 5 10 15 2 0 2 5 30
Cumulative S e I e ~ f t o n D ~ l f e r C n t r d l ( i 0 ~ ) Cumulative S e l e c t i o n D ~ f f e r e n t i a l ( g m s )
FIGURE 3.-Regressions of response on cu-
mulative selection differentials (realized herit- ability) for the body weight lines.
FIGURE 4.-Regressions of response on cu-
224 M. F. F E S T I N G A N D A . W. NORDSKOG
I
0 1 2 3 4 5 6
G e n e r a t i o n
1
I I r I I I0 I 2 3 4 5 6
ENEMTION
FIGURE 5.-Population parameter heritabil- ity estimates of body weight by lines and gen-
erations. erations.
FIGURE 6.-Population parameter heritabil- ity estimates of egg weight by lines and gen-
higher than the other lines. The realized heritability of .52 for Line C is signifi- cantly higher than the .34 for Line B. The difference 'between the parameter estimates and the realized heritability estimates for Lines B and C are not statis- tically significant.
For egg weight the population parameter estimates in Table
5
are not statisti- cally significant based on the F variance ratio test. The difference in the realized heritabilities (.24 for Line D and .55 for Line E) is statistically significant.TABLE 4
Analysis of uariance of heritability estimates for body weight (W) and egg weight (Z) from full-sib correlations
Mean squares
d / f h2 w h2 z
Lines 4 .0611* .0850
Up us. down 1 .1188* .0722
Body wt. us. egg wt. 1 ,0580 .0591
Generations 6 ,0551 * .OM3
Linear 1 .0411 .14W
Quadratic 1 ,005 9 .0168
Remainder 24 ,0136 .w4
TABLE 5
Comparison of realized heritability estimates ( R ) with population parameter heritability estimates ( E ) for body weight and egg weight
Line E R E-R
Egg weight ( 2 )
.44 .43 .42 .64 t .06
.4Q
.58 .37 .42
*
.07.34 .IO
.52
-.m
. . . .
t .@4 t ,072
.24 .I3
.55 -.I3
2 . 0 5 t ,086
Again, the parameter estimates are not statistically different from the realized heritability estimates, but the interaction difference, .I3 - (-.13) = .26 is sta- tistically significant.
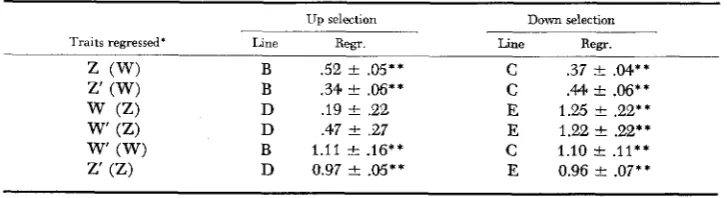
Correlated response.s, regressions and correlations: The regression coefficients of the secondary traits on the primary traits, given in Table 6, all differ signifi- cantly from zero, except for Line
D.
The regressions of egg weight on bodyweight are in fair agreement for the up (W) and the down (W) lines; i.e., for the body weight lines, the regression response in egg weights is symmetrical. This seems not to hold for the egg weight lines: the regression of body weight on egg weight in Line D is significantly lower than that in the Line E; i.e., body weight increase in Line D is less than expected. Thus, the correlated response to selection for body weight is weak upward but strong downward. The regressions of March records on December records are symmetrical and, being close to unity, demonstrate that these correlated responses are substantially equivalent to direct responses from selection.
A V
TABLE 6
Regression of secondary on primary traits
Up selection Down selection
Traits regressed- Line R e g . Line Rem.
2 (W) B .52 & .05** C .37 & .M**
w
(Z) D .I9 t .22 E 1.25 t .22**w' (Z) D .47 +- .27 E 1.22 e .22**
z' (W) B .34 t
.w**
C .44 C .06**w' (W) B 1.11 k .16**
c
1.10 t .11**z' (Z) D 0.97 2 .OS** E 0.96 t .07**
226 M. F. F E S T I N G A N D A. W. NORDSKOG
I
0 1 2 3 4 5 6
G e n e r a t i o n
FIGURE 7.-Phenotypic correlations be- tween body weight and egg weight by lines
and generations.
V
0 1 2 3 4 5 6
G e n e r a t i o n
FIGURE 8.-Genetic correlations between body weight and egg weight by lines and generations.
The population parameter estimated correlations were computed by lines and generations. The phenotypic correlations (Figure 7) show no clear-cut trend but the genetic correlations (Figure 8) indicate a loss in covariance over successive generations of selection. The genetic correlations for the selection lines B, C,
D
and E declined sharply in generation
5,
but those in Line A, regarded here as aTABLE 7
Analysis of variance of phenotypic and genetic correlations (population parameter estimates)
Mean squares
d / f Phenotypic correlation correlation Genetic
Lines 4
Up us. down 1
Body wt. us. egg wt. 1
Linear 1
Quadratic 1
Generations 6
Remainder 24
34
.0167* ,1317" ,0018 .4207** . M I * * ,0012 .0117* .0863*
.0371* * .2390** .0024 .0156
.ow
.0270P < .05
TABLE 8
Comparison of realized genetic correlations ( R ) with population parameter estimates ( E ) between body weight and egg weight
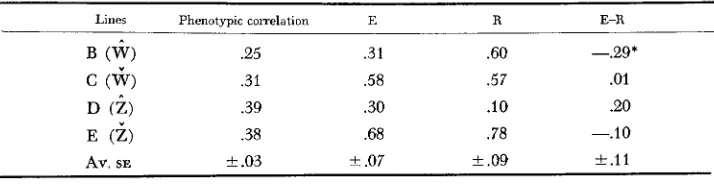
Lines Phenotypic correlation E R E-R
B (W) .25 .3 1 .60 --.29*
c
.31 .58 .57 .01D
(2)
.39 .30 .IO .20E
6)
.38 6 8 .78 -.IOAV. SE
*
.03*
.07*
.09 f . 1 1( * ) UP selection
* P < 05
( " ) Down selection
control, tended to remain unchanged. The decline in the B, C,
D
and E lines was statistically significant; thus, selection in these lines may have reduced the genetic covariance between body weight and egg weight. An analysis of variance of the line-generation means of Figures 7 and 8 is given in Table 7. The linear declines of both phenotypic and genetic correlations were highly significant, statistically.The population parameter estimated correlations are compared with the real- ized genetic correlations in Table 8. Line differences among the phenotypic correlations as well as for each type of genetic correlation are statistically sig- nificant. The phenotypic correlations are symmetrical with respect to 2-way selection but not the genetic correlations. The parameter estimated correlations in the LIP lines are lower than in the down lines. The realized genetic correlations agree reasonably well in the downward selected lines (C and E) but not in the upward selection lines.
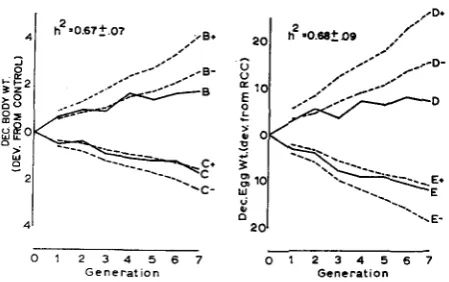
Comparison of expected and observed response to selection: Approximately
95% confidence intervals for the expected response to selection f o r body weight and egg weight were calculated from the usual prediction equation, AG = h'Su,
where AG is the expected genetic change per generation, and 6 is the cumulative selection differential in units of U. Standard errors of the heritability estimates
were calculated by the method of OSBORNE and PATTERSON (1952) using the selection differentials realized in the experiment. Heritability estimates obtained from the base population were h2 = .67 f .07 for W and h2 = .68 f .OS7 for z.
The confidence intervals and the observed responses to selection are shown in Figure 9. The predictions tended to overestimate genetic change, but observed responses in the body weight lines were within the confidence intervals up to about generation 4 after which the response in the B line was less than predicted from the parameter estimates. The observed response in the C line remained within the confidence intervals through generation 7.
The predicted responses considerably overestimated the genetic change in the
228 M. F. FESTING A N D A. W. NORDSKOG
0 1 2 3 4 5 6 7 0 1 2 3 4 5 6 7
G e n e rat ion Generation
FIGURE 9.-Upper (+) and lower (-) 95% confidence intervals for selection response ex- pected from base population heritability estimates. Solid lines are observed responses.
DISCUSSION
Selection efficiency: Two-way selection for body weight and for egg weight resulted in marked changes in these traits both as direct and correlated responses. After eight generations of selection in the Leghorns (1965 test year) the devia- tions between the 2-way body size lines (B us. C) were 80 in body weight
(W)
as a direct response and 3 . 7 ~ in egg weight (Z) as a correlated response to selec- tion. In the egg size lines, Z differed by 5 . 6 ~ as a direct response and W by 3 . 3 ~
as a correlated response to selection.
Indirect selection for W was equal to 45% of the efficiency of direct selection (SEARLE 1965), i.e.
CR(W.Z)/(DR(W)
=.45,
while for Z, indirect selection was55%
as efficient as direct selection, i.e., CR(Z.W)/DR(Z) = .55.Asymmetry of response: FALCONER (1960) has pointed out that when the vari- ance is correlated with changes in the mean resulting from selection, then the selection differential and the response to selection will change accordingly. This is called a scale effect. It follows that progress in the upward direction should increase while progress in the downward direction should decrease. Consequent- ly, the response to 2-way selection would be asymmetrical.
Both the phenotypic and genetic correlations between body weight and egg weight declined with selection. This supports the theory that the genetic covari- ance tends toward zero during the course of selection for one of the covariables. Evidently body weight and egg weight are controlled by both independent and pleiotropic genes.
BOHREN, HILL and ROBERTSON (1966) studied the conditions necessary for the development of asymmetrical correlated responses using simulated selection in a simple genetic model. They found that loci influencing two traits inde- pendently contributed little to asymmetry while pleiotropic loci producing nega- tive covariance with frequencies differing from
%
contributed most. Of less importance were contributions from unequal numbers of loci, and unequal effects of pairs of loci, influencing the two traits. Also the rate of development of asym- metry was inversely related to the number of genes influencing the traits. Since, in our work, asymmetry was evident in the early generations of selection, we might deduce that the number of genes contributing negatively to the covariance between body weight and egg weight should be relatively few.Decline
in
egg production from selection: An important practical consequenceof selection for a metric trait is the decline in egg production and other com- ponents of reproductive fitness. This aspect of the present experiment will be considered in a separate report. Suffice it to say here that for the body weight lines, rate of egg production declined 1 . 4 ~ in high body weight Line B and 0 . 8 ~ in low body weight Line C compared with the control. For the egg weight lines, rate of egg production declined 0 . 9 ~ f o r large egg Line D and .06u for small egg Line E. Thus, in each case, egg production declined up to the eighth generation, but for Line E the decline was not statistically significant from zero. In general, up selection lowered rate of egg production more than down selection.
One might raise the question whether genes for high egg production may be- come lost when selection is directed exclusively towards body size or egg size. For example, will the cross, say, between Lines B and C selected in opposite directions for W return to the original level of egg production in the base popula- tion? Experiments carried out over the past 3 years comparing reciprocal crosses between the high and low body weight and egg weight lines with the mid-parent, show no evidence of less in high egg production genes. Essentially, the original egg production level has been recovered but 'with no indication f o r heterosis above the A line.
Replication: One shortcoming of the present experiment is the lack of replica- tion. The results from two other lines of a different breed (Fayoumi) also selected
230 M. F. FESTING A N D A. W. NORDSKOG
duction rate was considerably more than can be explained by inbreeding de- pression.
S U M M A R Y
Four lines of Leghorns, of common origin, were each selected for a single quantitative trait. These consisted of a 2-way set (Lines B and C) selected for body weight
(W)
high and low, respectively, and another set (Lines D and E)selected for egg weight (Z) high and low, respectively. The selected breeders consisted of eight sires each mated to eight to ten females per line per year. The Cornel1 White Leghorn Randombred was the control population used each year. In addition Line A, selected for high rate of egg production, served as a quasi- control population. This line responded little to selection, and its origin was in common with the other selected lines. Selections 'were based on measurements at approximately 32 weeks of age.-Responses to selection over seven generations were immediate, large and essentially linear. Mean December body weight in the seventh generation was: Line B 6.1 Ib, C 2.7 lb, D 4.5 lb and E 3.1 Ib. Mean December egg weight was: Line B 57 g, C 43 g, D 58 g and E 39 g.-Realized heritabilities calculated from the regression of the selected trait on the cumulative selection differential were asymmetrical with respect to the direction of selec- tion. These were, high
W
.34, low W .52, high Z .24 and low Z .55. I n contrast, variance component heritabilities estimated from sire and dam analysis of vari- ance were symmetrical and intermediate. The variance component heritabilities were largest in the upward selected lines but smallest in the downward selected lines.-The estimation of genetic correlations from variance components and from realized selection response between W and Z paralleled those f o r the esti- mation of heritabilities. The realized genetic correlations, were, Line B .60, C .57, D . I 0 and E .78. A weak correlated response in body weight from selection for large egg size indicated for Line D was unexpected. The genetic correlations from variance components were, Line B .31, C .58, D .30 and E .58. Thus, the agree- ment between realized and variance component correlations was good in the downward selected lines (C and E) but poor in the upward selected lines (B andL I T E R A T U R E C I T E D
ABPLANALP: H., F. X. OGASAWARA, and V.
s.
ASMUNDSON, 1963BOHREN, B. B., W. G. HILL and A. ROBERTSON, 1966
COLLINS, W. W., and H. AFIPLANALP, 1965
FALCONER, D. S., 1960 Introduction to Quantitative Genetics. Oliver and Boyd, Edinburgh.
KEMPTHORNE, O., 1957 A n Introduction to Genetic Statistics. Wiley, New York.
KING, S. C., J. R. CARSON, and D. P. DOOLITTLE, 1959 Measuring breeder's genetic progress through Cornell controls in random sample tests. (Abstr.) Poultry Sci. 42: 1280.
KING, S. C., L. D. VAN VLECK, and D. P. DOOLITTLE, 1963 Genetic stability of the Cornell random-bred control population of White Leghorns. Genet. Res. 4: 290-304.
MALONEY, M. A., J. C. GILBREATH, and R. D. MORRISON, 1963 Two-way selection for body weight i n chickens. Oklahoma Agr. Exp. Sta. Tech. Bull., T-99.
NORDSKOG, A. W., and M. FESTING, 1932 Selection and correlated responses in the fowl. 12th World's Poultry Congr. (Sydney, Australia, 1962) Section Papers, 12: 25-29.
NORDSKOG, A. W., M. FESTING, and M. WEHRLI VERGHESE, 1967 Selection for egg production and correlated responses i n the fowl. Genetics 55 : 179-191.
OLSEN, M. W., and C. W. KNOX, 1941) Breeding for egg weight and related characters. Poultry Sci. 19: 254-257.
OSBORNE, R., and W. S. B. PATTERSON, 1952 On the sampling variance of heritability estimates
SEARLE: S. R., 1965 The value of indirect selection. I. Mass selection Biometrics 21 : 68S-707. SHULTZ, F. T., 1953 Concurrent inbreeding and selection in the domestic fowl. Heredity 7:
1-21.
SIEGEL, P. B., 196% Selection for body weight a t eight weeks of age. Poultry Sci. 41 : 954- 962. - 1962b Selection for breast angle at eight weeks of age. I. Gene interactions and heritabilities. Poultry Sci. 41: 11 77-1185.
Influence of selection for body
Some observations on asymmetrical cor-
Mass selection for body weight in Japanese quail weight at different ages on growth of turkeys. Brit. Poultry Sci. 4: 71-82.
related responses to selection. Genet. Res. 7 : 44-57.
(Abst.) . Genetics 52 : 436.
derived from variance analysis. Proc. Royal Soc. Edinburgh 64: % + % I .
SNYDER, E. S., 1946 WRIGHT, S., 1940
74: 232-248.
Eggs. Ontario Dept. Agr. Bull. 446: 1-4.6.