INTERACTIVE LED ARRAY FOR MOOD
LIGHTING
By
Wee Siong Chong Khadijah Abdul Latiff
ECE 445, SENIOR DESIGN PROJECT FALL 2006
TA: Hye Sun Park
December 4, 2006
Abstract
The purpose of this project was to build an ambient lighting array for mood lighting or for decorative purposes. We designed an lighting array that changes color according to the color of objects in the environment. Our device is able to perform both replicating and contrasting functions.
A color sensor is used to scan the color of the object and the output signals were used in tandem with other circuitry to drive the tri-color LEDs.
This report discusses the details of our design decisions and verification results. We encountered several challenging obstacles in the design process and hence led us to change the design several times from the initial design.
i
TABLE OF CONTENTS
1. INTRODUCTION...1
1.1 Objectives...1
1.2 Project Functions...1
1.3 Benefits and Features...1
1.4 Blocks Diagrams...1
2. DESIGN PROCEDURE ...4
2.1 Initial Design...4
2.1.1 Components Descriptions...4
2.1.2 How It Works...5
2.1.3 Why We Change the Design...5
2.2 Circuit Design 1...5
2.2.1 Sensor Circuit Design...6
2.2.2 LED Panel Design...6
2.2.3 LED Driver Circuit...8
2.3 Circuit Design 2 (Alternative)...8
3. DESIGN DETAILS...9
3.1 Circuit Design 1...9
3.1.1 Sensor Circuit...9
3.1.2 LED Circuit...9
3.1.3 LED Driver Circuit...10
3.2 Circuit Design 2(Alternative)...11
3.2.1 Flow Chart...11
3.2.2 Schematic...13
3.2.3 Replicate...13
3.2.4 Complement...13
4. DESIGN VERIFICATION...14
4.1 Circuit Design 1...14
4.1.1 Sensor Circuit...14
4.1.2 LED Circuit...17
4.1.3 LED Driver...17
4.2 Circuit Design 2(Alternative)...18
4.2.1 Testing of the Program of the PIC...19
4.2.2 Testing of the Program of the PIC and the LED Output...20
4.2.3 Testing of Sensor + PIC + Tri-color LED...21
4.2.3.2 Product Testing...23
5. COST...25
5.1 Material...25
5.2 Labor...25
ii
6. CONCLUSIONS...26
6.1 Accomplishments……….26
6.2 Uncertainties……….26
6.3 Ethical Considerations …....……… 26 6.4 Future Work and Suggestions………...27
7. APPENDIX ...28
iii
1. INTRODUCTION
1.1.Objective
The goal of our project was to create a device that demonstrates the science of how things are recognized via the senses, in particular, how we see color. This device was designed for aesthetical purposes and ambient lighting. The structure of our design is such that it is easy to implement, cheap, customizable and easy to integrate into other systems.
1.2.Functions
Our final product was able to perform the following functions:
- Recognize at least the three primary and three secondary colors - Replicate the color of the object
- Contrast the color of the object
1.3.Benefits and features
Able to enhance the aesthetic quality of the environment to attract business or customers
Very versatile; visual effects are highly customizable.
Provides decorative lighting regardless of the content of the room Can be used to create soothing environment or reduce eye strain
Customizable size and placement
LED lighting requires less maintenance, lifetime outruns regular light bulbs
Suggested application: Elevator lighting, garden/patio lighting, restaurants/hotels/casinos, corridor lighting, aquariums.
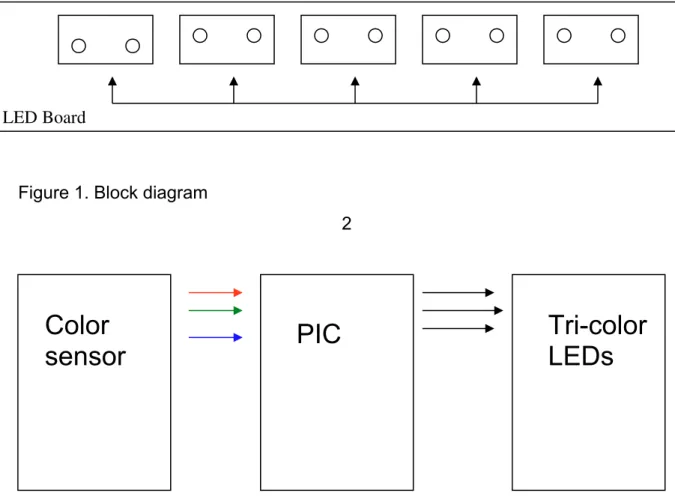
1.4.Block diagram and description 1
Figure 1 on page 2 is a block diagram of the final circuit that we implemented. The sensors detect the colors from the object and produces analog voltage output for levels of red, green and blue that it can see. These voltage outputs are amplified using a non-inverting amplifier and the amplified signal is used to control the intensity of the LED on the LED panel. All components are powered using a single +5V, 2A source.
Sensor Panel Sensor
1 Sensor2 Sensor3 Sensor4 Sensor5
Operational Amplifier/ LED Driver
Figure 1. Block diagram
2
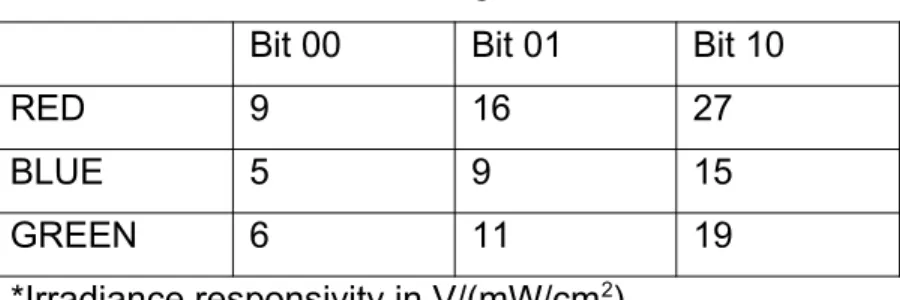
Figure 2. Block diagram of alternate circuit
Color
sensor
PIC
Tri-color
LEDs
3 2. DESIGN PROCEDURE
2.1.Initial design
Components: Sensors + Analog MUX + PIC + LED Driver chip + Tri-color LED Array
2.1.1 Components Descriptions:
1. Color Sensors
Several color sensors will be placed in the environment tank. Each sensor will be powered by a small lithium cell battery. We plan to use the HDJD-S722/ADJD-E622 color sensor produced by Avago Technologies. This sensor converts light into RGB analog voltage output. The output will be sent to the PIC microcontroller circuit. A decoder circuit will decode the outputs of multiple sensors and send the signal to the microcontroller.
2. PIC M icrocontroller C ircuit
3. MAX6965 (LED Driver Chip)
LED driver produces PWM current control that produces 16 steps of intensity. 1 MAX chip has 8 useable outputs, and for convenience, 2 LED clusters containing RGB colors are going to be controlled by 1 MAX chip.
4 Analog MUX
4
A 16-to-1 analog MUX (DG 706) is used to collect 15 different signals from 5 tri-output sensors and feed into the analog input port of the PIC.
5. Power Driver
Circuit designed to provide LED array with desirable power.
6. Tri-color LED array
The LED array will consist of a 5x5 color squares with each unit containing a Red, Green and Blue LED. The array will take the outputs directly from the TTL circuit and it is powered by a separate power source.
2.1.2 How It Works:
The sensors will send signals to the analog multiplexer. The PIC microcontroller will output signal to the analog multiplexer to choose which signal to be sent to the PIC analog input port. Once received the signals, the PIC will process them and send the desirable outputs to the LED driver chip through the I2C protocols. This LED driver chip will control the currents being sent to each LED cluster and therefore change the intensity of the LED from time to time according to the input from the color sensors.
2.1.3 Why We Change the Design:
Result: worked as described on the comments.
Confirmed the I2C pins on the PIC are working properly by outputting high and connect LEDs to those pins.
Result: LED light up and blink as programmed.
Referred to I2C examples on the CCSC manual and wrote codes to output serial data. Checked the output through the oscilloscope.
Result: Failed. Only noises were shown on the oscilloscope. 5
Main problem: Failed to define the I2C pins properly and no example codes could be found. Consulted a few TA’s and none of them used I2C before.
2.2.Circuit Design 1
2.2.1. Sensor circuit design
When we first received our color sensor, we knew that using a photosensitive device, ambient light would be a constant issue. We discovered that the fluorescent lighting in the lab causes interference in the voltage output of the sensor due to flickering from the mains frequency. See Appendix C.
We also realized that for the most part of our testing, our sensors would be pointing upwards. Our first solution to the problem was to do our testing and design in complete darkness and to use white LED as light source. However, this was unrealistic, as other students would be using the lab as well.
We then devised a method of shading our sensors from being exposed directly to the fluorescent lighting using a rectangular shaped cardboard, which serves to block out ambient light. Two white LEDs were placed on either side of the sensor and the cardboard rectangle would be large enough to enclose the LEDs and the sensor. We found that it was best if our testing procedures and usage of sensors was restricted to under the hood of the benches.
The initial design for the LED panel was taking into account that the input signal would come from the MAXIM MAX6965 LED driver. The MAX6965 LED driver produces a current-sinking, pulse width modulated signal and each of its output could only sink current of 20mA. Since a tricolor LED would sink a maximum of 20mA, we used an NPN transistor as a switch to parallel two or more tricolor LEDs in the LED panel. This would be useful in building a larger LED panel that produces more light.
6
The pulse width modulated signal would be connected to the base of the NPN transistor while the collector is connected to +5V power supply and the emitter is connected to one of the cathodes of the tricolor LEDs. The base of the transistor is also connected to +5V power supply via a pull-up resistor.
Consider the pulse width modulated signal to be a series of high/low or ON/OFF, when the signal is low or OFF, the base of the transistor would be connected to a +5V via a pull-up resistor. The voltage is chosen (using the resistor) to be greater than the forward voltage of the transistor, causing the transistor to turn ON and consequently lighting the LED color.
When the signal is high or ON, the base of the transistor would be connected to ground via the LED driver’s current sinking output. Hence the base voltage would be 0V and lower than the forward voltage causing the LED to not light up.
This pulse width modulated signal would allow us to reproduce up to 8 levels of intensity from fully off to fully on and the NPN transistor allows us to use multiple LEDs in parallel without sinking more than 20mA into the LED driver.
As we progressed further into the project and discovered that we would not be using the MAX6965 LED driver, we kept the initial design of the LED circuit for the following reasons:
The transistor allows us to use multiple LEDs while still having a constant input
For the final circuit, the base of the NPN transistor was only connected to the signal from the amplifier and not connected to the +5V via pull-up resistor anymore because we were no longer using pulse width modulation.
Variations in the base current would correspond to variations in the collector current, and in turn controls the intensity of the LEDs.
7 2.2.3. LED Driver Circuit
Without using the microcontroller and the LED driver, the signals from the sensors were used directly to drive the tricolor LED panel. For color calibration purposes, we installed a non-inverting operational amplifier between the sensor voltage outputs and the base of the NPN transistor from the LED circuit.
The sensor itself has internal gain select function that the user could specify. However, we discovered that the gain for each color was not equal and needed manual adjustments. Each of the voltage output of the sensor that corresponded to the colors red, green and blue was connected to a non-inverting operational amplifier with different gains to balance out the final displayed color. The sensor internal gain select was set to the highest possible.
2.3.Circuit Design 2
Figure 2 on page 3 is our alternate circuit which incorporates the Peripheral Interface Controller (PIC) microcontroller. The PIC microcontroller circuit will convert the analog RGB voltage signal into digital signal. It will compare the intensity of each RGB signal and produce a corresponding digital output that reflects the actual color of the output.
The difference from the one described in the initial design: It takes in 3 analog signals at the same time.
It no longer sends outputs to analog multiplexer.
8 3. DESIGN DETAILS
3.1.Circuit Design 1
3.1.1. Sensor Circuit
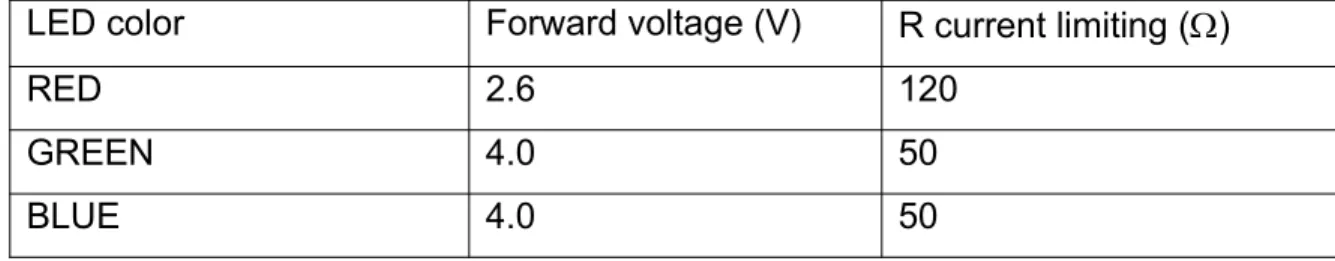
The color sensor has its select bits connected to give the highest internal gain. The gain corresponds to the responsivity of the sensor, which is measured in V.cm2/mW. At its highest gain selection, red voltage output has responsivity of 27 V.cm2/mW, green has 19 V.cm2/mW, and blue has 15 V.cm2/mW. Two white LEDs are placed approximately 5mm on both sides of the sensor. The black cardboard rectangle measures 3cmx4cm and is 3cm in height.
As suggested by the manufacturer’s application notes, we placed a bypass capacitor of 0.1F between the sensor’s power supply and ground to reduce noise from the power supply.
Table 1. Color sensor gain selection
Bit 00 Bit 01 Bit 10
RED 9 16 27
BLUE 5 9 15
GREEN 6 11 19
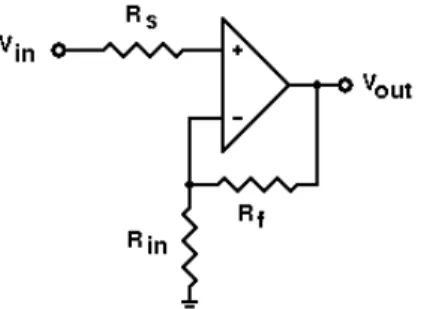
The tri color LED contains red, green and blue LEDs, housed in a single epoxy package. In the design, they are treated as separate LEDs with different characteristics such as forward voltage and luminous intensity.
The value of the current limiting resistor is chosen according to the value of the LED’s forward voltage using Ohm’s Law:
(1) 9
Where I=20mA is the current limit and Vf is the forward voltage of the LED.
Table 2 shows the calculated value of current limiting resistors for each LED. Table 2. Current limiting resistor values
LED color Forward voltage (V) R current limiting ()
RED 2.6 120
GREEN 4.0 50
BLUE 4.0 50
The 2N4401 general purpose NPN transistor is the one that we used in our LED circuit. It’s maximum current rating of 600mA would allow us to use up to 30 LED if one LED were to draw a maximum of 20mA. This is far more than we would ever use but would allow us to use as many as we wanted and if a larger scale of this circuit was to be reproduced, the same transistor may be used. It is recommended that the transistor has at least a maximum current rating of 100mA.
Figure 3. Non inverting operational amplifier
Figure 3 is a diagram of the non-inverting amplifier that is used in our circuit. In our design, we used the LM2904 low power dual operational amplifier. To simplify the calibration process we chose Rf to be 1M. Varying values of Rin would result in different gain values. Rs is chosen to be exactly the same value as Rin.
10
(2)
Table 3 Tabulation of the possible gains using standard resistor values as found in the lab.
Av R1
101 10k brown Black Orange
51 20k red Black Orange
11 100k Brown Black Yellow
5.54 220k red Red Yellow
4.7 270k Red Purple Yellow
4.0 330k Orange Orange Yellow
3.56 390k Orange White Yellow
3.12 470k Yellow Purple yellow
2.786 560k Green Blue yellow
2.47 680k Blue Gray Yellow
3.2.Circuit Design 2
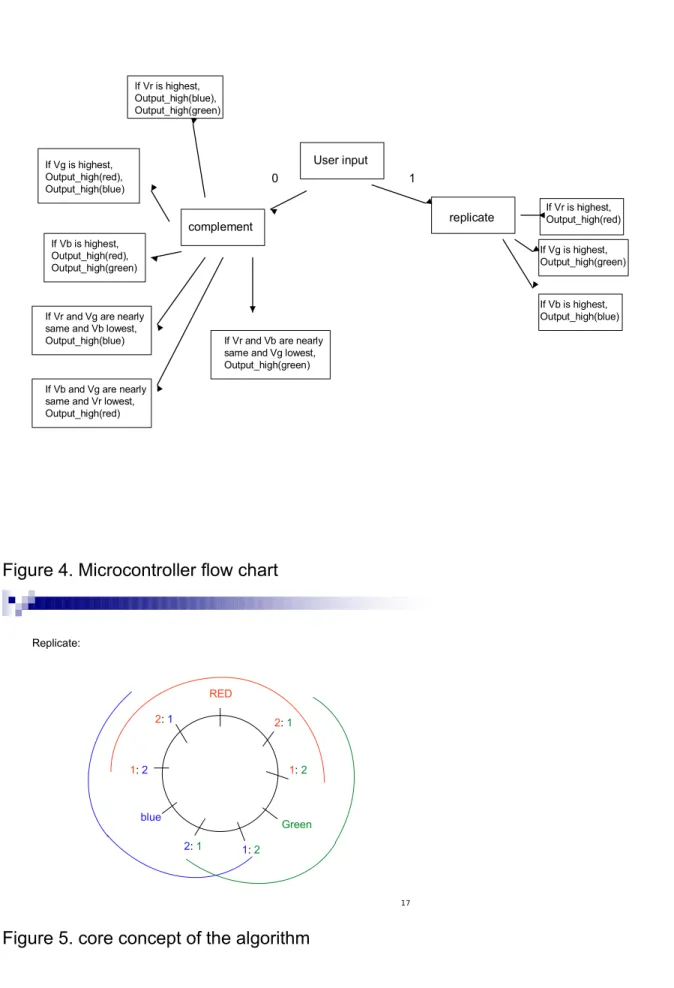
3.2.1. Flow Chart
See figure 4 on page 11
User input
0 1
replicate complement
If Vr is highest, Output_high(red)
If Vg is highest, Output_high(green)
If Vb is highest, Output_high(blue) If Vr is highest,
Output_high(blue), Output_high(green)
If Vg is highest, Output_high(red), Output_high(blue)
If Vb is highest, Output_high(red), Output_high(green)
If Vr and Vg are nearly same and Vb lowest, Output_high(blue)
If Vb and Vg are nearly same and Vr lowest, Output_high(red)
If Vr and Vb are nearly same and Vg lowest, Output_high(green)
Figure 4. Microcontroller flow chart
17 Green
RED
blue
2: 1
1: 2
2: 1
1: 2
2: 1 1: 2
Replicate:
12 3.2.2. Schematic
See appendix B
3.2.3. Replicate function
This model is much simpler than the model described in the original design. As can be seen in the figure 5 on page 11, the region between two colors are divided into 3 parts.
For instance, the region between the red and green is divided into 3 parts. The mark that is nearer to the red color is a mark that shows the ratio of red to green. 2: 1 means that the Vred is twice of Vgreen; while the mark nearer to green shows that Vred is one half of Vgreen.
The region between the two marks is the region when both red and green will be activated and produce a yellow color on the LED.
To make the algorithm simpler and more efficient, the code was written to define when each color is activated instead of defining each part or region.
As can be seen in the diagram, the red element of the LED will be activated when the signals from the sensor falls between the 1:2 mark near the green and the 1:2 mark near the blue.
In other words, if Vr is more than twice of Vg, the PIC will output only red; if Vr is less than twice of Vg and Vg is not more than twice of Vr, both red and green will be outputted; if Vg is more than twice of Vr, only green will be outputted.
3.2.4. Complement function
13 4. DESIGN VERIFICATION
4.1.Circuit Design 1 4.1.1. Sensor Circuit Test condition 1: dark room
(a) (b)
Figure 6. Vout Red sensor 5 under test condition 1
The figures above shows signal conditioned in the dark with only 2 white LEDs as sensor’s light source. Figure 6 (a) shows control environment under condition 1. In figure 6 (b) the voltage increases as a piece of papers is hovered 2cm above the sensor.
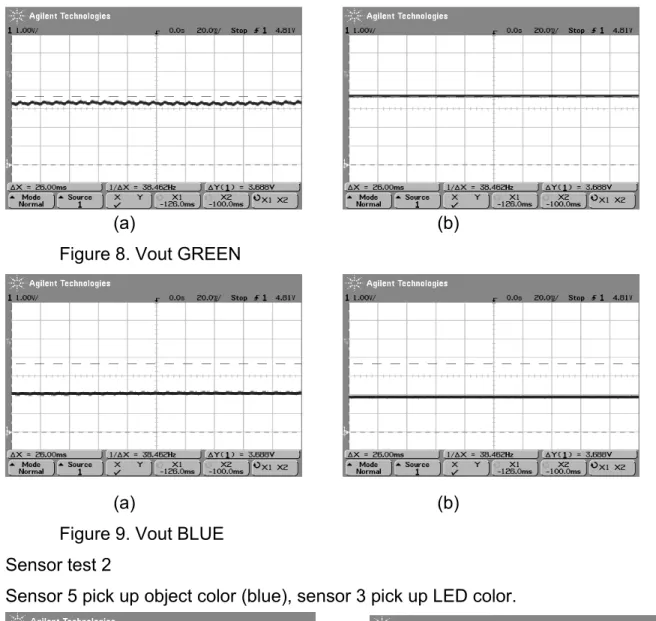
Test condition 2: normal lighting, placed under hood, final setup.
Sensor 5 pick up object color (Yellow orange) Sensor 3 picks up color from LED
Figure 7. Vout RED 14
(a) (b)
Figure 8. Vout GREEN
(a) (b)
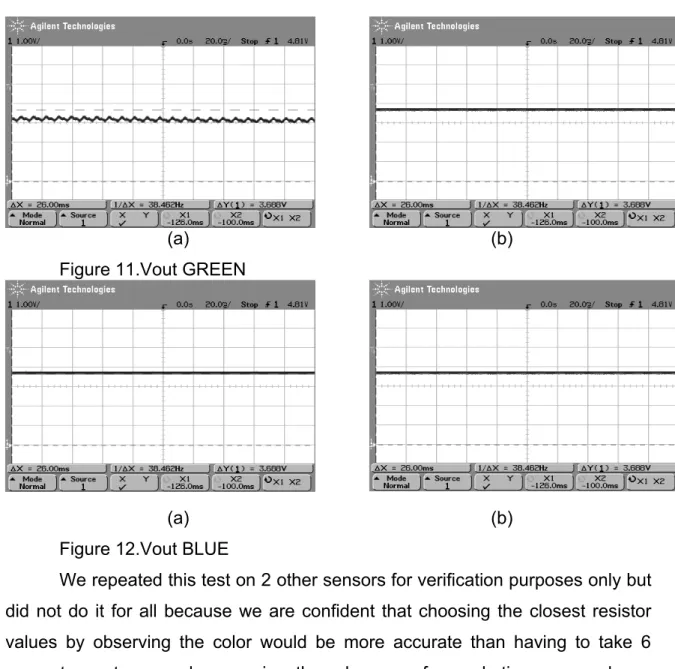
Figure 9. Vout BLUE Sensor test 2
Sensor 5 pick up object color (blue), sensor 3 pick up LED color.
(a) (b)
15
(a) (b)
Figure 11.Vout GREEN
(a) (b)
Figure 12.Vout BLUE
We repeated this test on 2 other sensors for verification purposes only but did not do it for all because we are confident that choosing the closest resistor values by observing the color would be more accurate than having to take 6 separate captures and comparing them because for each time we made an oscilloscope measurement, the colored object that we are observing does not stay at the same exact place because it is held by hand and the hand tends to move from time to time.
16 4.1.2. LED Circuit
We verified this circuit by using a waveform generator to simulate pulse width modulated signal, which later we did not require. We did, however, try paralleling up to 5 LEDs in a row and made sure that the transistor was capable of turning all of the LEDs on without compromising intensity or quality of the light from the LED.
4.1.3. LED Driver
The most difficult part of this circuit was to manually calibrate the output of the sensors by trial and error method. Adjusting the gain of the operational amplifier for one color might in turn affect the responsivity of other colors.
What became more complex was when we used the same set of resistor values for the second sensor’s operational amplifier and the outcome was not as we expected and had to re-calibrate for that sensor as well.
The same thing happened to the third sensor, when neither the first set nor the second set of resistor values were suitable for this sensor’s calibration and thus led us to believe that every sensor had to be calibrated individually.
For the fourth sensor through the seventh sensor, we noted that three out of four of them had the same resistor values as the first sensor and one of the four had the same resistor values as the third sensor. Finally we believe that three out of our seven sensors must have been faulty.
The process of choosing the resistor values start with trial and error method, and observing the color of the LEDs with the naked eye. This method is not highly accurate, however, it would give a close guess as to how much closer you can get to the accurate values.
First, a red colored paper is hovered over the sensor and the LED color is observed. The distance between the paper and sensor and corresponding color of LED is also observed. If the red LED turned on before any stimulation, the gain would be reduced. If the LED does not light up as the paper closed the cardboard rectangle completely, the gain would be increased.
17 colors show up correctly.
To calibrate secondary colors, a coral orange and a coral pink colored paper is used as a test. The coral orange paper should induce more green, and the coral pink should induce more blue, both with the same amount of red light. Based on the observation with the naked eye, the gains of the blue and green operational amplifier are adjusted accordingly.
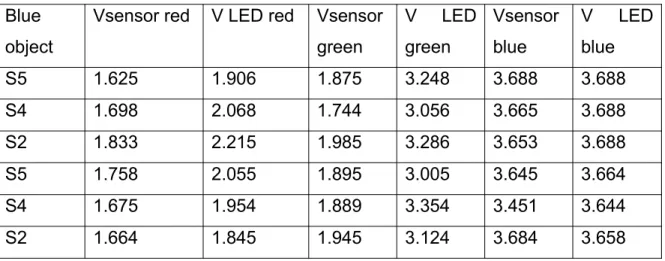
To further verify this set of gain adjustment resistors, we devised a method that uses another color sensor to measure the color produced by the tricolor LED at the stimulation of a particular color and compare it with the ratio of colors that the first sensor sees in the object. Data from this test is tabulated in table 4 below.
Table 4. Data from sensor test Blue
object
Vsensor red V LED red Vsensor green
V LED green
Vsensor blue
V LED blue
S5 1.625 1.906 1.875 3.248 3.688 3.688
S4 1.698 2.068 1.744 3.056 3.665 3.688
S2 1.833 2.215 1.985 3.286 3.653 3.688
S5 1.758 2.055 1.895 3.005 3.645 3.664
S4 1.675 1.954 1.889 3.354 3.451 3.644
S2 1.664 1.845 1.945 3.124 3.684 3.658
Also see Appendix D for manual gain adjustment process.
18
18
Testing Procedure
PIC DC
Power Supply
Multimeter 1)
DC Power Supply
PIC
Tri-color LED 2)
Multimeter
PIC Color
sensor
Tri-color LED 3)
Figure 13 Testing procedures
4.2.1. Testing of the Program of the PIC
Varying voltages (Vr, Vg, and Vb) were fed into the analog input ports on the PIC and the digital outputs (VoutR, VoutG, and VoutB) of the PIC were measured with Multimeter. Results tabulated in table 5 on page 19.
Conditions Checking:
Vr > 0.5* Vb && Vr > 0.5*Vg à output red
Vb> 0.5* Vr && Vb >0.5* Vg à output blue
19
Table 5: Results When replicate function was chosen(unit: V):
Vr Vg Vb VoutR VoutG VoutB
1 2 3 0 5 5
1 2 2 0 5 5
3 2 1 5 5 0
2 2 2 5 5 5
1 2 1 0 5 0
3 3 2 5 5 5
3 2 3 5 5 5
0 1 0 0 5 0
0 0 0 0 0 0
4.2.2. Testing of the Program of the PIC and the LED Output
The tri-color LED and the multimeter were connected to the digital output pins of the PIC. The purpose of this testing is to see if the LED output the correct colors when varying voltages were fed into the PIC. The multimeter was used to check the voltages fed into the LED from the PIC. Results are tabulated in table 6 and 7 on page 20.
Conditions Checking:
Vr > 0.5* Vb && Vr > 0.5*Vg à output red
20
Table 6:Results When replicate function was chosen (unit V):
Vr Vg Vb VoutR VoutG VoutB Color of LED
1 2 3 0 3.3 3.2 Green + Blue
1 2 2 0 3.3 3.2 Green + Blue
3 2 1 2.2 3.3 0 Red + Green
2 2 2 2.2 3.3 3.2 White
1 2 1 0 3.3 0 Green
3 3 2 2.2 3.3 3.2 White
3 2 3 2.2 3.3 3.2 White
0 1 0 0 3.3 0 Green
0 0 0 0 0 0 No output
Table 7: Results When complement function was chosen(unit V):
Vr Vg Vb VoutR VoutG VoutB Color of LED
1 2 3 2.2 0 0 Red
1 2 2 2.2 0 0 Red
3 2 1 0 0 3.2 Blue
2 2 2 0 0 0 No output
1 2 1 2.2 0 3.2 Red + Blue
3 3 2 0 0 0 No Output
3 2 3 0 0 0 No Output
0 1 0 2.2 0 3.2 Red + Blue
0 0 0 2.2 3.3 3.2 White
Note: The Vout are different from first test due to the PIC’s ability to check and output correct voltages to different legs of the LED.
4.2.3. Testing of Sensor + PIC + Tri-color LED
21
colors were shown at approximately 5cm from the color sensor. The outputs of the LED were observed. In this experiment, the light of the room was still ON and no white LED was used light up the object.
4.2.3.1. Effective Distance Finding
First, a distance testing was run. Object of certain color was shown at varying distances from the sensor. The Vout was measured from the legs of the tri-color LED.
Result:
Vout Vs. Distance
-0.5 0 0.5 1 1.5 2 2.5 3 3.5 4
0 2 4 6 8 10 12
Distance(cm)
V
o
u
t(
V
)
Vr Vg Vb
Figure 14.Vout at the LED Vs. Distance of the object from the sensor
22 went high.
Another result obtained when blue object was shown in figure 15
Vout Vs. Distance
-0.5 0 0.5 1 1.5 2 2.5 3 3.5 4
0 2 4 6 8 10 12
distance(cm)
V
o
u
t(
V
)
Vr Vg Vb
Figure 15 Vout at the LED Vs. Distance of the object from the sensor
4.2.3.2. Product Testing:
All components were connected and tested together. Objects were shown at 5cm from sensor.
Table 8. Results When replicate function was chosen (unit: V):
Color of the Object VoutR VoutG VoutB Color of LED
Red 2.2 0 0 Red
Red 2.2 0 0 Red
Blue 0 0 3.2 Blue
Black 0 0 0 No output
Red + Blue 2.2 0 3.2 Red + Blue
Black 0 0 0 No Output
Black 0 0 0 No Output
Red + Blue 2.2 0 3.2 Red + Blue
White 2.2 3.3 3.2 White
Table 9. Results When complement function was chosen(unit: V):
Color of the Object VoutR VoutG VoutB Color of LED
Red 0 3.3 3.2 Green + Blue
Red 0 3.3 3.2 Green + Blue
Blue 2.2 3.3 0 Red + Green
Black 2.2 3.3 3.2 White
Red + Blue 0 3.3 0 Green
Black 2.2 3.3 3.2 White
Black 2.2 3.3 3.2 White
Red + Blue 0 3.3 0 Green
White 0 0 0 No output
24 5. COST
5.1.Materials
Table 10: Cost of materials
Part no. Manufacturer/Vendor Quantity Unit Price Price
Sensor Panel
HDJD-S722 Agilent 5 $7.00 $35.00
White LED ECE Store 10 $3.50 $35.00
0.1μF capacitor
ECE Store 5 $0.13 $0.65
resistors ECE Store 10 $0.09 $0.90
Printed
Circuit Board Independent contractor 1 $150.00 $150.00
LED Panel RL5-RGB C common cathode
www.superbrightLEDs.com 10 $1.59 $15.90
AC to DC wall
transformer +5V, 2A
www.rgbled.com/store 1 $15.50 $15.50
2N4401 ECE Store 15 $0.52 $7.80
resistors ECE Store 15 $0.09 $1.35
LED Driver
LM2904 ECE Store 10 $0.27 $2.70
resistors ECE Store 30 $0.09 $2.70
Materials Total $267.50
5.2.Labor
25 6. CONCLUSIONS
6.1.Accomplishments
Color sensor circuit is able to recognize and detect all of the primary and secondary colors of the light spectrum. Our LED panel was also able to replicate all the primary and secondary colors. The LED intensity also changes with respect to distance of object to the sensors. Our alternative circuit design that incorporated the PIC microcontroller was able to contrast as well as replicate the object’s colors.
6.2.Uncertainties
There are still uncertainties regarding our testing procedures because none of them can prove to be 100% accurate. The room lighting is a variable that constantly changes every time we move our testing from one bench to another and also the area of the bench we perform testing. The distance between objects to the sensors is also inconsistent because of the placement of the sensor on the protoboard, we can only hover the objects above it and hold it using our hands. Verification procedures can be further refined to improve accuracy and consistency of results.
6.3.Ethical considerations
In consideration of the IEEE code of ethics, we could not foresee any reason why our product would violate the code of ethics. It is safe and could not endanger the safety of the public or environment. If anything, LED lighting uses less energy than conventional lighting and therefore is more environmentally friendly.
In the event that this design is developed integrated into devices such as the Phillips Ambilight television or the F1 light adjusting helmet, additional testing
26
may be required to gage the biological tolerance for light intensity and contrast.
We constantly seek and accept honest criticism of our work and will constantly work to update and correct our errors.
6.4.Future Work and Suggestions
To implement this design at a larger scale, the current limit of the power supply is of utmost importance. The power drawn by this device is linearly dependent on the number of LEDs being used. In order to build larger clusters of LEDs, we strongly encourage checking and comparing the current limit of the NPN transistors to the number of LEDs in parallel.
27
APPENDIX A: CODE
#include <16F877A.h>
#include "Include\Compiler.h" #include "Include\Globals.h"
#device *=16 ADC=10
#fuses HS,NOWDT,NOPROTECT,NOLVP #use delay(clock=20000000)
#pragma zero_ram
void main() {
unsigned int16 sensor0,sensor1,sensor2;
setup_adc(ADC_CLOCK_INTERNAL); delay_ms(500);
set_tris_A(MY_TRISA); set_tris_B(MY_TRISB); set_tris_C(MY_TRISC); set_tris_D(MY_TRISD);
while(FOREVER) {
setup_port_a(ALL_ANALOG);
set_adc_channel(0); delay_us(10); sensor0=read_adc();
read_adc(ADC_START_ONLY);
sensor0= read_adc(ADC_READ_ONLY);
delay_us(10); sensor1=read_adc(); read_adc(ADC_START_ONLY); sensor1= read_adc(ADC_READ_ONLY); set_adc_channel(2); delay_us(10); sensor2=read_adc(); read_adc(ADC_START_ONLY); I sensor2= read_adc(ADC_READ_ONLY); if (input(PIN_C1)) { if(sensor0!=sensor1!=sensor2) {
if (sensor0>sensor1*0.5 && sensor0 >sensor2*0.5) output_high(LED0);
else
output_low(LED0);
if (sensor1>sensor0*0.5 && sensor1 >sensor2*0.5) output_high(LED1);
else
output_low(LED1);
if (sensor2>sensor1*0.5 && sensor2 >sensor0*0.5) output_high(LED2); else output_low(LED2); } else { output_low(LED0); output_low(LED1); output_low(LED2); } }
{
if(sensor0!=sensor1!=sensor2) {
if (sensor0>sensor1*0.5 && sensor0 >sensor2*0.5) output_low(LED0);
else
output_high(LED0);
if (sensor1>sensor0*0.5 && sensor1 >sensor2*0.5) output_low(LED1);
else
output_high(LED1);
if (sensor2>sensor1*0.5 && sensor2 >sensor0*0.5) output_low(LED2);
II
else
output_high(LED2); }
else {
output_low(LED0); output_low(LED1); output_low(LED2);
}
APPENDIX B: Schematic for Circuit Design 2
s w i t c h O s c i l l a t o r
Q 1 2 N 4 4 0 1
Q 2 2 N 4 4 0 1
R 1 1 2 0 HDJD-S722/ADJD -E622 color sensor +5V +5V +5V +5V +5V +5V PIC 16F877A 1 2 D 1 R e d R 2
1 2 0
1
2
D 4 R e d
R 3 5 0
1
2
D 2 G r e e n
R 4 5 0
1
2
D 5 G r e e n
R 5 5 0
1
2
D 3 B l u e Q 3 2 N 4 4 0 1
R 6
5 0
1
2
D 6 B l u e
+5V +5V +5V
APPENDIX C: AC FLICKER
In figure 1 below we see flicker that occurs at 108.7Hz from AC mains fluorescent lighting
Figure 1(a). RED Vout
Figure 1(c). Blue Vout V Figure2, AC flicker still occurs when object (hand) is placed 2 inches over sensor
Figure 2(a). Red Vout
Figure 2(c). Blue Vout
VI Solution to flicker, by using white LEDs , test circuit under hood and using black
cardboard to block ambient light
Figure 3(b). Vout green with blown up scale
Figure 3(c). Vout blue with blown up scale
VII
APPENDIX D: GAIN ADJUSTMENT PROCESS
Color sensor gain selection
Bit 00 Bit 01 Bit 10
RED 9 16 27
BLUE 5 9 15
GREEN 6 11 19
Table 1.
*Irradiance responsivity in V/(mW/cm2)
Manual OP AMP gain
Av R1
101 10k brown Black Orange
51 20k red Black Orange
11 100k Brown Black Yellow
5.54 220k red Red Yellow
4.0 330k Orange Orange Yellow
3.56 390k Orange White Yellow
3.12 470k Yellow Purple yellow
2.786 560k Green Blue yellow
2.47 680k Blue Gray Yellow
2.163 860k Gray Red Yellow
Table 2. Op amp gain with resistance R1 values. Rf = 1Mohm
10/30/06
Setup 1
Current sensor gain select: Red 10
Green 10 Blue 10
Op Amp gain: 2.786 for all
VIII Observation:
Blue objects (Dasani bottlecap, mini first aid kit, MAC Belle Azure eyeshadow) make LED shine BLUE
Red objects (sephora booklet, TAB energy bottle, Pink post it note) make LED shine RED.
Green objects (Turquoise mug, Green Frisbee robot) shine BLUE
Yellow objects (yellow post it) shine RED
Possible explanations:
1. Gain for green is too low
3. “Green objects” are not TRUE green to the sensor. Sensor detects green in 542nm wavelength.
Solution:
Find a true green object to test with?
Set green to a higher gain, maybe 2x. So replace 560k with 220k for R1s in green op amp.
Observation2:
Change green op amp gain to 5.54 and during turn on, the green LED was already almost at peak intensity. Just 1-2 step below max intensity.
Now find a gain between 2.7 and 5.5, i.e. resistors R1 between 220k to 560k ohms.
Observation 3:
Try R1=390k; gain 3.56
Still not much amplification for green, but if my eyes did not deceive me, I think I could distinguish red from orange, i.e. cooler red from warmer red.
Observation 4:
Try R1=270k; gain 4.7
A tad too much green, there fore must lower gain to maybe 4 and R1=333k
Observation 5:
Gain 4 is still too high. Green is almost peak intensity
IX Observation 6:
Replace 1Mega ohm with 1.5 M and 333k with 560k… gain should become 3.678 Observation 7:
BEST results yet. Some of the previous circuits that showed too much green were wired incorrectly from observation 6 and before that. Don’t remember when it changed to wrong circuit.
Now corrected and the best ratio is 1Megaohm/330kohm, gain equals 4.
Green Frisbee still shows more blue than green, maybe because it is a dark green and not true green.
To correct this, maybe should adjust gain for blue.
Colors that still need to be tested are green, and purple.
10/31/06
Total gain:
Red: 27 V/mW/cm2 x 2.786 = 75.222 V/mW/cm2 Blue: 15V/mW/cm2 x 2.786= 41.79 V/mW/cm2 Green: 19V/mW/cm2 x 4.03= 76.57 V/mW/cm2
Hypothesis:
Based on my observations yesterday, and today, I feel that the only color need adjusting is the blue. Based on the total gain recorded above, the blue is in a completely different range from red and green.
Analysis:
Try increasing the gain for blue close to 75, which means the op amp gain should be equal to 5.
Resistance value:
R1 = 220k or 270k
Observation 1:
220k with gain of 5.54 proves to be too much amplification for blue.
X Observation 2:
Observation 3:
APPENDIX E: SCHEMATIC FOR CIRCUIT DESIGN 1
T i t le
S iz e D o c u m e n t N u m b e r R e v
D a t e : S h e e t o f
< D o c > < R e v C o d e > < T i t le >
A
1 1
T u e s d a y , O c t o b e r 3 1 , 2 0 0 6 R 1 1 2 0
1 2 D 1 0 1 2 D 2 1 2 D 3 R 2 5 0 R 3 5 0 0 + 3 -2 V + 8 V -4
O U T 1
U 1 A
+ 5 -6 V + 8 V -4
O U T 7
U 1 B
+ 3 -2 V + 8 V -4
O U T 1
U 2 A
G R E E N B L U E R E D H D J D C O L O R S E N S O R
R 4
1 M R 5
5 6 0 k R 6
5 6 0 k
R 7
3 3 0 k
R 8
1 M R 9
3 3 0 k
R 1 0
5 6 0 k
R 1 1
5 6 0 k R 1 2
1 M
R 1 4
6 8 1 2
D 5 R 1 5
6 8 1 2
D 6 0
+ 5 V
W H I T E L E D
C 1
0 . 1 u F
+ 5 V + 5 V
+ 5 V + 5 V
+ 5 V
+ 5 V
APPENDIX F: LED Power consumption
#LED Current 1 current 2 voltage Power consumption power consumption per LED current sink per LED note
0 0.275 0.28 5.01 1.4028
1 0.312 0.292 4.998 1.459416 0.056616 0.012
2 0.343 0.309 4.998 1.544382 0.084966 0.017
3 0.324 0.322 5 1.61 0.065618 0.013
4 0.343 0.335 5 1.675 0.065 0.013
5 0.352 0.353 5 1.765 0.09 0.018
6 0.372 0.372 4.999 1.859628 0.094628 0.019
7 0.382 0.386 4.998 1.929228 0.0696 0.014
8 0.401 0.401 4.998 2.004198 0.07497 0.015
9 0.416 0.415 4.998 2.07417 0.069972 0.014
10 0.431 0.429 4.998 2.144142 0.069972 0.014
0.0149average
20 0.573 prediction of power supply current limit needed
REFERENCES
[1] Agilent /Avago color sensor Data sheet: “HDJD-S722_QR999,” 31 May, 2006
http://www.avagotech.com/assets/downloadDocument.do?id=2323
[2] FOX Electronics, “Data Sheet: 5.0 TTL Clock Oscillator,” 06 Jan. 2004, http://www.foxonline.com/PDFS/f1100e.pdf.
[3] Custom Computer Services, “C Compiler Reference Manual” Version 4, Nov. 2006,
http://www.ccsinfo.com/downloads/ccs_c_manual.pdf.
[4] Microchip, “PIC 16F87XA Data Sheet: 28/40/44- Pin Enhanced Flash Microcontrollers,” Version DS39582B, 2003,
http://ww1.microchip.com/downloads/en/DeviceDoc/39582b.pdf.
[5] Superbright LEDs, Data Sheet: “Tri-color RED Green Blue LED”
http://www.superbrightleds.com/TriColor%20LED.htm
[6] National Semiconductor, “LM158/LM258/LM358/LM2904, Low Power Dual Operational Amplifiers,” October 2005