MOLECULAR CLOUDS AND STAR FOR.."1\1.ATION
Thesis by
Anneila Isabel Sargent
In Partial Fulfillment of the Requirements for the Degree of
Doctor of Philosophy
California Institute of Technology Pasadena, California
1978
{ii)
ACKNOWLEDGEMENTS
My days as a graduate student have spanned such a large number of years that i t is impossible to thank indi-vidually all the advisors, office-mates, fellow students and other friends who have, over that time, contributed in one way or another to my education.
I am very grateful to my current advisor, Peter
Goldreich, for encouraging me to begin the research which constitutes this thesis and for his support throughout the last three years. Much of my enthusiasm to embark upon this course was inspired by a long collaboration with Jesse
Greenstein, and, during the last months, the fruitful con-clusion of that collaboration was often my sole reason for believing the present work would ever be finished. I am indebted to Gerry Neugebauer for detailed and constructive criticisms of drafts of both chapters, as well as for his advice on a number of troubled occasions.
It is a pleasure to thank Jill Knapp for introducing me to the technicalities of millimeter radio astronomy, for assisting with the early observations and for providing the initial 2 mm formaldehyde data. Robert Loren and Neal Evans, of the University of Texas at Austin, kindly obtained the
2 cm formaldehyde observations. I also appreciate use of the latter's models to derive densities from the formalde-hyde measures. Unpublished ANS data w2re drawn to my
for these and for a number of helpful discussions·.
A great deal of telescope time was necessary to this project and I appreciate the generous spans allocated to me at the Aerospace Corporation by Eugene Epstein. Observing time at the Millimeter Way Observatory and the National
Radio Astronomy Observatory is also gratefully acknowledged. At various stages of this work I have had useful dis-cussions with, or been assisted by, a number of people other than those mentioned above. In this context I should like to thank Charles Alcock, Steve Beckwith, Todd Boroson, Menachem Cimerman, Bob Dickman, Jay Elias, John Huchra, Frank Israel, Daniel Kunth, Fred Lo, Jon Romney, Ron Snell, Paul Vanden Bout, Julie ·white and Bill Wilson. I am also exceedingly grateful to Catherine Cesarsky, Althea Wilkinson and Anna Zytkow for sustaining my morale.
Chapter 1 was ably and obligingly typed by Helen
Holloway. The remaining typing was done by Marilynne Rice under circumstances which leave me forever in her debt.
The long-suffering encouragement of my husband Wal, and the toleration of my daughters Lindsay and Alison has considerably eased the compietion of this work. I cannot adequately express my indebtedness to them.
-iv-ABSTRACT
Observations of the J
=
1 + 0trans~tion·
of 12co
were made in and around the region occupied by the young OBassociation Cepheus OB3 to determine the connection between newly formed stars and molecular clouds. An extended
(20 pc x 60 pc) molecular cloud was detected and mapped, and additional observations of 13
co
and H2
co
were made at selected positions. The total mass of the cloud is 5 x 10 3 M0. A range of velocities is seen over the cloud complex. This is comparable with the stellar velocities in the association.
Within the molecular cloud are found three regions in which different stages of star formation are identified. In one an embedded star may be present. Another appears to be collapsing on a time scale of
~
3 x 10⁵ years to form a new subgroup of the OB association. The mass of this region, 500 M0,is sufficient to produce only the number of 0 and B
stars typically found in association subgroups, suggesting that lower mass stars must form under different conditions. The third displays signs of enhanced density and is probably the precursor of a star forming region. All three regions are situated in that part of the molecular cloud which is closest to the association stars.
-v-places of origin determined. Ages of 1-3 x 10⁵ years and
5
5-7 x 10 years are found for younger and older subgroups respectively. Their birthplaces are not coincident but are situated at that end of the cloud where star formation still appears to be taking place. The younger subgroup appears to have formed closer to the active regions than did the older subgroup, so that there is a well-defined age sequence across the association which continues into the cloud.
There is currently little direct interaction between the stars and the molecular cloud, although a few younger subgroup stars still lie close to or within the complex. The absence of primeval gas in the environs of the older subgroup is attributed to the unusually high velocity of separation between these stars and the cloud.
It appears that the younger and still-forming sub-groups of Cepheus OB3 are created in a different way from the older subgroup. However, the way in which star
-vi-TABLE OF CONTENTS
Introduction 1
Chapter 1 Observations of the Cepheus Molecular Cloud 2
I. Introduction 3
II. Observational Selection 4
III. CO Observations 6
IV. Formaldehyde Observations 13
V. Results 14
VI. Detailed Studies of Cep-A, Cep-B, Cep-C 27
VII. Swnmary 45
References 48
Chapter 2 Star Formation in Cepheus OB3 50
I. Introduction 51
II. The Molecular Cloud 52
III. The Cepheus OB3 Stars 77
IV. The Present Relationship between the 103 Molecular Cloud and the OB Association
v.
Star Formation in Cepheus OB3 109VI. Summary 119
-1-I. INTRODUCTION
This thesis contains two papers concerning the forma-tion of stars in molecular clouds. A study has been made of the properties of the young OB association Cepheus OB3 and its related molecular cloud complex,with the intention of establishing how the association was created and how the cloud has subsequently evolved.
Detection and measurements of the molecular cloud are described in Chapter 1. Occasional references are made to following papers. These remarks may appear out of place in the context of the thesis, but result from the fact that this chapter is the first paper of a series on molecular clouds and star formation.
In Chapter 2 the observations of the Cepheus molecular cloud are analyzed, and the properties of the association stars are examined in detail. Finally, the results for the molecular cloud and the stars are combined to determine how star formation was initiated and how i t may proceed in
-2-CHAPTER 1
_3.:..
I. INTRODUCTION
It is well established that newly formed stars are fre-quently found in association with dense molecular clouds. Among the better known examples are the infrared cluster in Orion (Becklin, Neugebauer, and Wynn-Williams 1973; Liszt et al. 1974); the infrared sources and water maser found at the edge of the Ml7 cloud (Lada 1976; Elmegreen and Lada 1977); the compact H II regions, H
2
o
and OH masers and infrared sources located along the boundary of the molecular cloud connected with W3 (Mezger and Wink 1975; Harris and Wynn-Williams 1976), and the infrared objects, compact H II regions, H2
o
and OH masers found in the region of the Mon R2 cloud {Downes et al. 1975; Kutner and Tucker 1975; Beckwith et al. 1976).However, the way in which stars form within these
-4-To elucidate the relationship between star formation and molecular clouds, a detailed analysis of some group of newly formed stars and a related molecular cloud is required To this end, two such groups, Cepheus OB3 and Perseus OB2, were selected, and associated molecular clouds were searched for, detected and mapped in the 115 GHz line of carbon mon-oxide. Sizes and masses of the clouds were determined from measurements of both the 12
co
and 13co
lines, while their structure was investigated through the variation with posi-tion of line widths, temperatures and velocities.In view of the abundance of available data and the ex-tensive molecular observations involved in the current stud~
this paper will confine itself to a presentation of the ob-servations of Cepheus OB3 only. A detailed interpretation of these data will be carried out in Chapter 2.
II. OBSERVATIONAL SELECTION
The young OB association Cepheus OB3 was selected prima--rily because i t is young enough to be a site of recent star formation (its youngest stars are of age
~
4 x io6 years,comparable to the youngest optically visible stars in Orion OBl}, but is also sufficiently old that its primeval cloud must have evolved to some extent. Its basic properties are
-s.:...
solar neighborhood.
Cepheus OB3 is composed of two subgroups {cf. Fig. 1) of stars, the older being of age 8 x 10⁶ years and the
6
younger 4 x 10 years. This typical age difference between individual subgroups of an OB association suggests that there will be indications within any adjacent clouds of the beginnings of yet another epoch of stellar birth. At 730 pc the association is sufficiently close that the detection and measurement of infrared sources, molecular peaks and other
signposts of protostars is facilitated.
The difference between the masses of OB associations
(~
few x 103 M0) and typical molecular clouds
(~
104
- 105 M
6) can be explained if only a fraction of the cloud
material forms stars. Thus analysis of the structure of a molecular cloud after some star formation has taken place may indicate the subsequent behavior of the cloud material and in particular whether or not i t eventually disperses. Blaauw noted, and i t is clear from inspection of the Palomar Sky Atlas, that the degree to which interstellar matter
permeates OB associations decreases with association age. As might be expected, a considerable amount of interstellar material is still present in the vicinity of Cepheus OB3 so that the region is particularly suitable for studying this question of cloud evolution.
-6-properties of its stars have already been investigated in some detail. Proper motions, association rnernbership and radial velocities of the stars, as well as expansion veloci-ties of the two subgroups in Cepheus OB3 have been
de-termined by Garmany {1973). Spectral classes on the MK sys-tem were assigned by Garrison (1970) in the course of an investigation of total to selective absorption across the association. The stars have been well-studied photometri-· cally, from the original UBV measurements of Blaauw, Hiltner and Johnson {1959), through the ubvy and H8 photometry of Crawford and Barnes (1970), to the ultraviolet observations of the ANS instrument (Kester 1977)., In addition, an area of considerable extent (1
=
90° to 115°, b=
-1° to +15°) around and including Cepheus OB3 was surveyed in the 21-cm line of neutral hydrogen by Simonson and van Someren Greve(1976) • They derived a possible model of the OB association with respect to the surrounding neutral hydrogen. Finally,
to augment this already large pool of data, a search has been made by Harris (1976), in conjunction with the observa-tions described here, for compact H II regions in the neigh-borhood of Sl55, the H II region located in the southwest of Cepheus OB3.
III. CO OBSERVATIONS
-7:...
El Segundo, California was used to map a 1.5° x 4.5° area of Cepheus in the J = 1 + 0 transitions of 12co(ll5 GHz) and 13
CO(llO GHz). The telescope has a main beam efficiency of 70% and a half-power beam width 2.5 arcminutes. Most ob-servations were obtained between 1975 December and 1976 March when weather conditions were excellent with zenith optical depths of ~ 0.3 at 115 GHz and~ 0.2 at 110 GHz. Typical integration times of 10 minutes for 12co and 15 minutes for 13co were used. The single sideband system
temperature at CO frequencies using an uncooled mixer re-ceiver was ~ 1200 K. Spectral lines were detected with a 64 channel filter bank giving a resolution of 250 kHz (O.GS km
-1
s at 115 GHz) per channel. Baseline stability was achieved by frequency switching with 8 MHz separation be-tween signal a:ad reference bands. The reference line was inverted with respect to the signal and later folded with it, thereby effectively increasing the integration time. The
*
corrected antenna temperature, TA, is the temperature meas-ured by a lossless antenna above the earth's atmosphere, where
and
TB is the source brightness temperature and Tbb is the
*
the signal observed on source is corrected for atmospheric
T sec z
attenuation by multiplying by a factor of e o , where z is the zenith distance of the source observed and T is the
0
zenith optical depth. Measurements of T
0 by tipping were
made every three to four hours during each observing session. This corrected signal is scaled to the system temperature using an observing chopper at 300 K which rotated in the field of view of the feed horn. As a further check on the stability of the system Orion A was observed each day and one point of relatively strong CO emission within the cloud was monitored each hour throughout all observing runs. The
*
*
final values of TA are on a scale such that for Orion A TA (12
co)
=
70 Kand T;(13co)
=
10.9 K.a) 12
co
Observations of 12
co
were first made at spacings of ten arcminutes (i.e., four beam widths) in right ascension and declination. Mapping was continued until the boundaries of*
the cloud (defined at TA $ 2.5 K) could be specified. A primary concern of the survey was to detect small scale structure in the cloud~ and, in particular, to deter-mine the location of possible sites of star formation.
-9'-arcminutes in right ascension and declination were made about any profile which displayed these properties. The
*
usual criterion for use of this finer grid was that TA ~
10 K. This criterion incidentally selected regions dis-playing broadened or wide-winged lines for finer grid meas-ures.
Observations were also made in the directions of the OB association members. Mapping was carried out around a few of the younger subgroup stars, several of which lie within the cloud boundaries. Gas was unambiguously detected in the direction of only one older subgroup member. In a few
doubtful cases measurements 'dere made as indicated in Figure 1. As a further check for the presence of CO outside the primary cloud boundaries, but in the general vicinity of the association stars, observations at 20 arcminute spacings were made along the length of the cloud and perpendicular to
i t beyond the declination of the most northerly association member. The area encompassed by these observations is shown
in Figure 1.
-10-FIGURE 1
Areas of the sky covered by observations at various separations. A heavy solid line outlines the region where 12
co
measurements at 10' spacings were made; 2' and 20' sampled areas are bounded by dotted and dashed lines re-spectively. Measurements of 13co
at 2' spacings were made over the hatched zones. Other 13co
observations are in-dicated by filled circles where the isotope was detected and by open circles where i t was absent. The stars of the association are represented by crosses and filled triangles, crosses denoting members of the younger subgroup, andfilled triangles members of the older subgroup of Cepheus
-11:.
•
xI
.. ,.
1I
·e;-·;
~r--
---;j"--1
j ..
:•·~
QI\.I I '>Sc o Q-··u··--:
I
x·~-1
...
c,~i ·~ ~
I I
x:
~~ ~ Q :+
: "~ ::
I "' I
i
~ ~
•···•---o
I
<4 .. I 1 0- ... -0 ••I :·~····: I -c o
: ~ ~ I o
I
L. ...
J
~
o-I I
I •,. I ? ... ~ o
I ~ ... I ==· ~=--.
I
~.;
Ij
1~
~
... I :~:
L ___________ I : ... ~ .... ;
•
0 r0 (f) 0 0 0 C\J lO 00 •
..
• •
(0~61)
8
•
§:>
00
0 •
Hiltner and Johnson (1959). An effort was made to continue observations of the hot spots outwards from a central posi-tion until T:(13
co)
~
1 K. In some directions further ob-servations were made at distances of ten arcminutes from the central position in the hope of estimating the extent of the presence of 13co.
The results will be discussed in § Vb. Figure 1 illustrates how far this procedure was employed. Further 13co
observations were made where broadened or multiple lines were seen in 12co.
In cases where the 13co
line was detected to be 2 3 K some large scale mapping was
carried out.
c) High Resolution Measure~ents
Observations at higher spatial resolution are needed to clarify the nature of hot spots found in the initial Aero-space survey. These hot spots were therefore studied at 12
co
and 13
co
frequencies using the 11-meter telescope of the National Radio Astronomy Observatory at Kitt Peak,Arizona1 in conjunction with the 256 x 250 kHz filter banks.
·---·---1The National. Radio Astronomy Observatory is operated by Associated Universities for Research in l\.stronomy, Inc. 1
under contract with the National Science Foundation.
The single side-band system temperature was rv 1000 K while the half-power beam-width is rv 65 arcseconds at 115 GHz. Similar calibration procedures to those at Aerospace were
*
-13-A T:c12
co)
=
60 K (Ulich and Haas 1976). The telescope was operated in the position switching mode. Off-sourceposi-tions were typically 30 arcminutes away from the source, at locations previously determined to be free of CO emission. Useful, high resolution profiles were obtained, but detailed
*
measurements about the positions of peak TA are very
*
limited. Both with respect to line shape and to peak TA observed these profiles are in excellent agreement with those obtained in the same directions but at lower resolu-tion at Aerospace.
IV. FORMALDEHYDE OBSERVATIONS Since the presence of the JK-K+
=
212 + 111 transition
of formaldehyde is often associated with relatively high molecular hydrogen densities (nH
=
104 - 105 cm-3) (Lucas,2
Encrenaz and Falgarone 1976 and references therein), a
search was made at and around the positions of the hot spots for this 140 GHz line. The observations were made in 1976 March and 1976 May with the 5-meter telescope of the
Milli-2
meter Wave Observatory, Fort Davis, Texas operated in a
2The Millimeter Wave Observatory is operated by the Electri-cal Engineering Research Laboratory of the University of Texas at Austin.
frequency switching mode. The single side-band system temperature for H
-14-Calibration was carried out by the usual chopper wheel
tech-*
nique. Orion A, with TA(H
2
co)
=
4.8 K, was observed daily to establish a standard comparison. Measurements were made at spacings of 2 arcminutes around the positions of peak intensity to determine the sizes of the H2
co
emission regions.V. RESULTS a} 12
co
*
The velocity at which peak antenna temperature, TA(l2CO) occurs is not the same throughout the cloud, but ranges from
-1 -1
-5 km s to -15 km s ; the peak emission appears most fre-quently at velocities around -10 km
s~
1•
In Figure 2 are shown contours of peakT~(
12co)
within this velocity range. The elongation of the molecular cloud parallel to thega-lactic plane is particularly marked. Positions of the association stars with respect to the cloud are also dis-played in this figure, the older subgroup being represented by filled triangles and the younger by crosses. To facil-itate later discussion, regions of the cloud which will be referred to individually have been designated A, B, C, etc., in the figure. In Figure 3 the contours of
T~(
12co)
asshown in Figure 2 are superimposed on the Palomar Sky Survey print of the Cepheus region. The contours of Cep-B
-15-FIGURE 2
Contours of peak antenna temperatures,
T~(
12co).
As in Figure 1 the crosses and triangles symbolize the associ-ation stars. Areas Cep-A, -B, -C, -D, -E, and -F discussed in the text are indicated. At Cep-A and -B the undesignated*
0 l{)
())
ro
64° 30'
64°00
63° 30
63°00'
61° 30'
61° oo'
113° 4
!Ope
... 30
...
20
...
c 112°
111°
A ...
A
~
...I 8
...
r; (
12CO) Cepheus 083
110°
...
... ...
109°
f-J Cl
-17-FIGURE 3
*
12,.;.
r_·.
._
..
_ .. -.. , .. ,
; , _
. : ~ ...
": . . . ~· .
-18-
-19'-The maps of Cep-A, -B, -C, -D, and -E derived from higher positional sampling were found to be in good agree-ment with those determined from mapping at 10' x 10' spac-ings. Limited 2' x 2' mapping of Cep-F, however, indicates
the presence of small scale structure not shown in Figure 2. Several of the younger association members lie within the boundaries of Cep-F and i t is possible that the differences between the results of the 10' x 10' survey and the 2' x 2' measures are attributable to the presence of these stars.
A few isolated observations around a= 22h47m,
o
=
62°00' (cf. Fig. 1) near an association star reveal the presence of CO at a velocity appropriate to the primary cloud. From examination of the PSS print and the available measurements, i t seems likely that this secondary component is fairly small, perhaps comparable to Cep-B in size. The*
l '>highest values of TA(
·co)
noted are of the order of 10 K. Further mapping of this zone and of Cep-F is clearlyimportant.
Across large areas of the Cepheus cloud double, and
frequently triple, features are visible in the 12
co
profiles.*
-1Maps of TA at a number of velocities between -5 km s and -12 kn s-l were therefore constructed and are displayed in
*
-20-FIGURE 4a
Contours of T*(12
co)
at VLSR = -12.0 km s -1A
FIGURE 4b
Contours of T; C12
co)
at VLSR = -10.7 km s -1 FIGURE 4cContours of T*(12
co)
at VLSR=
-9. 4 km s -1A
FIGURE 4d
Contours of T* C12
co)
at VLSR = -8.1 km s -1A
FIGURE 4e
Contours of T*(12
co)
at VLSR = -5. 5 km s -1A
FIGURE 4f
40
63"CCI
61"00'
"''"
4b
::!
"'"
"
"00~·
..
·~·r
r: ·~co c~~s oe.3
v --120 km/sec
r ... • 12co
Cepheus 083 .,, - - 10.7 km/sec
~···~~
:L._,_ ' '
I '2J"20"' 23"1:1"' 23"!0"' 23"~"' ~3"00"' 22 11 5Y"
4c
63"30
T ,: 12CO Ceptieus 083
v--9.4km/sec
I
-21-4d
I
4e
4f
r: ·~co Cephei..s 083
v--8.1,km/sec
r: •1co c~ 083
v--5.~km/sec
z:-/'2(:1"' n'1s'"°•-:c,,tc""''"-,,,c,~.-..,.,,t:.,,..=--:,,.oe,,,.,,,--:~r,,,.=--c
-22-the sarae scale alongside -22-these figures. Maps were not
pro---1 -1
duced at VLSR rv -7 km s or VLSR < -12 km s where peaks
*
in TA occur only rarely. Evidently the cloud comprises a number of components at different velocities, each of which
follows to some degree the overall elongated pattern noted above.
It is evident from a comparison of Figures 4a through 4e and Figure 2 that the strongest emission from the region of the cloud closest to the association stars occurs at velocities near -12 km s-1• The feature observed at this velocity falls off in intensity quite rapidly, to be re-placed by emission closer to -10.7 km s-1, particularly in the vicinity of Cep-A, Cep-C and Cep-E. Emission at more positive velocities tends on the whole to be patchily dis-tributed, or at least seems uncorrelated with the positions of either the hot spots or the stars.
The range of cloud velocities observed here is well within the range of the association stellar velocities. The
stars have values of VLSR' measured with typical errors of
-1 -1 -1
±5 km s , extending in value from 0 km s to -30 km s ,
-1
with a mean of -11 km s (Garmany 1973; see also Simonson and van Someren Greve 1976) . For the eleven younger associ~
tion members for which radial velocities are available, the -1
-23-slit spectrograms, and by Georgelin (1975) from photographic Fabry-Perot interferometry, is also -15 km s-l Errors
-1
quoted are typically 4-8 km s In view of the excellent agreement between results acquired by such widely differing techniques i t is presumed that some confidence may be placed
-1
in the value -15 km s • It is notable that in Cep-B, the region of the molecular cloud closest to 8155,
emission occurs at a very similar velocity, -12
12 strong CO
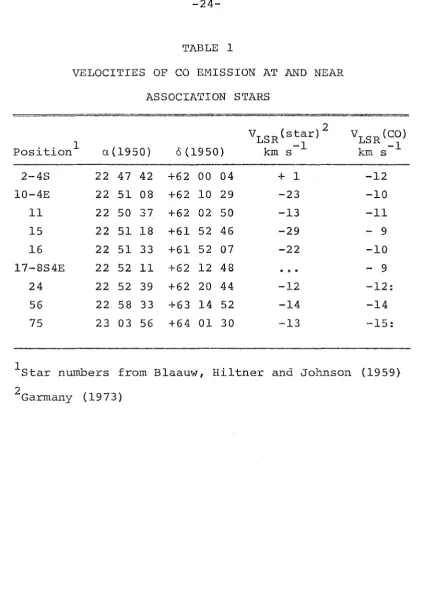
-1 km s . Several of the younger association members lie in the direction of or close to Cep-F. As may be seen from Table 1 only stars 11 and 24 have radial velocities close to those at which emission is detected from the cloud. In the direc-tion and at the velocity of both these stars the CO emission is decidedly weak (almost at the limit of detectability for 24) and quite localized. In general, emission from Cep-F
-1 -1
occurs between -8 km s and -9 km s (cf. Figs. 4c and 4d), but close to stars 11 and 24 the line profiles are distorted toward more negative velocities, presumably as a result of contamination by gas associated with the stars. Occasion-ally CO was seen near to, but not precisely in the direction of, a stellar position. In these cases a designation in Table 1 such as "17-8S4E" indicates a position 8 arcminutes
south and 4 arcminutes east of star 17.
With the exception of star 56 and possibly star 75
-24-TABLE 1
VELOCITIES OF CO EMISSION AT AND NEAR ASSOCIATION STARS
2
VLSR(CO}
1 VLSR (star)
Position a(l950) cS (1950) km s -1 km s -1
2-4S 22 47 42 +62 00 04 + 1 -12
10-4E 22 51 08 +62 10 29 -23 -10
11 22 50 37 +62 02 50 -13 -11
15 22 51 18 +61 52 46 -29 - 9
16 22 51 33 +61 52 07 -22 -10
17-8S4E 22 52 11 +62 12 48
.
~.
- 924 22 52 39 +62 20 44 -12 -12:
56 22 58 33 +63 14 52 -14 -14
75 23 03 56 +64 01 30 -·13 -15:
1
Star numbers from Blaauw, Hiltner and Johnson (1959} 2
-25-of older subgroup members -25-of Cepheus OBJ. Within the prima-ry cloud emission at such negative velocities (cf. Table l) is only observed close to the northwestern boundary.
T o summarize, . 12 CO emission at more negative ve ocities . . . 1 . . (i.e., ::;; -12 km s-1) tends to be confined to the northern edges of the cloud around Cep-B, Sl55 and close to the associ-ation stars; in the regions of broadened lines (e.g. Cep-A, Cep-C) where future star formation might be expected to take
*
place (cf. §§ VI and VII), peak TA occurs at less negative 1 "t" b t 10 k s-l and -11 km s-l
ve oci ies, e ween - m emission at
more positive velocities arises from what seem to be fairly tenuous extended regions in which there are as yet no indi-cations of star formation.
b) 13
co
In the Cepheus molecular cloud 13
co
was detected in Cep-A, -B,-c
and -D and at the positions indicated by*
filled circles in ._ igure 1. p· Detailed contour maps of TA (13CO) for Cep-A, -B and
-c
are presented in the sectionsdealing specifically with these regions (cf. §VI). Obser-vations at the locations of Cep-E and Cep-F imply that 13
co
is present to extents at least comparable with Cep-B.Insufficient measurements are available to follow the velocity patterns as closely as in § Va. Moreover, the
d f . 12 1 f
secon ary .eatures seen in CO are rare_y strong enough or
. 1 13 . . "b d 1 1 '
-26-is excellent agreement throughout the cloud between the velocities at which maxima in T:(12
co)
and T:(13co)
appear. Although multiple lines are not detected from the rarer12
isotope, at the positions where these are seen in CO weak 13
and broad CO features, encompassing the velocities of the
. 12 . . k b ,
various CO emission pea s, are o servea.
The 12
co
observations did not justify searches for 13co
at stellar positions other than those given in Table 1. De-tections were made at and around the locations of stars 11, 15 and 56, although the extent, as expected, was much less than that of 12co.
13co
was also found near stars 2, 10 and*
17. The velocity of peak TA is in all cases the same for both isotopic species.
-27-Cep-A, -B and -C were examined for 140 GHz emission from H
2
co
as described in § IV. At Cep-A and Cep-C 140 GHz H2
co
is unambiguously detected over areas approximately 6*
a.rcminutes square, with maximum values of TA(H
2
co)
'V 0.9 K*
and 0.6 K respectively. The velocities of peak TA(H
2
co},
-1
being of the order of -10 km s , are comparable with those
*
12*
13of peak TA( CO) and TA( CO). It is doubtful if H
2
co
is present at Cep-B. This result may be related to the fact*
13that values of TA( CO) observed there were considerably lower than those found at Cep-A and Cep-C.
VI. DETAILED STUDIES OF CEP-A, CEP-B, CEP-C
The regions Cep-A, -B and -C were observed at higher
1 t . . 12 d . d f h f 13 d
reso u ion in CO an examine or t e presence o CO an H
2
co
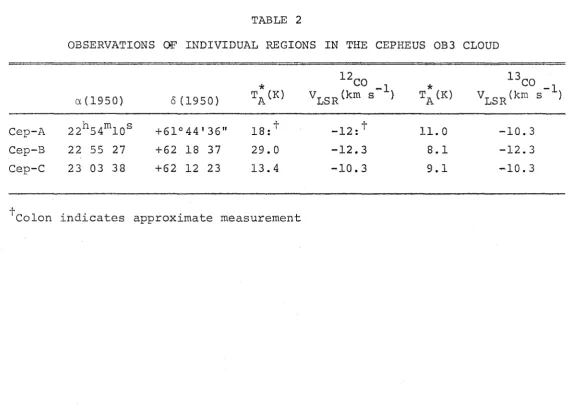
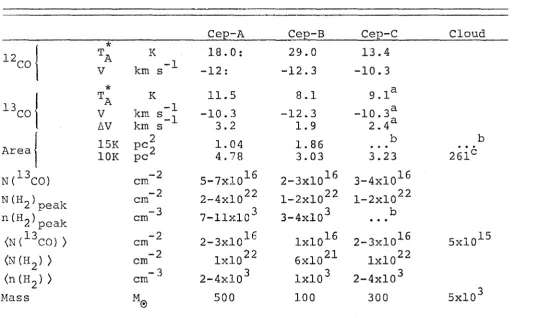
as described in §§ III and IV. Relevant parameters for each region are presented in Table 2.a) Cepheus-A
Perhaps the most interesting portion of the Cepheus OB3 cloud complex is Cep-A. In Figure 5 are shown the 12
co
and 13co
line profiles observed around the center of the zone. Over a small region these profiles are characterized by deep minima, possibly the result of self-absorption. The
TABLE 2
OBSERVATIONS OF INDIVIDUAL REGIONS IN THE CEPHEUS OB3 CLOUD
*
12co -1*
13co -1a (1950} 0 (1950) TA(K} VLSR(km s } TA (K) VLSR (km s )
Cep-A 22h54ml0s +61°44'36" 18:t -12: t 11. 0 -10.3
Cep-B 22 55 27 +62 18 37 29.0 -12.3 8.1 -12.3 I
N
Cep-C 23 03 38 +62 12 23 13.4 -10.3 9.1 -10.3 00 I
-2~-FIGURE 5 12
co
and 13
co
profiles observed about the central region of Cep-A. 2W, 2N, etc., refer to observations 2 arcminutes west of center, 2 arcminutes north of center and so on. The 12co
profiles labeled 4N2E, 4N2W, 2N4E, 2N2E and 2S2W, as well as all 13co
data, are from the12
501
I
ICep-A
j 4N2E .49
1~
_12co
··· 13co
I 481I
2N4E I 47'c 461
0
·-
+-0
c
0 61°451 Q)
0
44'
43'
421
22h55m005 505 405
l4N l4N2W
f
i\ti~
\v .
4
\~~-tr-~
.
20- 15
r·*(K)-10 A 5
~ -'w'°'?'.'{'11
0J J" I \/\A I 0
-15 -10 -5
v
LSR(km
s-1)305 20s I 05 22h54m005 50s 405
3a5
Right Ascension
I
w 0 .
-3i-instrument and at higher resolution than their 13
co
equiva-*
13lents. Contours of TA( CO) are displayed in Figure 6. Be-cause interpretation of the 12
co
profiles is complicated by the absorption feature no equivalent contours ofT;c
12co)
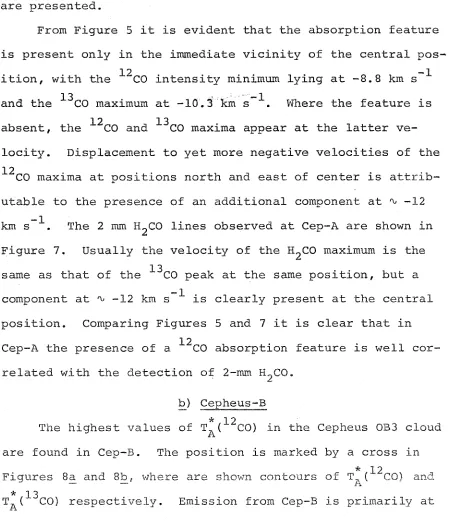
are presented.From Figure 5 i t is evident that the absorption feature is present only in the immediate vicinity of the central pos-ition, with the 12
co
intensity minimum lying at -8.8 km s-l and the 13co
maximum at -10.3k~
s-1 Where the feature is absent, the 12co
and 13co
maxima appear at the latter ve-locity. Displacement to yet more negative velocities of the1 2 CO maxima at positions nor . . . th an d eas t o f cen er is a t . t t . b ri -utable to the presence of an additional component at ~ -12
-1
km s . The 2 mm H
2
co
lines observed at Cep-A are shown in Figure 7. Usually the velocity of the H2
co
maximum is the same as that of the 13co
peak at the same position, but a-1
component at ~ -12 km s is clearly present at the central position. Comparing Figures 5 and 7 i t is clear that in
12
Cep-A the presence of a CO absorption feature is well cor-related with the detection of 2-mm H
2
co.
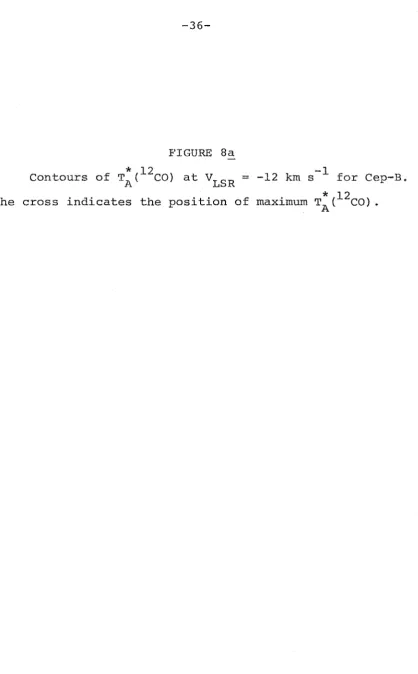
b) Cepheus-BT. he h' h ig es t va ues o 1 f TA*(12
co)
i'n the Cepheus OB3 cloud are found in Cep-B. The position is marked by a cross in Figures8~
andBb,
where are shown contours ofT:c
12co)
andA
T*(13
co)
respectively. Emission from Cep-B is primarily at
-32-FIGURE 6
*
13 -1, -
"-0 ... 1,...,~
(:S
c:
u
(L)0
I I
,.1
l
I
~...
:i:-2 ...
1
l
I '\61'50'r /
Cepheus-A
rt (
13
CO) \
I I •
t
,2'
- s -
- -
12
61°45
1I \
I _...., ... _. • .-_.. .... ta.to._ .
7 5
\
-I / ,,.... - - - \
~
I' • - - \\2
\
/ ~, .
~
' ' ,
\I - - . . _ ' \
\
---... ,a
~\
\ \
\ \
\ \
'
\HPB\N '
~',\
}, , I
.·,
22h 55m
' , I
'
'
-!-
I~
'
'
;~
'
'
~~ ~'
'
;;
'
·'-, I ...,.-",,
I22
11
54m3os
22
11
54rn
5
J
w w
-34-FIGURE 7
H
c
0
+.-0
c
u
Cl>
0
50'
49'
48'
47'
46'
61°45'
44'
43'
42'
-35-VLSR (km 5-1)
-15 -10 -5
4N2W 0.8
0.6
0 .4
T:
(K)0.2
.----.--....--....--.,...,..._,,...__,-r----r---t--+-V---t---t+!---J 0.0
2E
2S2W
..._ _ _ _____L _ _ _ _ _.____ L .__.l _ _ _ _,_J
22h55m005 505 405 30s 205 IOs 22h54moos sos
-36-FIGURE 8a
*
12
-37-\ l!)
\
-
I.()0
..
N
u
I
C\J...,
I
*
<(l-m
I (J) :J Q) ...c 0. Q) 0.____.~-.1..~---L~-L~-L-~Ll.
_ __j_---L. __j ___
L_ ..~..__
_ __,
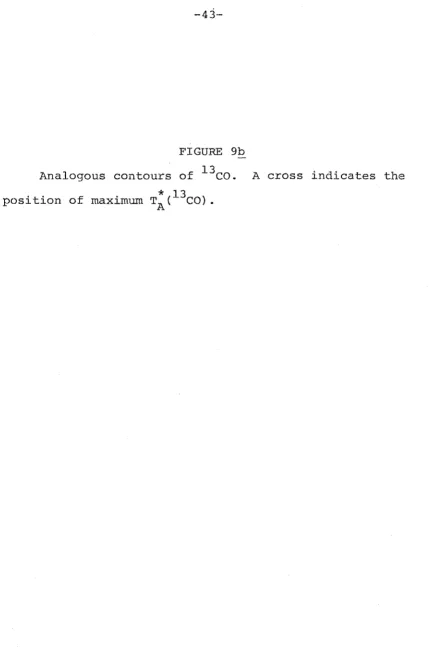
-38-FIGURE Sb
Contours of
T~(
13co)
at VLSR = -12 km A cross indicates the position of maximum-1
s for Cep-B.
~ CD
a..
I-
0
u
r<>-
-*
<(r-m
I ff) => Q)..c
a.
Q)u
-39--~--
---...----
\
)
I
I
+
\
\
LO\
C\.I.
I
I
I
I
I
I
I
I
I
l
/
\
/
/
\
/
\
/
'
/
... _ /l
0
-C\I LO
0 . 0
C\I
(Qg61)
$5
C\I<.D <.D
_J_
Cf) 00
E LO LO .c (\j C\l-
0
l{)m
en ...__
0
0
(jE
U)
. i.O
.c
-40--1
-12.0 km s , although at the boundary of the cloud itself -1
(cf. Fig. 2}, a feature at~ -15 km s remarked upon in§ V
*
12*
is evident. Over the whole region the ratio TA( CO)/TA
c
13co)
is 3 - 5, and the 12co
lines have widths athalf-maximum of between 2 and 4 km s-l Limited searches of the region have been made in the 2-rrun line of H
2
co
but no detec-tions have resulted.c) Cepheus-C
Several velocity components are visible in the 12
co
profiles observed across Cep-C (cf. Figs. 4a, b, c, d). Over most of the region only one of these components, that at -10.3 km s-1, is also seen in 13co.
Contours ofT~(
12co)
*
l3and TAC- CO) are presented in Figures 9a and 9~. Maximum values of these quantities occur at different, although
ad-jacent, positions as can be seen from the figures. The core of Cep-C probably encompasses both maxima since unambiguous detections of 2-mm H
2
co
were made at their positions. From Table 2 i t is clear that, in view of the observedT~(
12co),
the values of TA(*
13 CO) are unexpectedly high.To the north and west of the central position shown in -1
-41-FIGURE 9a
*
12 -1LI) 0 (\j <D -42-0
+
<J) 0 0 E l'0 0 ..c rt) (\j I/) 0 0 E "1'" 0LO ..c
r--.:
r0{ (\j
\
...r:ol
If>0 0 E lf) 0
-0 .;:::
r0
0 C\I
(Qg61)
~ C\l <.O-43-FIGURE 9b 13
Analogous contours of CO. A cross indicates the . . £ . *<13
o>
\
\
l
LD
.
C\J
I
\
I
I
I
0
u
t0-0
I <n :::J Q) _c 0.. Q)·u
-44-tO
--
--....
/
."""
I
I
+
\
tO
\
r--:
l
I
J
\
/
\.
/
'
_ /
/
lO'
(f)0
0
E
f'()0
..c f'() (\j U)_o
0
E .
~
0
..c
- f{)
/
N
I·
ml
0
N
(D
(C)sSI) 8
-45-measurements indicate that the rarer isotope is never more than weakly present.
VII. SUMMARY
Detailed discussion and interpretation of the observa-tions presented in this paper will be undertaken in Chapter 2. At this juncture the data will merely be swnmarized and indications will be given of the direction the analysis will take.
I t has been demonstrated that in the vicinity of the young OB association Cepheus OB3 there is a large (20 pc x 60 pc) molecular cloud complex comprising a number of com-ponents, several of which overlap in the line of sight. Emission from these components is seen at a number of
ve-locities between -5 km s-l and -15 km s-1• Such velocities lie well within the range spanned by the association stars and the H II region Sl55, confirming the relationship be-tween the cloud complex and the OB association.
Within this molecular cloud, from which Cepheus OB3 appears to have formed, three regions, Cep-A, -B and C, have particularly interesting properties. The interpretation of self-absorption profiles such as those seen in the direction of Cep-A is currently under discussion (Snell and Loren 1977; Leung and Brown 1977). It appears, however, that such
-46-typical of dark clouds heated by a single star (Milman 197Sa, b; Dickman 1975). Simonson and van Someren Greve
(1976} did in fact detect in the direction of Cep-B a small H I concentration which they concluded lay in front of SlSS and was related to the dark clouds around Cepheus OB3. Ob-servations in this direction made with the Westerbork Syn-· thesis Radio Telescope at a wavelength of 6-cm indicate the presence of a weak extended (~ 30 arcseconds) H II region suggestive of an early B star (Israel 1977} , but no other evidence for the existence of such a source in the form, for example, of an infrared object has been discovered. Searches
(to 10 f.u. sensitivity) within each region for
n
2
o
maserst h · · f k 12
c
·
·
h · ld da t e positions o- pea ,0 intensity ave yie e no detections (Knapp 1977).
Thus in the Cepheus cloud complex there is some evidence for the existence of an embedded star (Cep-B} , a region of continuing star formation (Cep-A) and a zone Cep-C, which is perhaps the precursor of regions such as Cep-A and Cep-B.
-48-HEFERENCES
Becklin, E. E., Neugebauer, G., and Wynn-Williams, C. G. 1973, Ap. J. (Letters), l.JU_, L7.
Beckwith,
s.,
Evans, N. J. II, Becklin, E. E., and Neugebauer, G. 1976, Ap. J.,2-QJL,
390.Blaauw, A. 1964, Ann. Rev. Astr. and Ap., ~, 213.
Blaauw, A., Hiltner, W. A., and Johnson, H. L. 1959, Ap. J.,
ilQ.., 69.
Crawford, D. L., and Barnes, J. V. 1970, A. J.,
25..,
952. Dickman, R. L. 1975, Ap. J., ~, 50.Downes, D., Winneberg, A., Goss, W. M., and Johansson,
L. E. B. 1975, P.str. Ap., i4_, 243.
Elmegreen, B. C., and Lada, C. J. 1977, A. J., ~, 1089. Garmany,
c.
1973, A. J.,ZJL,
185.Garrison, R. F. 1970, A. J., Z!i_, 1001.
Georgelin, Y. M. 1975, Thesis Universitie de Provence, Observatoire de Marseilles.
Harris, S. 1976, Ph.D. Dissertation, University of Cambridge.
Harris, S., and Wynn-Williams, C. G. 1976, M.N.R.A.S.,
ffi_,
649.
-49-Kutner, M. L., and Tucker, K. D. 1975, A~.,
ill_,
79. Lada,c.
J. 1976, Ap. J. Suppl., 32, 603. ,...,,...,Leung, C. M., and Brown, R. L. 1977, Ao. J. (Letters), 214, L73.
Liszt, H. S., Wilson, R. W., Penzias, A. A., Jefferts, K. B., and Wannier, P. G. 1974, Ap. J., 190, 557. ,._..,,,., Lucas, R., Encrenaz, P. J., and Falgarone, E.G. 1976,
Astr. Ap., 51, ....-.. 469 .
Mezger, P. G., and Wink, J.E. 1975, H II Regions and Related Topics, ed. T. L. Wilson and D. Downes
(New York: Springer-Verlag), p. 408. Miller, J.
s.
1968, Ap. J., 151, 473. ,..._._...,,..,,,..,,..,
Milman, A. S., Knapp, G. R., Kerr, F. J., Knapp, S. L., and Wilson,
w.
J. 1975~, A~. 1!?..Q_,
93.Milman, A. S., Wilson, W. J., Knapp, G. R., and Knapp, S. L. 1975b, A. J., 80, 101.
Simonson, S. G., and van Someren Greve, H. W. 1976, Astr.
~-,
i2_,
343.Snell, R. L., and Loren, R. B. 1977, Ap. J.,
k!:l'
122. Ulich, B. L., and Haas, R. 1976, Ap. -=-~~~--:~ J. Suppl., 30, 247. ,....,,...,Zuckerman, B., and Palmer,~- 1974, Ann. Rev. Astr. and Ap., 12, 279.
-so-CHAPTER 2
-51-I. INTRODUCTION
A molecular cloud complex related to the young OB as-sociation Cepheus OB3 has been detected. The observational data have been described in Chapter 1. Physical and kine-matical properties of this cloud complex will now be derived, and discussed in conjunction with the observed properties 0£
the association stars.
The Cepheus OB3 association is known to comprise two subgroups of stars (Blaauw 1964). Ages of these subgroups are recalculated; they are found to be of order 1-·3 x 10⁵
5
years and 5-7 x 10 years, a factor of ten lower than the values given by Blaauw (1964). Both subgroups appear to have formed at one end of the related molecular cloud.
The molecular cloud is estimated to have a mass of a few thousand solar masses, and its dimensions are 20 pc x
-52-formation is apparently taking place at only one edge of the cloud.
The properties of the molecular cloud and of the re-gions of interest mentioned above are considered in § II. In § III the membership of the OB association and of its subgroups are critically examined, and the ages and sites of origin of these subgroups determined. Current
inter-action between the association stars and the molecular cloud is analyzed in § IV. In § V are considered ways in which star formation may have been initiated in this region, and how i t propagates through the cloud. A summary and discus-sion of the results of the preceding sections are presented in § VI.
II. THE MOLECULAR CLOUD
In regions where stars have recently formed or are in the process of formation a variety of phenomena are noted in the associated molecular line observations. These in-elude above average CO temperatures, CO profiles which are broadened or which display wide wings, density enhancement
-53~
FIGURE 1
*
12Contours of peak antenna temperatures, TA( CO), for the Cepheus molecular cloud. The association stars are
113°
r; (
12CO) Cepheus 083
112°
64° 30'
!Ope
111°
64° 00 475 110°
109° 63° 3d
'"' " - I
530
oo·,
•75 ••~
I
----c
62°
30·~
,,,0
- ' .. ../ \..
---,
/
(.)1,-..._ _ _,~ ... _ J ~
0
~--, f/-~~- ~ IID (J)
GO
61° 30'
61°00'
60°30'
60°00'
[______ I
z3h 20m 23h 15m z3h 1om z3h 05m z3h oom zzh 55rn 22h 50rn 22h 45m
-55-in Figure 2 of Chapter 1, stars of the older and younger subgroups of the association are represented by filled triangles and crosses respectively. Filled squares denote possible additional members of the association. Following the terminology of Chapter 1, regions of particular inter-est are labeled -A, -B, and
-c.
Observational evidence was presented in Chapter 1 in-dicating that in this cloud there exist an embedded star
(Cep-B) , a region of continuing star formation (Cep-A) , and a zone (Cep-C) which may be the precursor of regions such as Cep-A. In regions where stars are being created i t is im-portant to ascertain how much mass is available for star formation and if the individual regions are gravitationally unstable. The properties of these areas, and of the cloud as a whole, will now be considered.
a) Densities
In Table 1 observed and derived parameters for Cep-i\, -B and -C are presented together with results for the en-tire molecular cloud. Observed properties at the positions of peak intensity in each region are reproduced from Chap~
t er 1 . T h e d erivation . . o f 13 CO co umn 1 d ensities, . . N (13 CO , ) and molecular hydrogen column densities N(H
2), will be de-scribed below. Corresponding volume densities n(12
co)
and n(H2), will also be discussed.
13
TABLE 1
REGIONAL AND CLOUD PARAMETERS
ce;e-A Cep-B Cep-C Cloud
i2co
l
*
TA K 18.0: 29.0 13.4
v
km s -1 -12: -12.3 -10.3*
9.la13co
I
TA K 11.5 8.1
-1
-10.3 -12.3 -10.3a I
v
km s_1 U1
!J.V km s 3.2 1. 9 2.4a O'I
{ I
Areaj 15K
2
1.04 1.86 b b
pc2
. . .
...
lOK pc 4.78 3.03 3.23 26lc
N (13CO) cm -2 5-7xlo16 2-3xlo16 3-4xlo16 N(H2)peak cm -2 2-4xlo22 l-2xlo22 l-2xlo22
-3 3
3-4xlo3 b
n(H2)peak cm 7-llxlO
(N(13co)) cm -2 2-3xlo16 lxlo16 2-3xlo16 5xlo15
(N (H 2) )
-2
lxlo22 6xlo21 lxlo22 cm
-3 3
lxlo3 2-4xl03
(n (H
2) ) cm 2-4xl0
-57-Footnotes to Table 1:
13 12
a - CO values at position of CO peak b No 15K contours exist.
-58-contours. The areas covered bX relev~nt contours are also given, assuming the distance to the association is 725 pc
(Crawfo~d and Barnes 1970).
There are a large number of uncertainties involved in the determination of the densities. Molecular hydrogen, the most abundant constituent of molecular clouds, is unob-servable at millimeter wavelengths. Its column density must therefore be derived from the column density of observable
12 13
molecules, usually CO and CO. The first uncertainties in the calculations are introduced in determining N(13
co),
since i t is usual to assu.i.11e that 13co
is thermalized and that the excitation temperatures of the ,T=
1 -+ O transition are. the same for 12co
and 13co.
For a region with uniform T
01 along the line of sight, where T
01 is the excitation temperature of the J
=
1 -+ 0 transition of CO,*
12Here TA{ CO) 1 hv/kT l}-1
\ e - ,
(1)
is the corrected antenna temperature, F(T)
=
Tbb is the 2.7 K background radiation and Tis the optical depth. At H
2 densities of 10 3
cm-3 or high-12
er, typical of molecular clouds, CO is thermalized and 12
-59-T(13
co)
may be determined if T01 (
12
co) =
T01 (
13
co).
The column density of 13
co
molecules in the J = O state,N
o' is related to the optical depth by
3 c 2 -hv/kT01
(2)
T \)
=
81T - 2- AN0 (1-
e )\) /), \)
where v is the frequency of the observed line, and .6v is its 64 4 3 2
frequency width at half-maximum; A = 'ff \> µ and for CO 9hc3
the dipole moment µ
=
0.112 debyes (Lovas and Tiemann 1974). Assuming a Boltzmann distribution the number of molecules in all states, N(13co),
can be obtained from the number in13 NoTOl
the ground state through N( CO)
=
2_767. The derivation of this relation requires that the sum over J be replaced by an integral in the formula for the linear molecule
parti·-oo -E /kT .
tion function, Q
=
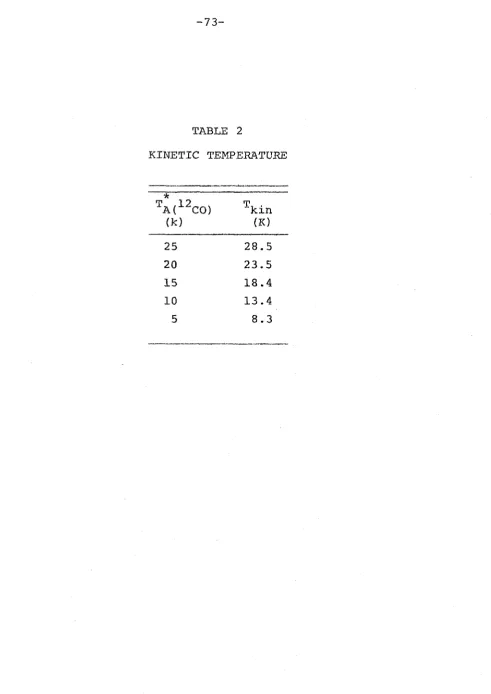
L: (2J+l)e J kin Assuming LTE holds, J=othe kinetic energy of the cloud, Tkin' is equal to T 01. EJ, the energy of the Jth rotational level is equal to
J(J+l)hB, where B is the rotation constant of the molecule. Numerical comparisons between sums and integrals over J for a number of cases demonstrate that the replacement of T
01 13
by ('11
01
+
0. 9) in this formula for N ( CO) compensates forthe approximation of the sum by an integral. Substituting for N in equation (2), and expressing the half-width in
0 .
-60...:.
2.312xlo14 T(13
co)
~v(
13co)
(TOl+0.9) -2cm ,( 3) -5.291/T
01
(1 - e )
13
where 6V( CO) is the velocity width at half-maximum of the 13
co
line.
An alternative method of obtaining N(13
co)
has been devised by Blair (1976) to circumvent the difficulty of equating T01 (
13
co)
with T 01 (
12
co).
He relates N(13
co)
toT(13
co}
through the mass absorption coefficient and finds'
(4)h f . h f . f 13 1 1 . h 1
w ere
1 is t e raction o CO mo ecu es in t e J = state. Solving the equations of statistical equilibrium and radiative transfer in a la_rge velocity gradient model
(see Snell and Loren 1977) , Blair shows that £
1 takes values between 0.26 and 0.55, approaching the former value at
densities greater than 104 cm-3.
Very similar values of N(13
co)
result from applying equations (3) and (4) to the observed data, althoughequation (3) consistently leads to slightly smaller colu..T£U1 densities. Any noticeable ranges in value are indicated in Table 1. Blair's method still requires the assumption that 13
co
is thermalized and observations indicate that3 -3
-61-f
1
=
0.26 will result in column densities which are in error by a factor of 2 at most. The column densities of Table 1 will be taken to be correct to within this factor.Computation of N(H 13
2) from N( CO) necessitates the introduction of further assumptions. Here Dickman's {1976) relation
,
(5)will be applied.
Equation (5) is based on Dickman's finding that within the range 11;to < A < 41!10 , and probably up to A.
=
1 O~O ,a
v v
linear relation,
2
cm mag (6)
exists between the visual extinction, A ·, determined from v
star counts and N(13
co),
determined as in equation (3)above. I t is known that Nt t 1/A·
=
2.50 x 10 21 cm -2 mag -1 o .a v(Jenkins and Savage 1974), where Ntotal is the total number of particles (HI, H
2, protons) in the line of sight, in lower density molecular gas and H I clouds. Therefore
21 -2 -1
1.25 x 10 mols cm mag
' (7)
and N(H
2) may be directly related to NC
13
co)
by equation (5). Values of N(H
-62-ratio pertains in the region observed and that there is complete conversion of atomic hydrogen to molecular hydro-gen in the line of sight (cf. Hollenbach et al. 1971).
This way of determining N(H
2) is more reliable than methods whose application require knowledge of such
uncer-. . . h 12 ;13 . . f .
tain guanti ties as t e CO CO .isotope ratio, the raction of carbon present in the form of CO and the C/H abundance ratio (cf. Elmegreen and Lada 1977a).
Average volume densities, (n
82), were obtained from the column densities assuming each source to have a line of
sight depth equal to the square root of the surf ace area enclosed by the 15 K contour. These are shown in Table 1. For peak values of nH the line of sight depth was taken to
2
be equal to the square root of the surface area enclosed by the contour of highest temperature in the region.
Densities were ~lso derived from formaldehyde ob-servations. 2mm H
2
co
results at the peak of Cep-A are*
given in Chapter 1. One measure of 2 cm H2
co
(TA= - 0.11 K) has been made at this position. A comparison of these re-sults with the models of Evans and Kutner (1976) implies a4 -3
peak density of ~ 6 x 10 cm . The difference between this density and that derived from 12
co
and 13co
observations,4 -3
-63-densities one hundred times higher than those determined from CO data.
Blair et al. (1977) and Wootten et al. (1977) have proposed that in the denser regions of molecular clouds 12
co,
13co,
tt2
co
and HCO+ are depleted relative to H2. Equation (5) would then be invalid in these regions. The former authors base their assertions on model fitting to observed lines in the 8140 cloud, while the latter have studied the HCO+ observations in anumber
of molecular13
clouds of different densities. They find n( CO)/n(H2}
=
2 x 10⁻⁷, as compared with Dickman's (1976) value 2 x 10⁻⁶. This degree of depletion of 13co
in the core of Cep-A would explain the disagreement between densities from H2
co
and 13co
data, since the latter determination was based on
Dick.man's relation. A value of ~ 6 x 10 4 cm -3 . is therefore accepted for the peak density in Cep-A. However, while equation (5) may be invalid in the very dense core of any region, i t is probably applicable over most of Cep-A, -B and -C, and there is no reason to doubt the average densi-ties given in Table 1.
b) Masses
-64-·
surface areas. Evans et al. (1976) have adopted a slightly different approach, determining masses from the product of the average column density and the projected surface area of the source. Both forms of mass determination were ap-plied to the data for Cep-A, -B and -C, with very similar results. These are displayed in Table 1.
The total mass of the cloud was calculated by assuming
2
that over the area bounded by the 5 K contours (261 pc )
13 15 -2
the mean CO column density
=
5.1 x 10 cm This value derives from the average of all column densities observed across the cloud, individual regions being weighted accord-ing to the square of their surface areas. The mass is also shown in Table 1.c) The Nature of Cep-A, Cep-B and Cep-C
The derived areas, densities and masses of Cep-A, Cep-B and Cep-C will now be used in conjunction with their observed intensities and line widths to justify the earlier suggestion that these regions are sites of star formation.
From Chapter 1 i t will be recalled that the 12
co
profiles in the central region of Cep-A are self-absorbed, the velocity of the self-absorption minimum being displaced from that of the 13
co
maximum by 1.4 km s-l The
-65-13
profile and its CO counterpart at the center of Cep-A are shown in Figure 2. Snell and Loren (1977) have sug-gested that such profiles are indicative of the collapse of a given region. If their hypothesis is accepted, the profiles observed across Cep-A fulfill the necessary
criteria for a collapsing region. It should, howeverF be noted that Leung and Brown (1977) have pointed out that such profiles do not necessarily indicate collapse.
Most self-absorbed profiles detected to date have been seen in the direction of embedded stars (Loren, Peters and Vanden Bout 1974; Encrenaz, Falgarone and Lucas 1975;
Kutner and Tucker 1975; Knapp et al. 1976; Loren 1976). In Cep-A there is little proof of the presence of an em-bedded star. A few minutes west of the region a feature resembling a reflection nebula is visible on the PSS plates.
0
This becomes even more apparent on plates at 8200 A. While i t may be due to an embedded protostar in Cep-A, limited searches in the near infrared have not produced corrobo-rative evidence for such a source.
Some measure of the stability of a region is given by comparing its Jeans length, ~J/
2
' with its radius.:>..J/2
( kinT . R3)1/2
~ 0.81\ M pc (Dickm~n 1976),
-66-FIGURE 2
12 13 .
CO and CO profiles observed at the center of Cep-A. Vertical lines indicate the positions of the 12
co
. . d th 13 .
f'f)
en
0
(/) :Jw
I
CLw
u
0
N0
u
N -67:_0
u
r<> ... ... 'IC..,,' "' ~ ...
0
'/
...
II
1 LO
I I
"
I
..
I--~
/ !It" / I I (.) Q)en
0
E
..x:.,
0:::
(/) _J ...
,
>
-68-I t seems likely that Cep-A is in a state of gravitational collapse, since its Jeans length is 0.5 pc, a factor of more than four less than its radius, and there is no evi-dence of an embedded source to cause internal expansion.
2GM l / 2 The free-fall velocity at its boundary, given by (~) , is 1.4 km s-1, in excellent agreement with the velocity difference between the 13
co
peak and the 12co
absorption dip. This difference is a measure of the maximum infall velocity at the edge of a cloud in which self-absorption is observed. The free-fall collapse time is of order 3xl07rn;--2
Adopting (nH )
=
4.3 x 103 cm-3 leads to "'5 x