R E S E A R C H
Open Access
Track-before-detect in distributed sensor
applications
Felix Govaers
1*, Yang Rong
2, Lai Hoe Chee
2, Wolfgang Koch
1, Teow Loo Nin
2and Ng Gee Wah
2Abstract
In this article, we propose a new extension to a Dynamic Programming Algorithm (DPA) approach for Track-before-Detect challenges. This extension enables the DPA to process time-delayed sensor data directly. Such delay might appear because of delays in communication networks. The extended DPA is identical to the recursive standard DPA in case of all sensor data appear in the timely correct order. Furthermore, an intense evaluation of the Accumulated State Density (ASD) filter is given on simulation data. Last but not least, we apply a combination of DPA and ASD on data of a real radar system and present the resulting tracks. Our experience concerning this combination is a seamless cooperation between the track initialization by DPA and a track maintenance by ASD filter.
Keywords:Track-before-detect, Out-of-sequence, Real data application, Dynamic programming approach, Accumu-lated state density, TBD, OOSM, DPA, ASD
1. Introduction
Since many years, security applications employing radar sensors for surveillance objectives are increasingly important. In situations where targets with a low signal-to-noise ratio (SNR) appear, it is convenient to apply tests on track existence utilizing raw sensor data instead of using thresholded measurements. This approach is generally called Track-before-Detect (TBD). It enables a radar system to search for low-observable targets (LOTs), i.e., objects with a low SNR. These targets can be invisible to conventional methodologies, as most of the information about them might be cut off by the applied threshold. The gain of a TBD algorithm is often paid by high computational costs. Even today, when computational power is cheap and highly available, most of the techniques for TBD still suffer from being hard to realize for a real time processing of sensor data. First and foremost, this is due to the huge amount of data to be considered in each scan.
Capacity and stability of communication channels such as 3G Networks, WLAN, HF, or WANs are subject to an ever increasing development. For many fusion applications, in particular for surveillance tracking, this enables a user to explore new approaches by exploiting
multiple sensor systems. When the link capacity is very low or temporarily unavailable, a common centralized tracking scheme is Track-to-Track Fusion (T2TF) [1]. However, T2TF neglects valuable information on LOTs, as track initialization is performed only on local sensor data. Therefore, we address the challenge of TBD and track maintenance (TM) in distributed sensor applica-tions by processing all information available depending on the available bandwidth.
Applications evolving multiple distributed sensors often suffer from effects of the communication links. The major challenge therein constitute in particular time-delayed sensor data, so called Out-of-Sequence (OoS) measurements, which appear, e.g., by timely misa-ligned scan rates, varying communication delays, or asynchronous sensors caching their data in a local sto-rage. To overcome this challenge, the Accumulated State Densities (ASDs) filter gives a neat and efficient scheme to process such OoS measurements [2-4]. Therefore, the ASDs give an optimal estimation filter for distributed sensor applications performing the TM part.
1.1. Structure
This article is structured as follows. In Sect. 2, an over-view to related work is given. The main contribution of this article is a TBD algorithm which is able to process
* Correspondence: [email protected]
1Fraunhofer-FKIE, Wachtberg, Germany
Full list of author information is available at the end of the article
OoS data sets. This algorithm is subject of Sect. 3 and has been tested intensively on real sensor data. The tracking results are presented in Sect. 4, which also includes a numerical evaluation of an ASD filter. The conclusion of this article is given in Sect. 5.
2. Related work
2.1. Out-of-sequence processing
Since the development of multi-sensor systems, the challenge of OoS processing is crucial for further devel-opment in tracking research. Bar-Shalom was the first, who picked up the problem and provided an exact solu-tion for lags which are equal or smaller than one update period [5]. He extended his approach in [6] to a multi-step lag algorithm called Al1 by applying theequivalent measurement [7,8] of recent sensor data. This enabled him to use the derived algorithm on OoS data with an arbitrary big lag, but as the equivalent measurement neglects some cross covariances, the result is not an optimal solution. Further generalizations to MHT and IMM scheme followed by various groups as [9-12].
In [13], the idea of augmenting past states and current states for a neat OoS processing occurred. This approach neglects information of current states about time-delayed measurements. In particular, when high maneuvering targets are observed, this results in a sub-optimal routine. An algorithm calculating the cross-cov-ariances for each step in between the occurring lag is given in [14]. An obvious drawback of such an algo-rithm is the number of measurements to be stored and numerical costs. In [15], past states are considered to provide a more comprehensive treatment of issues in particle filtering. A solution for OoS processing using particle filters is presented in [16].
All filter techniques presented in this work are based on the ASD. In 2009, Koch presented a closed formula for an ASD posterior [2]. His work was continued and investigated more intensively in [4]. Extensions toMHT
andIMMfiltering are given in [3].
2.2. TBD methods
There exist various methodologies to realize TBD. One can separate four different classes of them: Dynamic Programming Algorithm (DPA), Particle Filters, Hough Space Transform, and Subspace Data Fusion. Due to computational reasons, a practical application of the Hough Transform on TBD is often limited to non-man-euvering targets [17,18]. While the numerical costs of particle filters are high in general, their accuracy (in the-ory) can achieve any degree desired. Therefore, many recent research activities concentrate on this approach for TBD [19]. However, these algorithms still face the problem that it takes a long time for the modes (i.e., the tracks) to appear. The subspace approach to TBD
algebraically calculates the posterior of the emitter’s position given the sensor data with respect to properties of the antenna [20]. While the results on simulation data seem to exceed other techniques, it has not been tested on real data yet. Furthermore, the computational complexity is very high and therefore it might be diffi-cult to implement for applications with real time requirements.
The DPA approach consists of a sequential Log-Likeli-hood-Ratio (LLR) test for existing targets in each sensor cell. Unlike conventional track extraction methodologies on thresholded measurements [21], it calculates the probability of a track existence without using an esti-mated spatial covariance matrix of the target state [22]. A score which is a function of this probability is calcu-lated for each scan. Given the Markov property, this approach solves the global track search asymptotically in an efficient way. In the recent time, Orlando et al. showed that an application to an under-water sonar sys-tem is possible [23].
3. Track initiation using OoS-DPA
3.1. DPA algorithm
Assume a time series of sensor observationsZk = {z1, ..., zk} is given, where zk={y1k, . . .,yNk}is the set of
mea-sured amplitudes or SNRsyi
kin the corresponding
sen-sor bin θi, i = 1, ..., N. For a complete track
initialization, we are interested in both, the question of track existence and the associated time series of sensor binsθˆk,. . .,θˆ1for case of a positive result.
Following the description of Arnold et al. [22], we assume there is a functions(θk, ..., θ1) which is
maxi-mized by the desired sequence of states. This scoring function respects the observed signal strength and the underlying target motion. Whereas for the general solu-tion an exhaustive search over all possible combinasolu-tions is necessary, the DPA splits the scoring function into temporary elements
s(θk,. . .,θ1) =
k
i=2
si(θi,θi−1). (1)
This is possible, if the target motion is modeled as a Markov random walk of first order. Then, the solution is given by
(θˆk,. . .,θ1ˆ) = arg [max θk
{max θk−1
{sk(θk,θk−1) + max θk−2
{sk−1(θk−1,θk−2)+
. . . + max
θ1 {s2(θ2,θ1)}. . .}]. (2)
An asymptotic solution to this maximization problem can be calculated stepwise by introducing auxiliary func-tion chain {hi}i= 1, ...,k-1which is defined by the
h1(θ2) = max
θ1 s2(θ2,θ1) (3)
hi(θi+1) = max θi
{hi−1(θi) +si+1(θi+1,θi)}. (4)
For a given initializationθˆ1, we obtainθˆi, i≥2, by
ˆ
θi= arg max
θi
{hi−1(θi)}. (5) For the derivation of such a score function, we follow the idea of the conventional track extraction methodol-ogy [21] and use a sequential likelihood ratio test. Switching to the logarithmic version of it, we are able to prove the necessary splitting property of (1). To this end, we consider the following hypotheses.
•H1: θk, ...,θ1is associated to a target. •H0: There is no target.
Using the LLR test, we obtain for the cumulative scor-ing functions:
s(θk,. . .,θ1) = log
p(θk,. . .,θ1|Zk) p(H0|Zk)
. (6)
Applying Bayes’Theorem on the argument, we obtain
p(θk,. . .,θ1|Zk) p(H0|Zk)
= p(zk|θk)
p(zk|H0)
.p(θk,. . .,θ1|Z k−1)
p(H0|Zk−1)
. (7)
Because of the Markov assumption, the following equation holds.
p(θk, . . ., θ1|Zk−1) =p(θk|θk−1)p(θk−1, . . ., θ1|Zk−1). (8)
Combining the above equations yields for the cumula-tive scoring function
s(θk,. . .,θ1) = log
p(zk|θk)
p(zk|H0)
+ log(p(θk|θk−1)) +s(θk−1,. . .,θ1) (9)
=sk(θk, θk−1) +s(θk−1, . . ., θ1) (10)
= k
i=2
si(θi, θi−1). (11)
This satisfies the required assumption of (1). There-fore, the auxiliary functionshi(θi+1) are given by:
hk−1(θk) = log
p(zk|θk)
p(zk|H0)
+ max θk−1
{log (p(θk|θk−1)) +hk−2(θk−1)}. (12)
Various approaches have been discussed to estimate the signal dependent log-term of hk-1(see [24] and
lit-erature cited therein). For sensors for which the assumption of a Gaussian distributed SNR with mean ¯s and additive noise holds, the expression simplifies to
log
p(zk|θk)
p(zk|H0)
=(y
θk
k − ¯s)
2
−(yθk
k)
2
2 , (13)
whereyθk
k represents the measured SNR in sensor bin
θkrescaled such that the noise covariance is unity.
3.2. Out-of-sequence DPA
As stated in Sect. 1, low computational costs of a TBD algorithm are crucial for real applications. Therefore, it would be highly inconvenient to reprocess stored data in situations where time-delayed measurements occur, i. e., OoS data. In this section, we propose an extension to the DPA algorithm described in Sect. 3.1 such that it can update its states directly on OoS data sets. In parti-cular, we state how to establish the links between the states in order to obtain the estimated time series of binsθˆn,θˆn+1, . . ., θˆk.
3.2.1. Update of the score
Because of time limitations, it is generally not intended to retrospectively update the scores and links of the past states of time tlfor tl<tk. Therefore, the current score values for each sensor bin only reflects the exact poster-ior for a given state θkat timetk. Let us now assume a time-delayed sensor data setzmoriginating from timetm <tkoccurs. The goal is now to calculate the score condi-tioned on the new measurement data setZk, m: = Zk ∪
{zm}. As in the above scheme, we have
s(θk,. . .,θm, . . ., θ1) = log
p(θk,. . .,θm,. . .,θ1|Zk,m)
p(H0|Zk,m)
. (14)
Again, we might apply Bayes’ Theorem on the
argu-ment of the logarithm and obtain
p(θk,. . .,θm,. . .,θ1|Zk,m)
p(H0|Zk,m)
=p(zm|θm)
p(zm|H0) ·
p(θk,. . .,θm,. . .,θ1|Zk)
p(H0|Zk)
(15)
= p(zm|θm)
p(zm|H0) ·
p(θm|θk. . .,θ1)
(∗)
· p(θk,. . .,θ1|Zk) p(H0|Zk)
. (16)
The term (*) needs a fully smoothed state time series
θk, ...,θ1 for a precise calculation. However, during the
track extraction phase we might assume the target to be not maneuvering very strong. Therefore, an appropriate approximation is given by
p(θm|θk. . .,θ1)≈p(θm|θk), (17)
processing stepk. Using this approximation, we end up with a straight forward score update by the auxiliary function
hk(θm) = log
p(zm|θm) p(zm|H0)
+ max
θk {
log(p(θm|θk)) +hk−1(θk)}. (18)
Nevertheless, this score references to the states at time
tm, therefore a similar approximation might be neces-sary, if the following data set is originated at timetk+1.
3.2.2. Obtaining the links
Assume, at time tk the score hk−1(θˆk)for sensor bin ˆ
θk∈ {1, . . ., N}exceeds the thresholdμtfor track
con-firmation. If the fixed length for track initialization isk
-n+ 1, we additionally need to gatherθˆk−1, ... ,θˆn. As we
can save the backward links which carry out the maxi-mization in the auxiliary function hi-1(·), this is a trivial
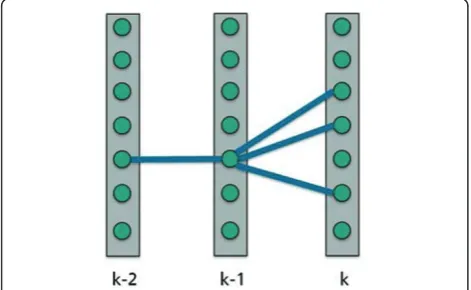
task, if all sensor data appear in the timely correct order. An example is given in Figure 1 where a time-bin diagram is shown. The three paths in this figure overlap in some parts, while their score at the most recent instant of time belongs to distinct sensor bins.
Let us now consider the OoS case. Ifμtis exceeded by the score for someθˆmreferring to timetm, we gather the sequence of states{ ˆθj}jby following the links starting at
ˆ
θm. Using the reversed order of the data appearance, this
link is always unique. Therefore, we obtain a unique track sequenceθˆk, . . ., θˆnwithtmÎ [tk,tn] by ordering the elements of the path accordingly to their instant of time of origination. This procedure is visualized in Fig-ure 2 for the timely ordered case (a) and OoS case (b).
4. Evaluation and application results
4.1. DPA evaluation
The evaluation of the OoS-DPA is separated into two parts. The first part considers the runtime duration when OoS sensor data appears in comparison to a reprocessing scheme, which starts at the last instant of time such that the remaining data can be used in the
timely correct order. The second part addresses the obtained track accuracy. To this end, the ordered DPA output is taken as a reference. For both parts, the data set provided by DSO National Laboratories from a 2D radar system is applied as input. While for the time measurements the whole set of 400 × 372 sensor bins are taken into account, the accuracy performance test concentrates on a small 10 × 10 bins subset. Processing 15 data scans in the correct order with a standard DPA algorithm yields exactly one target. By means of this result, we evaluate number, states, and processing speed estimated by the extended DPA in the OoS case.
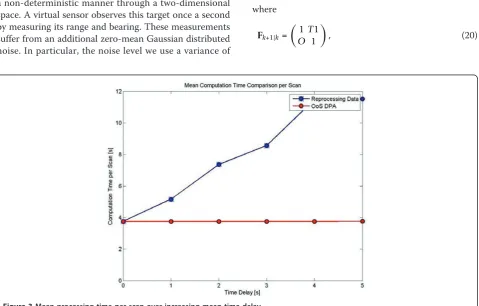
Figure 3 presents the results of processing speed for both algorithms, the reprocessing DPA and the OoS-DPA. As the reprocessing takes a lot of time, it is obvious that the speed of such a scheme is much lower than a direct update. Furthermore, the time consump-tion increases linearly in the mean time delay. This behavior, of course, is as expected.
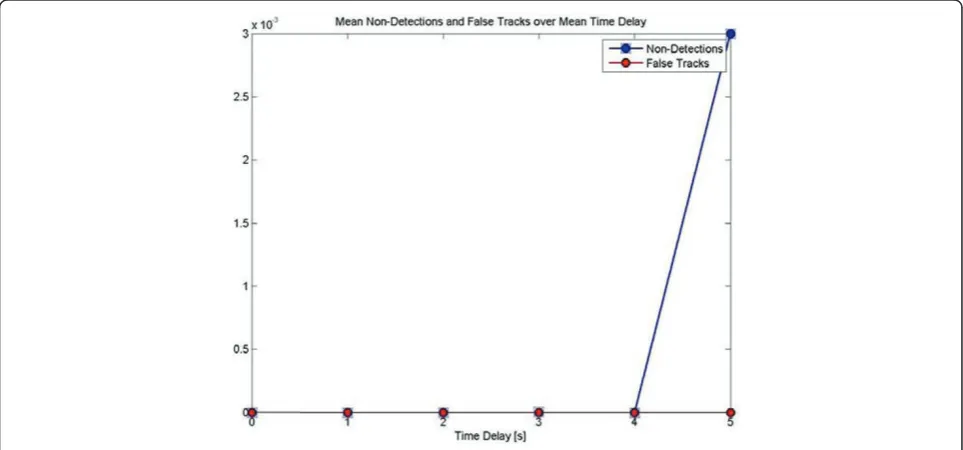
Next, we have a look at the DPA output. We examine the deviation between the ordered case and OoS case for a single target. To this end, we study a small subset of the radar data and compare the results in terms of bin deviations, non-detections and false tracks. As shown in Figure 4, the mean deviation of a track con-sisting of 15 states is up to 3 bins in the range axes. At a range bin size of 60 m, this corresponds to 180 m range off-set. The main reasons for this off-set is most probably the approximation in motion penalties men-tioned in the section above. The mean deviation on the bearing axis is below 0.5°, thus all estimated bearing bins are almost the same. Note that the deviation in both, range and bearing, are highly dependent on the observed case. However, this shows that the OoS-DPA is able to establish a target track such that it can be maintained by a tracker. Furthermore, Figure 5 shows that the chosen target was detected by the OoS-DPA in almost every run. There were only three non-detections at a mean time delay of 5s out of 1000 runs (blue line). As mentioned above, a quite small subset of 10 × 10 bins was considered for this evaluation. However, the red line shows, that there was no run with a second (false) target detection in it.
4.2. Numerical evaluation of the ASD filter
hand, the Al1 consists of the algorithm A1 from [5] applied to theequivalent measurement[7,8] of the set of sensor data since the time of the last update before the time of the OoS measurement. Therefore, it is an approxi-mation of the optimal estimate, but it does not require a storage of all sensor data. The degree of approximation depends on the level of process noise. In the evaluation below, we compare the resulting performance for different evolution noise levels.
In the following simulation scenarios, a target moves in a non-deterministic manner through a two-dimensional space. A virtual sensor observes this target once a second by measuring its range and bearing. These measurements suffer from an additional zero-mean Gaussian distributed noise. In particular, the noise level we use a variance of
σ2
ϕ = 1and σϕ2= 1millidegree2 in range and bearing, respectively. All mentioned filters are initialized with the perfect start values of the targets position and velocity. Furthermore, they use a perfect matching evolution model. For the latter, we chose aContinuous White Noise Acceleration Model[25], i.e., the transition probability density function for a given statexkat timetktoxk+1attk
+1is given by the following linear Gaussian model:
p(xk+1|xk) =N(xk+1;Fk+1|kxk,Qk+1|k), (19)
where
Fk+1|k=
1 T1
O 1
, (20)
Figure 2Links obtained by someθmwherem=k(a) andm=k- 1 (b).
Qk+1|k=q·
1
3T3·1 1 2T2·1 1
2T2·1 T·1
, (21)
T= (tk+ 1-tk). (22)
Here, the parameterq describes the speed variance for an update interval ofT= 1 s. We use the abbreviation1 for an identity matrix in the dimension 2. For each setup of this parameter, 1000 Monte Carlo simulations were run, where we tracked the target for 500 steps.
The communication link effect is simulated by an addi-tional Poisson distributed delay μkwith mean and var-iance¯kfor each measurement transfer from the sensor
to the fusion center. This causes a regular appearance of OoS measurements. After every update, we quantify the root mean squared error (RMSE) of the filters estimate according to the real target position. Furthermore, we meter the processing time of the filter for each run. This reveals the efficiency regarding to the numerical complexity of the algorithm.
Figure 4Mean track deviation for OoS-DPA.
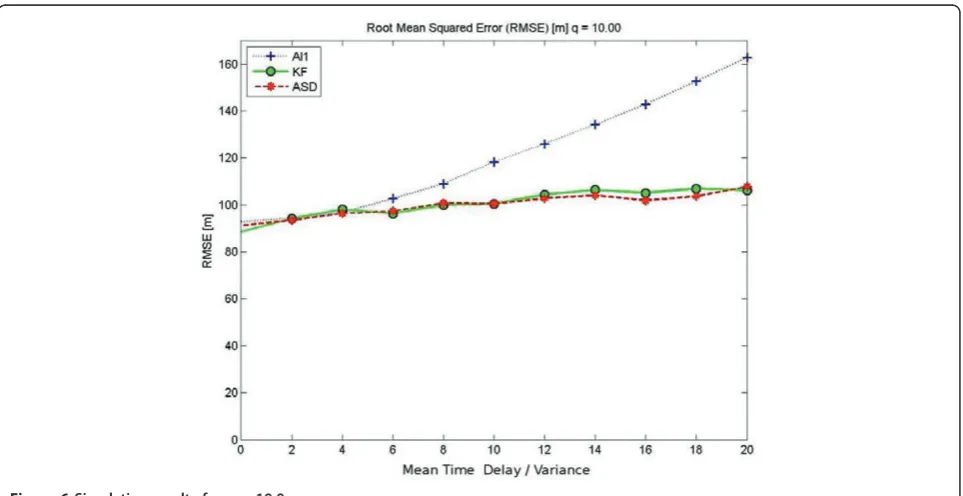
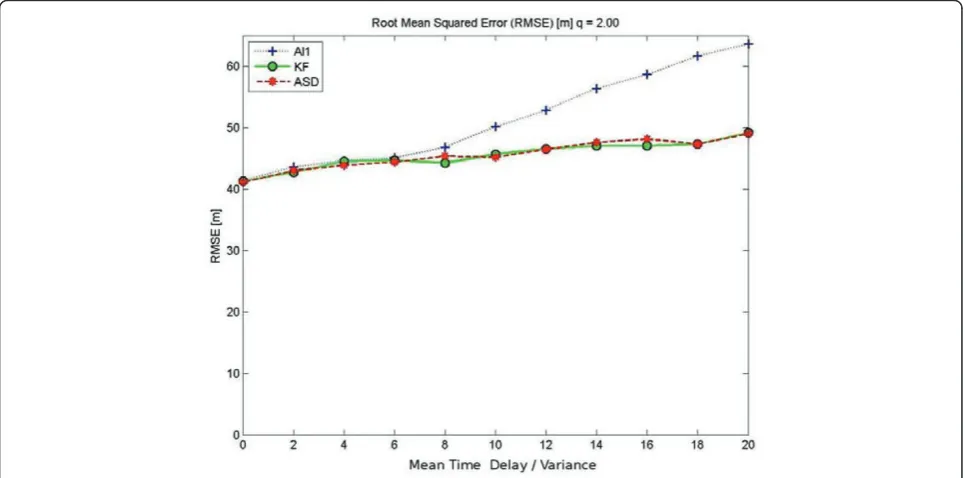
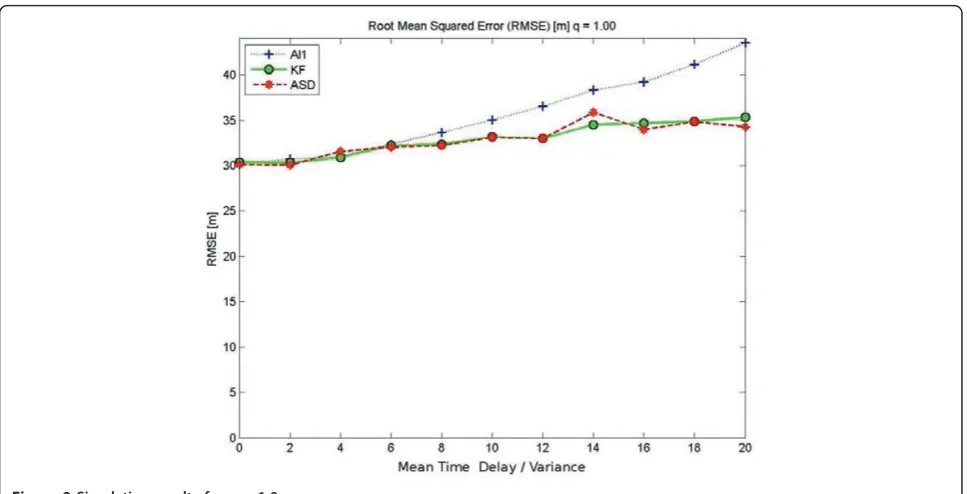
In Figures 6, 7, 8, 9, 10, and 11, the results of the
RMSE over an increasing mean time delay¯k= E[k]
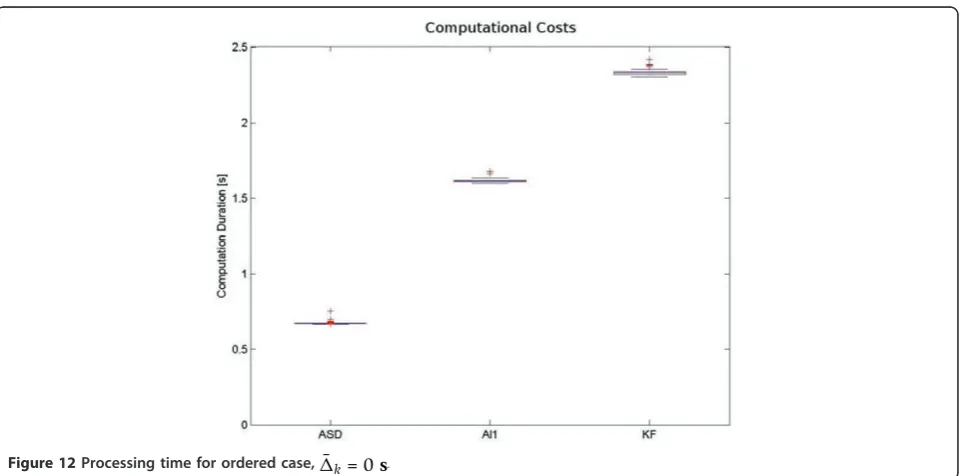
are presented. It can easily be seen that the accuracy of the Al1 algorithm decreases for stronger maneuvering targets and highly delayed measurements. For almost deterministic targets (q= 0.01), a difference in the per-formance between the three algorithms cannot be observed. In any case, the ASD filter has an equal RMSE to the reprocessing KF. However, the ASD filter is much more efficient regarding to the numerical com-plexity of the state smoothing and OoS processing. This can be seen in Figures 12 and 13, where a boxplot of the processing time is given for each algorithm. Here, one can also see that the effect of reprocessing measure-ments in this simple case (i.e., perfect data-to-target association, no false measurements, perfect detection) is very low. This effect, however, will increase in more rea-listic scenarios, where those conditions are not given. Furthermore, the advantage of a unified handling of
fil-tering and retrodictiona becomes obvious, as the ASD
algorithm handles it in less than half of the time required for a separate retrodiction.
4.3. Implementation setup for real data set
Depending on the given circumstances, either communi-cation channels might be of limited capacity, or high bandwidth links might be available. To cover these pos-sible situations, we consider three different setups:
(i) Single sensor performing TBD on a local sensor site which is connected to a Fusion Center (FC)
which maintains the tracks. OoS measurements appear due to varying delays on this link. This setup is visualized in Figure 14.
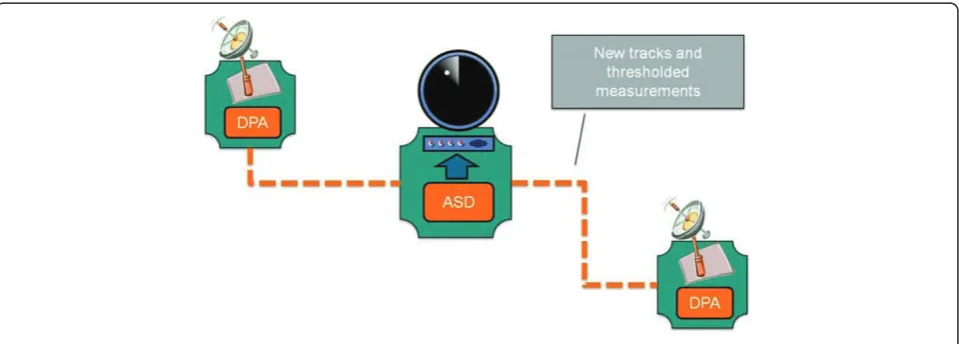
(ii) Multiple sensors with separated local TBD mod-ules connected to a FC performing an ASD (see Fig-ure 15). In this scenario, as well as in the previous one, only new tracks and thresholded measurements are sent via the network.
(iii) Sensors connected to a FC performing a centra-lized TBD methodology and maintaining the tracks. In this scenario, the raw sensor data are sent to the FC, depicted in Figure 16.
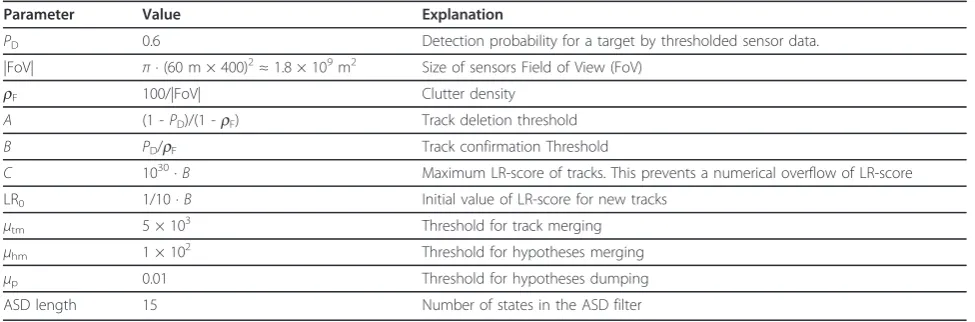
The data set used was provided by DSO National Laboratories (DSO) and consists of raw sensor data obtained by a two-dimensional radar system. It includes 389 scans, which corresponds to about 15 min at a given scan rate ofT = 2.2 s. At certain instants of time, up to ten targets can be found. The test for existing tar-gets is done by a DPA algorithm. If the test for target existence turns out with a positive result, a new track is initialized. It consists of the Least Squared Errors (LSE) approximation of the recent 15 states and is passed to the TM. This maintenance also essentially consists of a Sequential-Likelihood-Ratio test, as proposed in [21]. The result of it is called LR-scoreand depends on the choice of various parameters. Most of them will be explained below.
4.3.1. Filter parameters
Essentially, there are two thresholds A<B to test for
track continuation. A LR-score below Awill lead to a
track deletion, while a score above B indicates atrack confirmation. If the score is in between of both, the track is continued, but not be confirmed, i.e., its track-ing results are not displayed. A new track aristrack-ing from the DPA is initialized with an LR-score LR0 = 1/10 · B.
Therefore, it is not assumed to be confirmed, unless it can be observed by the TM for at least one additional
step, depending on the chosen values fortrack detection PDand the mean false measurement densityrF.
Another important parameter for TM is μtm, which
gives a lower bound for the distance of two targets before their corresponding tracks are merged. A similar threshold is given on a lower level, as we use a Multi-ple-Hypotheses-Tracker (MHT) [24] extension for the Figure 7Simulative results forq= 5.0.
ASD filter [3]. In order to keep numerical expenses at a decent level, similar hypotheses are merged, if their weighted distanced= (x1 - x2)⊤(P1+P2)-1(x1 - x2) is lower than the thresholdμhm[26]. Here, xiand Pi
repre-sent the state and the covariance, respectively, for the
ith track. Furthermore, hypotheses with a probability lower than a thresholdμpare deleted immediately.
An overview of all mentioned parameters is given in Table 1.
4.3.2. Results
In order to give a comparison in the mean tracking error, an exact ground-truth trace for some targets would be necessary. However, such a trace is not avail-able for the real data set. Therefore, we present the Figure 9Simulative results forq= 1.0.
gained tracking results assituation pictures at an arbi-trarily chosen but fixed instant of time.
4.3.3. Scenario one
At first, we have a look at the results of scenario one. Here, a Poisson distributed delay for both, measure-ments and DPA output of a single sensor, is inserted with a mean delay¯kof 0,10, and 20 s, respectively.
Fig-ure 17(a) - 17(c) and 17(d) - 17(f) shows all tracks occurring at the 300th scan, i.e., at time t = 660 s, in
range-bearing and x-y space, respectively. On the left hand, a star indicates a position of track initialization, while a diamond is set at the track deletion. A green line in between shows the trace of a target. It includes all positions obtained by processing the data arrived up to the chosen scan. Due to possible delays for¯k>0,
information contained in scans of later instants of time might be processed already. This explains why some tracks appear advanced further in comparison to the Figure 11Simulative results forq= 0.01.
Figure 13Processing time for OoS case,¯k= 20s.
Figure 14One sensor, TBD, and ASD.
ordered case(¯k= 0 s). A similar effect can be observed
in thex-y space on the right hand. Here, the red rectan-gle indicates the sensor position and estimated positions in an ASD are plotted by blue crosses. With increasing
mean delay ¯k, the accumulated state positions are
stretched further apart. This is due to the fact that the ASD contains states corresponding to a wider range of points in time.
4.3.4. Scenario two
For an evaluation of the second scenario, the data set was split up. Two sensors were simulated, the first using all even scans, the second using all odd scans. Furthermore, in order to obtain a gain of the sensor fusion on common tracks, each sensors Field of View (FoV) was restricted to a fixed part of a full circle. This is shown in Figure 18, where the filled area corresponds to the FoV.
The tracking results are given in Figure 19. As one can see, the all tracks of the optimal case, where¯k= 0,
can be recovered in the OoS cases. To this end, the fusion center benefits from both sensors without the need of storing and reprocessing data. The thresholded measurements from sensor 1 can be seen in Figure 19
(d)-19(f) as thin black dots. The effects described for scenario one apply in this situation, too.
5. Conclusion
In this article, we proposed a new extension to the DPA approach for TBD challenges. This extension enables the DPA to process time-delayed sensor data directly. These might appear because of delays in communication networks. The extended DPA is identical to the stan-dard DPA for case all sensor data appears in the timely correct order. Therefore, one might speak of a natural
extension. However, some approximations to the exact solution are necessary to prevent dramatically increasing costs on numerical power. In an evaluation on a data set of a real radar system, this approximation was shown to have at most marginal effect on the results. This is supposed to hold whenever the observed targets are in a non- or moderate-maneuvering state during the track extraction phase.
Then we numerically proved that the intensity of the process noise can have severe impact on the estimation error when using approximations. The results clearly Figure 16Multiple sensors, single TBD, and ASD.
Table 1 Parameter overview for TM
Parameter Value Explanation
PD 0.6 Detection probability for a target by thresholded sensor data.
|FoV| π· (60 m × 400)2≈1.8 × 10⁹m2 Size of sensors Field of View (FoV)
rF 100/|FoV| Clutter density
A (1 -PD)/(1 -rF) Track deletion threshold
B PD/rF Track confirmation Threshold
C 1030·B Maximum LR-score of tracks. This prevents a numerical overflow of LR-score
LR0 1/10 ·B Initial value of LR-score for new tracks
μtm 5 × 10³ Threshold for track merging
μhm 1 × 10² Threshold for hypotheses merging
μp 0.01 Threshold for hypotheses dumping
show that an ASD filter processes OoS measurements optimally in terms of a mean squared error, i.e., equiva-lent to a KF reprocessing outdated data.
Last but not least, we applied the combination of a DPA and an ASD on data of a real radar sensor system. As no ground-truth is available, we cannot derive an
estimation error. However, the situation pictures give an impression of how seamless this combination worked out. The experienced process time might be higher than a KF using Global Nearest Neighbor (GNN) [24], but it is still applicable for real time processing. Furthermore, it is clear that tracking results of an MHT is superior to the GNN scheme, because it involves all measurements within the selected gate [27]. A more profound analysis of this consideration about tracking performance and processing time is left as future work at this point.
Endnote
a
We prefer the termretrodictiontosmoothing, as it com-bines the process ofpredictionand aretrospectiveview.
¯k = ¯k =
¯k= 1 ¯k= 1
¯k= 2 ¯k = 2
Figure 17Track visualization in range-bearing space (a)-(c) andx-yspace (d)-(f) after 300 scans for various mean delays¯k. (a) ¯
k= 0s, (b)¯k= 10s, (c)¯k= 20s, (d)¯k= 0s, (e)¯k= 10s, (f)¯k= 20s.
Abbreviations
ASD: Accumulated State Density; DPA: Dynamic Programming Algorithm; FC: Fusion Center; FoV: Field of View; GNN: Global Nearest Neighbor; KL: Kalman filter; LSE: Least Squared Errors; LLR: Log-Likelihood-Ratio; LOTs: low-observable targets; MHT: Multiple-Hypotheses-Tracker; OoS: Out-of-Sequence; RMSE: root mean squared error; SNR: signal-to-noise ratio; TBD: Track-before-Detect; TM: track maintenance; T2TF: Track-to-Track Fusion.
Author details
1Fraunhofer-FKIE, Wachtberg, Germany2DSO National Laboratories,
Singapore, Singapore
Competing interests
The authors declare that they have no competing interests.
Received: 30 November 2010 Accepted: 13 July 2011 Published: 13 July 2011
References
1. F Govaers, W Koch, Distributed Kalman filter fusion at arbitrary instants of time, inProceedings of 13th International Conference Information Fusion, FUSION‘10(2010)
2. W Koch, On accumulated state densities with applications to out-of-sequence measurement processing, inProceedings of 12th International Conference Information Fusion, FUSION‘09, pp. 2201–2208 (2009) 3. F Govaers, W Koch, Out-of-sequence processing of cluttered sensor data
using multiple evolution models, inProceedings of 13th International Conference Information Fusion, FUSION’10(2010)
4. W Koch, F Govaers, On accumulated state densities with applications to out-of-sequence measurement processing. IEEE Trans Aerosp Electron Syst, to appear
5. Y Bar-Shalom, Update with out-of-sequence measurements in tracking: exact solution. IEEE Trans Aerosp Electron Syst.38(3), 769–777 (2002). doi:10.1109/TAES.2002.1039398
6. Y Bar-Shalom, H Chen, M Mallick, One-step solution for the multistep out-of-sequence-measurement problem in tracking. IEEE Trans Aerosp Electron Syst.40(1), 27–37 (2004). doi:10.1109/TAES.2004.1292140
7. JM Covino, BJ Griffiths, A new estimation method for multisensor data fusion, inProceedings of SPIE Conference on Sensor and Sensor Systems for Guidance and Navigation(1991)
8. O Drummond, Track fusion with feedback, inProceedings of SPIE Conference on Signal and Data Processing of Small Targets(1996)
9. M Mallick, Out-of-sequence track filtering using the decorrelated pseudo measurement approach, inProceedings of SPIE conference on Signal and Data Processing for Small Targets.5428, 154–166 (2004)
10. Y Bar-Shalom, H Chen, IMM estimator with out-of-sequence measurements. IEEE Trans Aerosp Electron Syst.41(1), 90–98 (2005). doi:10.1109/ TAES.2005.1413749
11. S Maskell, R Everitt, R Wright, M Briers, W Malvern, Multi-target out-of-sequence data association, inInternational Conference on Information Fusion
(2004)
12. Z Jia, A Balasuriya, S Challa, Sensor fusion-based visual target tracking for autonomous vehicles with the out-of-sequence measurements solution. Robot Autonom Syst.56(2), 157–176 (2008). doi:10.1016/j.robot.2007.05.014 13. S Challa, RJ Evans, X Wang, A Bayesian solution and its approximations to
out-of-sequence measurement problems. Inf Fusion.4(3), 185–199 (2003). doi:10.1016/S1566-2535(03)00037-X
¯k= ¯k=
¯k= 1 ¯k= 1
¯k= 2 ¯k= 2
14. M Mallick, S Coraluppi, C Carthel, Advances in asynchronous and decentralized estimation, inAerospace Conference, 2001, IEEE Proceedings.4 (2001). pp. 4/1873-4/1888
15. M Arulampalam, S Maskell, N Gordon, T Clapp, A tutorial on particle filters for online nonlinear/non-Gaussian Bayesian tracking. IEEE Trans Signal Process.50(2), 174–188 (2002). doi:10.1109/78.978374
16. M Orton, A Marrs, Particle filters for tracking with out-of-sequence measurements. IEEE Trans Aerosp Electron Syst.41(2), 693–702 (2005). doi:10.1109/TAES.2005.1468758
17. G Richards, Application of the Hough transform as a track-before-detect method, inTarget Tracking and Data Fusion (Digest No:1996/253), IEE Colloquium(Nov. 1996). pp. 2/1-2/3
18. L Wei, X Zhang, L Fan, A tbd algorithm based on improved randomized hough transform for dim target detection, in2nd International Conference on Signal Processing Systems (ICSPS).2, pp. V2-241–V2-245 (2010) 19. M Rutten, B Ristic, N Gordon, A comparison of particle filters for recursive
track-before-detect, in8th International Conference on Information Fusion.1, 7 (2005)
20. B Demissie, M Oispuu, E Ruthotto, Localization of multiple sources with a moving array using subspace data fusion”, in11th International Conference on Information Fusion, 30 June-3 July, 1–7 (2008)
21. W Koch, G Van Keuk, Multiple hypothesis track maintenance with possibly unresolved measurements. IEEE Trans Aerosp Electron Syst.33(3), 883–892 (1997)
22. J Arnold, SW Shaw, H Pasternack, Efficient target tracking using dynamic programming. IEEE Trans Aerosp Electron Syst.29(1), 44–56 (1993). doi:10.1109/7.249112
23. D Orlando, F Ehlers, G Ricci, Track-before-detect algorithms for bistatic sonars, in2nd International Workshop on Cognitive Information Processing (CIP), 180–185 (2010)
24. SS Blackman, R Popoli,Design and analysis of modern tracking systems
(Artech House, New York, 1999)
25. Y Bar-Shalom, X Li, T Kirubarajan,Estimation with Applications to Tracking and Navigation(Wiley-Interscience, New York, 2001)
26. D Salmond, Mixture reduction algorithms for target tracking in clutter, in
SPIE Signal and Data Processing of Small Targets, 434–445 (1990) 27. SS Blackman, Multiple hypothesis tracking for multiple target tracking. IEEE
Aerosp Electron Syst Mag.19(1), 5–18 (2004)
doi:10.1186/1687-6180-2011-20
Cite this article as:Govaerset al.:Track-before-detect in distributed sensor applications.EURASIP Journal on Advances in Signal Processing2011
2011:20.
Submit your manuscript to a
journal and benefi t from:
7Convenient online submission
7 Rigorous peer review
7Immediate publication on acceptance
7 Open access: articles freely available online
7High visibility within the fi eld
7 Retaining the copyright to your article