TITLE 1
Metabolic power method underestimates energy expenditure in field sport movements using a 2
GPS tracking system 3
Abstract 4
The purpose of this study was to assess the validity of a GPS tracking system to estimate 5
energy expenditure (EE) during exercise and field sport locomotor movements. Twenty-6
seven participants each completed one 90 minute exercise session on an outdoor synthetic 7
futsal pitch. During the exercise session participants wore a 5 Hz GPS unit interpolated to 15
8
Hz (SPI HPU, GPSports Pty Ltd, Australia) and a portable gas analyser (Metamax® 3B, 9
Cortex Pty Ltd, Germany) which acted as the criterion measure of EE. The exercise session 10
was comprised of alternating five minute exercise bouts of randomised walking, jogging, 11
running or a field sport circuit (x3) followed by 10 minutes of recovery. One-way ANOVA 12
showed significant (p<0.01) and very large underestimations between GPS metabolic power 13
derived EE and VO2 derived EE for all field sport circuits (% difference ≈ -44%). No 14
differences in EE were observed for the jog (7.8%) and run (4.8%) while very large
15
overestimations were found for the walk (43.0%). The GPS metabolic power EE over the 16
entire 90 minute session was significantly lower (p<0.01) than the VO2 EE, resulting in a 17
moderate underestimation overall (-19%). The results of this study suggest that a GPS 18
tracking system using the metabolic power model of EE does not accurately estimate EE in 19
field sport movements or over an exercise session consisting of mixed locomotor activities 20
interspersed with recovery periods; however is able to provide a reasonably accurate 21
estimation of EE during continuous jogging and running. 22
23
Keywords: criterion validity, intermittent exercise, excess post-exercise oxygen 24
Introduction 26
The use of global positioning system (GPS) tracking technology is now commonplace in 27
professional and semi-professional field sports around the world including cricket,1 rugby,2,3 28
soccer 4 and Australian (Rules) football.5-7 Small, lightweight and non-invasive, GPS tracking 29
systems provide information relating to training load and performance during competition.5 30
Time-motion analysis has subsequently been used to evaluate the movement demands of field 31
sport participation and to guide training prescription.8 Despite considerable time spent 32
completing low intensity activities (e.g., standing, walking, jogging), it is the high intensity 33
activities (e.g., running, sprinting, change of direction) that have been shown as critical to 34
performance.9,10 Furthermore, these high intensity activities also contribute greatly to the 35
energy demand. The energy expenditure associated with acceleration and deceleration, often 36
at low movement velocities, may be underestimated when using time-motion analysis 37
approaches based on velocity alone.11 38
The assessment of energy expenditure (EE) in the field is of both theoretical and practical 39
importance. The total energy cost of a training session or match has implications for 40
recovery, including nutrition strategies to meet or manipulate desired energy balance. 41
Unfortunately the assessment of the energy cost of high intensity exercise is problematic due 42
to the contribution of both aerobic and anaerobic metabolism. While several indirect methods 43
have been proposed to estimate energy cost, these approaches are not without their 44
limitations. Most notably, these are typically laboratory based and performed during 45
continuous and controlled exhausting bouts of exercise.12 Team sports such as soccer, rugby 46
and Australian football, however, are played in the field and are characterised by frequent 47
intermittent high-intensity running efforts.13 In an attempt to overcome some of these 48
challenges, di Prampero and colleagues14 proposed a theoretical model to estimate energy 49
analogue and as the basis for calculating instantaneous metabolic power. Accelerated running 51
on flat terrain is considered energetically equivalent to running at a constant velocity up an 52
equivalent slope. If acceleration is known, then energy cost can be determined. Measures of 53
velocity and acceleration can subsequently be used to calculate metabolic power output at 54
any given moment.14,15 55
The metabolic power model takes into account the acceleration of the athlete to give a more 56
complete assessment of the demands of field sport by incorporating the energy cost, 57
compared to traditional time-motion analysis which describes and summarises the movement 58
demands but not the energy cost. The potential benefit of using EE to provide a more 59
complete assessment of field sport demands is evident during sprinting from a stationary 60
start. Initially velocity is low, yet acceleration and therefore EE is high. As such, traditional 61
time-motion analysis based upon velocity alone would underestimate EE. An accurate 62
estimation of EE would provide a more comprehensive method of measuring the demands of 63
field sport. 64
Several recent studies have investigated the ability of the metabolic power model to estimate 65
EE compared to a direct measure of EE.16-18 Buglione and di Prampero17 as well as Stevens et 66
al.18 compared EE during continuous and shuttle runs and found an overestimation of EE 67
during constant velocity running and an underestimation during shuttle running, particularly 68
over a short distance and at high velocity. In a more applied context, the metabolic power 69
model has been adapted to provide an estimation of EE in soccer,4,19,20 rugby league21 and 70
Australian football.22 Based on instantaneous GPS derived velocity data, Gaudino et al.4 and 71
Osgnach et al.19 found that the distance covered in soccer competition and training at a high 72
intensity using a metabolic power definition was greater than distance covered at a high 73
intensity based upon a velocity based threshold. This was in contrast to Coutts et al.22 who 74
using a metabolic power definition compared to a velocity based threshold. Buchheit et al.16 76
have recently investigated the validity and reliability of the metabolic power model during 77
soccer drills with the ball, concluding that EE was largely underestimated, especially during 78
the recovery phases. As such, the authors questioned the usefulness of the method, preferring 79
locomotor data to describe the mechanical demands of training and competition, and to 80
subsequently guide training prescription related to distance, speed and 81
acceleration/deceleration. 82
These conflicting results, both in movement context and sports, suggest that further 83
investigation is warranted. The recent introduction of metabolic power estimates in some 84
commercially available GPS time-motion analysis software (GPSports, Canberra, Australia; 85
GPEXE©, Exelio srl, Udine, Italy) further support the need to assess the usefulness of the 86
metabolic power model to estimate EE in exercise and field sport locomotor movements. 87
Therefore, the aim of this study was to assess the validity of a GPS tracking system, with 88
software implementation of the metabolic power model,14,19 to estimate EE during continuous 89
walking, jogging and running, and typical field sport movements. Validity was assessed using 90
Methods 92
Twenty-seven healthy adults (15 males and 12 females, age 21.6 ± 2.7 years; height 173.8 ± 93
11.6 cm; mass 69.2 ± 11.6 kg) were recruited for this study. To be eligible, participants were 94
required to be engaged in field sport activity at least once per week. Ethical approval for the 95
study protocol was granted by the University Human Ethics Committee and written informed 96
consent was obtained from all participants. 97
Each participant completed one 90 minute exercise session on an outdoor pitch. To measure 98
velocity and acceleration, participants wore a 5 Hz GPS unit interpolated to a 15 Hz sampling
99
rate (SPI HPU, GPSports Pty Ltd, Australia) for the duration of the exercise session. To 100
reduce inter-unit variability the same unit was used for all participants. The SPI HPU was 101
worn in a manufacturer supplied harness on the upper back. During collection of data, 102
reception from at least six satellites was maintained to ensure acceptable accuracy. The data 103
from the GPS unit was downloaded into proprietary software (Team AMS, version 104
R1_2014_3, GPSports Pty Ltd, Australia) and a player profile, which included body mass, 105
was created for each participant. Energy expenditure was calculated within the software from 106
GPS derived velocity data and metabolic power estimates based on the di Prampero model,14 107
with adaptations from Osgnach et al.19 Energy expenditure data for each minute was exported 108
from Team AMS software to Microsoft Excel. 109
Indirect open-circuit calorimetry (Metamax® 3B, Cortex Pty Ltd, Germany) was used to 110
measure VO2 derived EE to validate the GPS tracking system. The Metamax® 3B was worn 111
for the duration of the exercise sessions and did not restrict or burden the participant. During 112
the exercise session the Metamax® 3B was fastened to the chest with a harness and attached 113
via a facemask. Prior to the beginning of each session the Metamax® 3B was calibrated 114
according to manufacturer instructions. Breath-by-breath data was summarised into five 115
from this the EE in kJ for each minute was derived. The one minute sample intervals for the 117
GPS and VO2 derived EE were synchronised using Microsoft Excel. 118
The test protocol was completed in one 90 minute session on an outdoor synthetic futsal 119
pitch. Participants refrained from eating and consuming caffeine for at least 2 hours prior to 120
the exercise session and refrained from exercise for 12 hours prior. Prior to the beginning of 121
the exercise session, the participant was required to be seated for 10 minutes to determine 122
resting measurements of EE for the VO2 derived EE. Mean resting EE was calculated from 123
this 10 minute period, which was subtracted from all subsequent measures of EE during the 124
90 minute exercise session. Removing resting EE in this way ensured that all subsequent data 125
used for analysis were directly related to the exercise undertaken, and is consistent with the 126
approach used by Buglione and di Prampero.17 127
The exercise session comprised of six bouts of exercise, each followed by 10 minutes of rest. 128
The exercise bouts were 5 minutes each of walking, jogging, running and three bouts of a 129
simulated field sport circuit. In total, 30 min of exercise (distance = 2460 m) was completed 130
with 60 min of recovery. The order of exercise bouts was randomised for each participant. 131
The walk, jog and run bouts were designed to replicate continuous exercise. Participants were 132
required to move in an anti-clockwise direction around the pitch for the entire five minutes at 133
a dictated velocity. The velocity of the walk, jog and run were 4 km·h-1, 8 km·h-1 and 12 134
km·h-1, with total distance covered in each 5 min bout equal to 333.3, 666.7 and 1000 m, 135
respectively. Velocities were based upon standardised ranges developed by previous work for 136
field sport athletes.23 The field sport circuit used in this study (Figure 1A) was a modified 137
version of a circuit24 designed to replicate the intermittent movement patterns of field sports. 138
Movements in the circuits were performed at self-selected speeds, guided by movement 139
descriptors (i.e., walk, jog, stride, sprint) and required acceleration and deceleration (Figure 140
m), with a short rest period (approximately 10 - 15 s) at the end of each circuit before the 142
commencement of the next repetition on the minute. 143
To evaluate the GPS metabolic power method for estimation of EE, the total energy cost of 144
the exercise needed to be measured to provide a valid criterion method. The contribution of 145
both aerobic and anaerobic energy metabolism therefore needed to be considered. It is 146
acknowledged that the time course of oxygen consumption will lag behind the instantaneous 147
metabolic power requirement and will be different dependent on the locomotor activity at any 148
given time. At the commencement of even submaximal exercise, anaerobic metabolism will 149
contribute to the energy supply until such time as a steady state VO2 is reached. In the case of 150
higher intensity intermittent exercise, with movements that include acceleration and 151
deceleration, the contribution of anaerobic metabolism will be greater, but also more difficult 152
to measure. To account for this methodological problem, the EE during 10 min of recovery 153
after each 5 min exercise bout was included in the VO2 derived EE. While the mechanisms 154
and contributing components of the excess post-exercise oxygen consumption (EPOC)25 are 155
not completely agreed upon,26 it is reasonable to assume that any elevation in VO2 above rest 156
during the 10 min recovery period was a result of the preceding exercise bout.27 As such, the 157
overall energy cost of each exercise bout was taken as the EE expenditure (minus resting 158
VO2) during the 5 minutes of exercise and the 10 minutes of recovery. Data were therefore 159
combined as exercise plus recovery (15 min in total) to account for the overall energy cost 160
associated with the exercise interval, and overcome the limitation of non-steady state during 161
intermittent, high intensity exercise. 162
Statistical analysis 163
Data were analysed in two formats as i) total session EE (90 min) and ii) six bouts of 15 min 164
(walk, jog, run, 3 x circuit). All data analysed and reported relates to the cost of exercise 165
exercise and recovery data). Energy expenditure values for GPS metabolic power derived EE 167
and VO2 derived EE for the entire 90 minute session were compared using a paired samples t-168
test. Level of agreement, accuracy and precision were obtained by calculating the 95% limits 169
of agreement (95% LoA), mean bias, percent (%) difference and effect size (Cohen’s d, with
170
associated descriptors),28,29 and root mean square error (RMSE), respectively. To determine 171
whether differences between mean biases existed between the six exercise bouts, a one-way 172
ANOVA was conducted. Games-Howell post hoc tests (due to heterogeneity of variance) 173
were used to identify where these differences lay. 174
To determine whether differences between device precision (RMSE) were evident between 175
exercise bouts, Hartley’s F-max tests30 were undertaken. Due to the multiple comparisons 176
being conducted for the F-max test and ANOVA the alpha level was adjusted to 0.01 and 177
critical values determined from existing reference tables.30 178
Analyses were performed using Microsoft Excel (Microsoft, Washington, USA, 2013), SPSS 179
(IBM, New York, USA, version 22.0) and Prism software (GraphPad Software, Inc, version 180
6, 2014). Data are reported as mean and standard deviation. 181
Results 182
The GPS metabolic power derived EE for the 90 minute session (1244.8 ± 226.1 kJ) was 183
significantly lower (p <0.01) than the VO2 derived EE (1511.5 ± 271.3 kJ). There was a mean 184
bias toward the VO2 derived EE (266.7± 151.0 kJ, RMSE = 305.1 kJ, % difference = -185
19.4%), representing a moderate effect (d = 1.07). The 95% LoA for the session ranged from 186
-562.7 to 29.3 kJ. Figure 2A (raw data) and 2B (corrected for resting metabolism) illustrates 187
minute by minute data for the 90 min session. 188
The EE (above resting) associated with each exercise bout for both GPS metabolic power 189
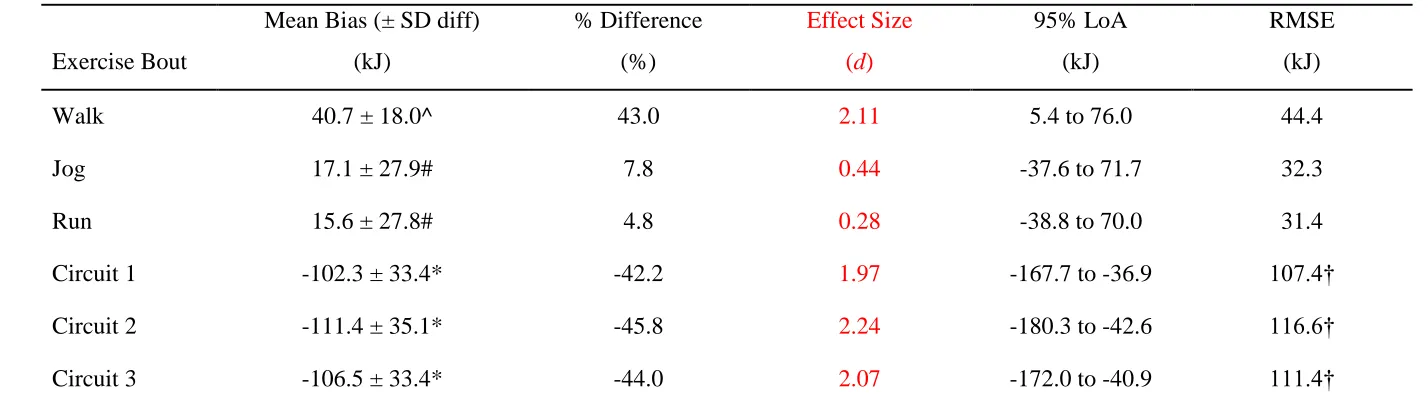
accuracy, agreement and precision for each of the six bouts. Results from the ANOVA 191
revealed that EE was significantly higher for the GPS metabolic power compared to the VO2 192
derived EE during the walk (% difference = 43.0%, d = 2.11), however it was significantly 193
lower in each of the circuit bouts (-42.2 – -45.8%, d = 1.97 – 2.24). There were no significant 194
differences between EE measured using the GPS metabolic power and VO2 derived EE for 195
the jog (7.8%, d = 0.44) or run (4.8%, d = 0.28). 196
Hartley’s test’s revealed that RMSE values for all three circuit bouts were significantly 197
higher compared to the walk, jog and run. There were no significant differences in RMSE 198
between circuit bouts or between the walk, jog and run. The mean bias for all three circuits 199
was significantly higher than the walk, jog and run. The walk had a significantly higher mean 200
bias compared to the run and jog, but a significantly lower mean bias compared to the 201
circuits. There were no significant differences in mean bias between the jog and run, and 202
between the three circuit bouts. 203
Bland-Altman plots (Figure 4) highlight the improved accuracy and agreement between GPS 204
metabolic power derived estimation of EE and VO2 derived EE during the jog and run, and to 205
a lesser extent the walk, compared to the circuit bouts. 206
Discussion 208
The purpose of this study was to assess the validity of a GPS tracking system, with associated 209
software implementation of the metabolic power model,14,19 to predict EE during exercise and 210
field sport locomotor movements. The major finding was that the GPS metabolic power 211
model was unable to accurately estimate EE during walking (a very large overestimation) or 212
intermittent movement patterns that are typical of field sports (a very large underestimation). 213
However, the GPS derived estimation of EE was reasonably accurate during steady state 214
jogging and running. 215
Two previous studies have assessed the validity of the metabolic power model for the 216
estimation of EE during continuous and intermittent shuttle runs.17,18 These reports concluded 217
that there was an underestimation in EE during shuttle running, particularly over short 218
distances at higher velocities.17,18 In a more applied approach, Buchheit et al.16 recently 219
reported an underestimation in EE during soccer training drills with the ball (23% lower 220
during the soccer circuit and 85% lower during recovery). These findings are all consistent 221
with our results for the intermittent, variable intensity field sport circuits. In contrast, 222
however, Stevens et al.18 found that the metabolic power model overestimated EE (6 – 11%) 223
during steady state continuous running at velocities between 7.5 km·h-1 and 10 km·h-1 224
whereas no differences were observed at velocities of 8 km·h-1 and 12 km·h-1 in the current 225
study. Figure 2 suggests we may have reached a similar conclusion (i.e., the estimated EE 226
being greater than the measured VO2) had the recovery EE not been included in our 227
calculations. 228
The difficulty associated with a validation study of this nature is the measurement of EE 229
during exercise that includes intermittent high intensity exercise and acceleration and 230
deceleration during running and sprinting. Stevens et al.18 used steady state oxygen 231
submaximal running velocities, the approach may not be suitable for shuttle running. 233
Buglione and di Prampero17 used oxygen consumption and blood lactate levels to give a 234
measurement of aerobic and anaerobic EE during non-steady state exercise. To overcome the 235
estimation of EE during non-steady state exercise in our study, 10 minutes of recovery was 236
included in the data analysis to capture the EPOC and to account for the overall EE 237
associated with each 5 minute exercise bout. At the completion of the 10 minute recovery 238
bout, the EE was found to be plateauing and nearing baseline levels (Figure 2B). Therefore, 239
including the 10 minutes of recovery represented a direct measure of the EE associated with 240
the exercise bout. Not measuring blood lactate levels may be considered a limitation of the
241
current study, although to include two measures that might simultaneously account for
242
anaerobic non-oxidative metabolism during exercise would not be appropriate. While the 243
EPOC is greater than the O2 deficit (i.e., a result of metabolic factors in addition to
244
phosphagen restoration and lactate removal),25 its occurrence and magnitude can be directly 245
attributed to the exercise performed26,27 and therefore represents a necessary component of 246
the energy cost associated with each exercise bout. From a practical perspective, if the energy
247
cost of exercise is to be estimated (e.g., for the purposes of energy balance and nutrition
248
strategies), the total energy consumption linked to the physical activity needs to be accounted
249
for, irrespective of its source of origin. Therefore, on the basis that this is a reasonable 250
assumption and that the measured energy cost is accurate, there are likely to be two main 251
factors that would lead to the results found in this study; the ability of the GPS device to 252
measure velocity and acceleration accurately and / or the ability of the metabolic power 253
model to accurately estimate EE. 254
As the estimation of EE is based upon GPS data, the validity of this estimation may be 255
Recent studies investigating the validity and reliability of GPS tracking systems incorporating 257
faster sampling rates (e.g. 10 Hz) to measure velocity have reported improved accuracy31,32 258
compared to previous investigations,33,34 especially with regards to movements performed at 259
higher speeds. Despite this, the intermittent and variable nature of the acceleration and 260
velocity within the field sport circuit will influence the ability of the GPS tracking system to 261
accurately estimate EE based on these measures11,35. However the magnitude of the errors 262
observed in the current study are unlikely to be explained by possible errors in GPS accuracy. 263
The very large overestimation of EE during the walk and the very large underestimation 264
during the field sport circuit suggests a level of systematic bias in the metabolic power 265
method. 266
There are a number of assumptions and limitations outlined by di Prampero et al.14,15 that 267
may impact the validity of the metabolic power model. Firstly it is assumed that the 268
biomechanics (e.g. movements of the limbs, stride frequency, mechanical efficiency) of 269
accelerated running are similar to constant speed running up an incline and the economy of 270
accelerated and decelerated running is similar between individuals, including body 271
inclination. Secondly, it is assumed that the overall mass of the runner is concentrated in the 272
centre of mass, which disregards the variable contribution of the limbs. Finally energy 273
estimates are based on reference values associated with running on flat terrain and do not take 274
into account air resistance or changes of direction. The metabolic power method represents a 275
theoretical model and as such attempts have been made to both justify14,15,17,19 and 276
challenge16 these assumptions. Of primary interest to the practitioner, however, is whether the 277
approach provides a reasonably accurate estimate of EE in situations of practical importance. 278
Our results suggest this may not be the case. 279
The GPS metabolic power approach used to estimate EE in this study demonstrated 281
unacceptable accuracy during intermittent and variable intensity movements. Consequently, 282
this approach appears to have limited utility in field sports where movements require frequent 283
changes in velocity, acceleration and direction. In contrast, the approach seems to be more 284
suitable to continuous steady state activities such as jogging and running. While the method 285
has some appeal in that it can provide a single estimate of exercise session load and the 286
associated energy expenditure, both of which can guide exercise prescription, recovery and 287
nutrition strategies, further improvements are required before the method can be used with 288
confidence in the field. 289
Metabolic power has been reported in the literature to describe and quantify movement
290
demands19-22 and may be considered another example of an arbitrary measure of external load
291
available to practitioners. However the potential loss of the underlying mechanical origins of
292
the load (i.e., speed vs acceleration/deceleration)16 as well as compounding errors (i.e., those
293
associated with both GPS technology and the metabolic power method) advise caution in its
294
use at this time. Future research should investigate whether the poor validity in field sport 295
movements observed in the current study is due to the ability of the GPS tracking system to 296
accurately measure velocity and acceleration, the ability of the metabolic power model to 297
estimate EE or a combination of both. The use of other criterion measures that are able to 298
measure both aerobic and anaerobic EE directly may also help with assessing the validity of 299
the approach. 300
Conclusion 301
The results of the current study suggest that a GPS tracking system incorporating the 302
metabolic power model is unable to provide an accurate estimation of EE during field sport 303
movements or during an exercise session consisting of mixed locomotor activities 304
interspersed with recovery periods. Despite some concerns regarding the accuracy of GPS
technology, the shift from very large overestimations (i.e., the walk) to very large
306
underestimations (i.e., the circuit) with increasing intensity suggest a systematic error in the
307
metabolic power method. Further developments in GPS hardware and software, including 308
increased sampling rates, and developments and improvements in the metabolic power model 309
References 311
312
1. Petersen CJ, Pyne DB, Portus MR, Dawson BT. Comparison of player movement 313
patterns between 1-day and test cricket. J Strength Cond Res. 2011;25(5):1368-1373. 314
2. Gabbett TJ, Jenkins DG, Abernethy B. Physical demands of professional rugby league 315
training and competition using microtechnology. J. Sci. Med. Sport. 2012;15(1):80-316
86. 317
3. Suárez-Arrones LJ, Portillo LJ, González-Ravé JM, Muñoz VE, Sanchez F. Match 318
running performance in Spanish elite male rugby union using global positioning 319
system. Isokinet. Exerc. Sci. 2012;20(2):77-83. 320
4. Gaudino P, Iaia FM, Alberti G, Strudwick AJ, Atkinson G, Gregson W. Monitoring 321
training in elite soccer players: Systematic bias between running speed and metabolic 322
power data. Int. J. Sports Med. 2013;34(11):963-968. 323
5. Hiscock D, Dawson B, Heasman J, Peeling P. Game movements and player 324
performance in the Australian Football League. Int J Perform Anal Sport.
325
2012;12(3):531-545. 326
6. Coutts AJ, Quinn J, Hocking J, Castagna C, Rampinini E. Match running performance 327
in elite Australian Rules Football. J. Sci. Med. Sport. 2010;13(5):543-548. 328
7. Gastin PB, Fahrner B, Meyer D, Robinson D, Cook JL. Influence of physical fitness, 329
age, playing experience and weekly training load on match performance in elite 330
Australian football. J. Strength Cond. Res. 2013;27(5):1272-1279. 331
8. Henderson B, Cook J, Kidgell DJ, Gastin PB. Game and training load differences in 332
elite junior Australian football. J. Sports Sci. Med. 2015;14:494-500. 333
9. Jennings DH, Cormack SJ, Coutts AJ, Aughey RJ. International field hockey players 334
perform more high-speed running than national-level counterparts. J. Strength Cond.
335
Res. 2012;26(4):947-952.
336
10. Aughey RJ. Australian football player work rate: Evidence of fatigue and pacing? Int.
337
J. Sports Physiol. Perform. 2010;5(3):394-405.
338
11. Rampinini E, Alberti G, Fiorenza M, et al. Accuracy of GPS devices for measuring 339
high-intensity running in field-based team sports. Int. J. Sports Med. 2015;36(1):49-340
53. 341
12. Gastin PB. Energy system interaction and relative contribution during maximal 342
exercise. Sports Med. 2001;31(10):725-741. 343
13. Varley MC, Gabbett T, Aughey RJ. Activity profiles of professional soccer, rugby 344
league and Australian football match play. J. Sports Sci. 2013. 345
14. di Prampero PE, Fusi S, Sepulcri L, Morin JB, Belli A, Antonutto G. Sprint running: a 346
new energetic approach. J. Exp. Biol. 2005;208(Pt 14):2809-2816. 347
15. di Prampero P, Botter A, Osgnach C. The energy cost of sprint running and the role of 348
metabolic power in setting top performances. Eur. J. Appl. Physiol. 2015;115(3):451-349
16. Buchheit M, Manouvrier C, Cassirame J, Morin JB. Monitoring locomotor load in 351
soccer: Is metabolic power, powerful? Int. J. Sports Med. 2015(EFirst). 352
17. Buglione A, di Prampero PE. The energy cost of shuttle running. Eur. J. Appl.
353
Physiol. 2013;113(6):1535-1543.
354
18. Stevens T, de Ruiter C, van Maurik D, van Lierop C, Savelsbergh G, Beek P. 355
Measured and estimated energy cost of constant and shuttle running in soccer players. 356
Med. Sci. Sports Exerc. 2015;47(6):1219-1224.
357
19. Osgnach C, Poser S, Bernardini R, Rinaldo R, di Prampero PE. Energy cost and 358
metabolic power in elite soccer: a new match analysis approach. Med. Sci. Sports
359
Exerc. 2010;42(1):170-178.
360
20. Ardigò LP, Padulo J, Zuliani A, Capelli C. A low-cost method for estimating energy 361
expenditure during soccer refereeing. J. Sports Sci. 2015;33(17):1853-1858. 362
21. Kempton T, Sirotic AC, Rampinini E, Coutts AJ. Metabolic power demands of rugby 363
league match play. Int. J. Sports Physiol. Perform. 2015;10(1):23-28. 364
22. Coutts AJ, Kempton T, Sullivan C, Bilsborough J, Cordy J, Rampinini E. Metabolic 365
power and energetic costs of professional Australian Football match-play. J. Sci. Med.
366
Sport. 2015;18(2):219-224.
367
23. Dwyer DB, Gabbett TJ. Global positioning system data analysis: Velocity ranges and 368
a new definition of sprinting for field sport athletes. J Strength Cond Res.
369
2012;26(3):818-824. 370
24. Bishop D, Spencer M, Duffield R, Lawrence S. The validity of a repeated sprint 371
ability test. J. Sci. Med. Sport. 2001;4(1):19-29. 372
25. Gaesser GA, Brooks GA. Metabolic bases of excess post-exercise oxygen
373
consumption: a review. Medicine and science in sports and exercise.
1984;16(1):29-374
43.
375
26. Børsheim E, Bahr R. Effect of exercise intensity, duration and mode on post-exercise 376
oxygen consumption. Sports Med. 2003;33(14):1037-1060. 377
27. Laforgia J, Withers R, Gore C. Effects of exercise intensity and duration on the excess 378
post-exercise oxygen consumption. J. Sports Sci. 2006;24(12):1247-1264. 379
28. Cohen J. Statistical power analysis for the behavioral sciences. 2nd ed. Hillsdale, NJ:
380
Lawrence Erlbaum; 1988.
381
29. Hopkins WG. A scale of magnitudes for effect statistics. A New View of Statistics 382
2002; http://www.sportsci.org/resource/stats/effectmag.html. 383
30. Sachs L. Applied statistics: A handbook of techniques. 2nd ed: Springer; 1984. 384
31. Johnston RJ, Watsford ML, Pine MJ, Spurrs RW, Sporri D. Assessment of 5 Hz and 385
10 Hz GPS units for measuring athlete movement demands. Int J Perform Anal Sport.
386
2013;13(1):1-1. 387
32. Castellano J, Casamichana D, Calleja-González J, San Román J, Ostojic SM. 388
Reliability and accuracy of 10 Hz GPS devices for short-distance exercise. J. Sports
389
Sci. Med. 2011;10(1):233-234.
390
33. Jennings D, Cormack S, Coutts AJ, Boyd L, Aughey RJ. The Validity and Reliability 391
of GPS Units for Measuring Distance in Team Sport Specific Running Patterns. Int. J.
392
Sports Physiol. Perform. 2010;5(3):328-341.
34. Coutts AJ, Duffield R. Validity and reliability of GPS devices for measuring 394
movement demands of team sports. J. Sci. Med. Sport. 2010;13(1):133-135. 395
35. Buchheit M, Al Haddad H, Simpson BM, et al. Monitoring accelerations with GPS in 396
football: Time to slow down? Int. J. Sports Physiol. Perform. 2014(9):442-445. 397
Table 1. Accuracy (mean bias, % difference, effect size (Cohen’s d), agreement (95% LoA) and precision (RMSE) of energy expenditure 399
measurements for each 15 minute bout (5 minute exercise plus 10 minute recovery). Data compare GPS metabolic power derived energy 400
expenditure against VO2 derived energy expenditure as the criterion measure. Positive values indicate an overestimation by the GPS metabolic 401
power model and negative values an underestimation. 402
Exercise Bout
Mean Bias (± SD diff)
(kJ)
% Difference
(%)
Effect Size
(d)
95% LoA
(kJ)
RMSE
(kJ)
Walk 40.7 ± 18.0^ 43.0 2.11 5.4 to 76.0 44.4
Jog 17.1 ± 27.9# 7.8 0.44 -37.6 to 71.7 32.3
Run 15.6 ± 27.8# 4.8 0.28 -38.8 to 70.0 31.4
Circuit 1 -102.3 ± 33.4* -42.2 1.97 -167.7 to -36.9 107.4†
Circuit 2 -111.4 ± 35.1* -45.8 2.24 -180.3 to -42.6 116.6†
Circuit 3 -106.5 ± 33.4* -44.0 2.07 -172.0 to -40.9 111.4†
^ indicates significant difference from jog, run and circuit 1, circuit 2 and circuit 3, p <0.01 403
* indicates significant difference from walk, jog and run, p <0.01 404
# indicates significant difference from walk, circuit 1, circuit 2 and circuit 3, p <0.01 405
† indicates significant difference from walk, jog and run, p <0.01 406
SD diff, standard deviation of the difference; 95% LoA, 95% limits of agreement; RMSE, root mean square error 407
Cohen’s d interpreted as small (>0.2 – 0.6), moderate (>0.6 – 1.2), large (>1.2 – 2.0), very large (>2.0 – 4.0)29
408
Figure Legends 410
Figure 1. A. Field sport circuit designed to replicate the intermittent movement patterns of 411
field sports. Modified from Bishop, Spencer, Duffield, & Lawrence, (2001); B. Speed profile 412
(GPS data) of the field sport circuit over five repetitions. 413
414
Figure 2. GPS metabolic power (GPS-MP) estimate of minute by minute energy expenditure 415
(kJ) compared against indirect calorimetry (VO2) for the 90 minute exercise session. A. Total 416
energy expenditure including resting energy expenditure; B. Energy expenditure minus 417
resting values. Exercise bouts were randomised, yet are ordered here for ease of 418
interpretation. 419
420
Figure 3. Comparison between GPS metabolic power (GPS-MP) estimates of energy 421
expenditure (kJ) and indirect calorimetry (VO2) for each 15 minute bout (5 minute exercise 422
plus 10 minute recovery) for exercise and field sport circuits. Data are Mean ±SD. * 423
significant difference (p < 0.01). 424
425
Figure 4. Bland-Altman plots illustrating the difference between energy expenditure (kJ) 426
determined by the GPS metabolic power model and VO2 (y-axis), and the criterion measure 427
of energy expenditure (VO2; x-axis) for each 15 minute bout (5 minute exercise plus 10 428
minute recovery). Dotted lines: mean bias; dashed lines: 95% limits of agreement. 429
430