Virtual Instrument Based Liquid Level
Control System
Kritjay Rajput
1, Vinod Kumar Giri
2PG Student [C&I], Dept. of EE, M.M.M.U.T., Gorakhpur, Uttar Pradesh, India1
Professor, Dept. of EE, M.M.M.U.T., Gorakhpur, Uttar Pradesh, India2
ABSTRACT: This paper describes about the realization of liquid level control system, which is used in many process control applications. System realization uses the virtual instrument as a developing method, LabVIEW as the developing environment and PID controller for control action of system. simulated result in LabVIEW shows how system response is improved using PID controller parameters. It also gives formulation of system model and software design of liquid level control system.
KEYWORDS:Liquid level control system, PID controller, LabVIEW
I.INTRODUCTION
The control of liquid level in tanks and flow between tanks is a basic problem in the process industries. The process industries require liquids to be pumped as well as stored in tanks and then pumped to another tank. Many times the liquids will be processed by chemical or mixing treatment [1-2] in the tanks, but always the level of fluid in the tanks must be controlled and the flow between tanks must be regulated. It is essential for control system engineers to understand how tank control systems work and how the level control problem is solved. Most of the control performances in the actual design are usually defined by overshoots, rising time, settling time, steady state error etc. mathematical modeling of SISO (Single Input Single Output) water tank and simulation in close loop control system is discussed in [9-11].
The design and analysis of conventional control systems are based on their mathematical models, which are usually very difficult to achieve. Proportional-Integral-Derivative (PID) controller is the simple, reliable and accurate used in industrial feedback control loops. The performance analysis of PID controller has been discussed in [4-6]. It also the most adopted controllers in the industry due to the good cost and given benefits to the industry [7]. Many nonlinear processes can be Controlled using the well known and industrially proven PID controller [8].
With the rapid development of modern software/hardware technologies, the intelligence and virtualization of instruments have become future developing directions for various laboratories and research institutions. In the field of automation and test instruments, the emerging of virtual instrument concept is an important breakthrough for the concept of traditional instruments, thoroughly breaks the traditional pattern that instruments were defined by producers and users could not change them, makes users integrate data acquisition and analysis, instrument control, hardware and available instrument equipment to create the virtual instrument control system in full compliance with their special demands [12-14]. LabVIEW software platform developed by NI(National Instruments) is a virtual instrument software platform based on graphical programming and using it to develop various instruments and virtual circuits has a unique features. It has a very rich and flexible user interface, can be combined with many programming languages, supports many network environments and is widely used in industrial control field, engineering projects of measurement and simulation and so on. It uses software to implement hardware circuits and various instruments, so low cost, high flexibility and short project developing period make its practical value in engineering very strong.
This paper is organized as follows. Section II describes the general formulation of the tank level system model. In section III, PID controller design is described. Section IV presents the software design of the liquid level control system. Section V shows the simulation results and describes about the responses of the tank level process. Finally, the conclusions are given in Section VI.
II.GENERAL FORMULATION OF THE SYSTEM MODEL
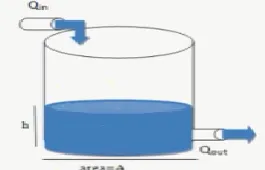
The SISO tank system [3] is shown in fig. 1. In the figure, qin is the input flow to the tank where as h is the out level for
the tank system.
For simulating the single input single output (SISO) tank system, its mathematical model [1] can be developed. The system is designed according to the mathematical model. For developing the mathematical model for SISO tank system, the density of liquid in the inlet, in the outlet and in the tank is assumed to be same and also the tank has straight vertical walls.
Fig. 1: Single input single output tank (SISO tank)
The notations used in modeling the SISO tank system are qin = Inlet volumetric flow rate [m3/sec]
qout = Outlet volumetric flow rate [m3/sec]
h = Height of liquid in the tank [m] ρ = Liquid density [Kg/m3
]
A = Cross sectional area of the tank [m2]
The mathematical model of the tank system is derived using the Mass balance equation as
( )
( )
( )
in out
dm t
q t
q
t
dt
(1)Water is pumped into the tank at the top at rate of flow of qin cubic metres per second. Water is flowing out of the tank
through a hole in the bottom of the tank of area a. The rate of flow of water through the hole is according to the Bernoulli equation given by
2
out
q
a
gh
(2)Where, h is level of tank and g is the acceleration of gravity. Conservation of mass yields the equation
2
in out in
dh
A
q
q
q
a
gh
dt
(3)The SISO tank system is designed according to the model in (3). The mathematical block diagram for the model in (3) is shown in the Fig. 2
If the process is initially at steady state, the inlet and outlet flow rates are equal. If the inlet volumetric flow rate is suddenly increased while the outlet volumetric flow rate remains constant, the liquid level in the tank will increase until the tank overflows. Similarly, if the outlet volumetric flow rate is increased while the inlet volumetric flow rate remains
constant, the tank level will decrease until the tank is empty.
III.CONTROLLER DESIGN
PID controllers are widely used in industrial applications despite continued advancement in control technology. Most of the industrial loops are controlled by PID regulators due to their simple structure which is easy to be understood by the engineers who design it. The algorithm provides adequate performance in the vast majority of applications.
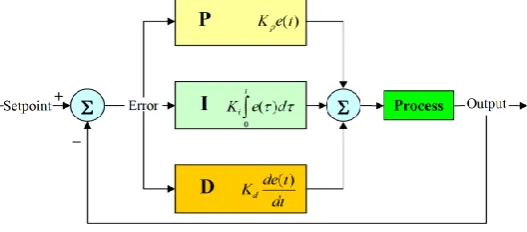
The PID controller tuning is method of computing the three control parameters Proportional gain, Derivative time and Integral time, such that the controller meets desired performance specification (Fig. 3).
Fig. 3: Block diagram of PID Controller
The governing equation of PID controller is
( )
( )
( )
( )
PID p p i p d
de t
m
t
K e t
K K
e t dt
K K
dt
(4)The PID controller output in terms of Laplace transform can be written as
. .
ip d
K
T F
K
K s
s
(5)A proportional controller can reduce the rise time and steady-state error but cannot remove it. An integral controller eliminates the steady-state error, but makes the transient response worse. A derivative controller improves the stability of the system, reduces the overshoot, and improves the transient response.
Effects of each of controllers Kp, Kd, and Ki on a closed-loop system are summarized in the table shown below.
Changing one of these variables can change the effect of the other two. For this reason, the table should only be used as a reference while determining the values for Kp, Ki, Kd.
PARAMETERS RISE TIME OVERSHOO
T
SETTLING
TIME
S-S ERROR
Kp Decrease Increase Small change Decrease
Ki Decrease Increase Increase Eliminate
Kd Small
change
Decrease decrease Small
change
IV.SOFTWARE DESIGN OF THE LIQUID LEVEL CONTROL SYSTEM
A. Front Panel Design of Liquid Level Control System
The front panel of LabVIEW is known as “panel” in short. It is a LabVIEW term for user interaction interface. The panel contains two objects namely controls and indicators.
The front panel design is shown in fig.4, the left is a simulating liquid container controlled by PID controller, the PID control value regulates the inflow into the system and the liquid level height is sensed and tested with the liquid level sensor. The left numeric control of the container is the level value set-up, PID controller controls the inflow of liquid on the basis of this set value. In the course of program, this set value can be changed digitally at any time. Above the container pump flow rate gauge shows the output of pump. Pump run indicator shows that pump is running or not. The left knobs to container are PID parameters knobs. PID parameters can be adjusted by moving these knobs. In addition, the right graph on the panel can display the control states of the system. User may observe the effect of PID controller by changing the PID parameters.
Fig. 4: Front panel of PID liquid level control system
B. Program Diagram Design of Liquid Level Control System
Based on system functional requirements and LabVIEW programming features of structured, decomposing the system functions gradually. Program diagram is shown in figure. 5.
Fig. 5: Program diagram of PID liquid level control system
V. SIMULATION RESULTS AND DISCUSSIONS
In the course of design, in order to obtain the best control effect, it is needed to regulate the various PID parameters, which is called the setting of PID parameters. The process of setting PID parameters is as follows:
Setting the proportion. Making the proportional parameter to vary from small to large and observing the corresponding system response till getting the response curve with fast reflection and small overshoot. If the system has no static errors or static errors are small to the allowable range meanwhile the response curve is satisfactory, only the proportional regulator is needed.
system dynamic performance. In this course, changing the proportion coefficient and integral time again and again according to the status of system response curves to acquire satisfactory control process and setting parameters.
If the satisfactory results cannot be obtained after regulating system dynamic process more and more in the regulating process mentioned above, the differential part should be added. Firstly setting differential time to zero, then increasing the time gradually, meanwhile changing the proportion coefficient and the integral time correspondingly, trying and testing repeatedly, eventually the satisfactory regulating effect can be acquired.
Figure.6 shows the relationship between system output control curves and various setting parameters.
Figure.6(a) shows the performance of proportional controller. By using proportional controller we reduced the rise time. The use of proportional controller decreased the settling time and increased the overshoot by small amount.
(a) Kp=10.6, Ki=0, Kd=0
Figure.6 (b) shows the performance of proportional-integral controller. The plot shows that integral controller also reduced the rise time increased the overshoot same as the proportional controller does. The integral controller also eliminated the steady state error.
(b) Kp=10.6, Ki=.035, Kd=0
(c)Kp=10.6, Ki=0.035, Kd=.01
Fig.6: Relationship between system output control curves and various Setting parameters
If system is only with proportional gain shows certain overshoot and steady state error. If system is with both proportional and integral gain shows certain overshoot only, eliminate steady state error. If system is with all three gains improving overshoot, steady state error and settling time of the system.
VI.CONCLUSIONS
In the courses of developing liquid level control based on LabVIEW, the system realizes the control to liquid level object and gives the response curve of the output parameters. This work presents the control of level in a single tank using PID controller. System response indicates how PID controller is advantageous for liquid level system. Also system has strong ability to adapt to changes of the system parameters. The future scope of this work is realizing the system with fuzzy PID controller and the rejection of disturbance enters into the system as well as its real time implementation.
REFERENCES
[1] K. Ogata, “Modern Control Engineering”, 4th ed. Pearson Education Pvt. Ltd., New Delhi, 2005.
[2] B. W. Bequette, Process Dynamics: Modelling, Analysis and Simulation. Prentice Hall, 1998. [3] Staffan Grundberg, “Tank level control”, applied physics and electronics Umea university, 2007.
[4] Z. Yu, J. Wang, B. Huang and Z.Bi “Performance assessment of PID control loops subject to Setpoint changes,” J. of Process Control, vol. 21, pp. 1164-1171, 2011.
[5] R. Vilanova, “IMC based Robust PID design: Tuning guidelines and automatic tuning,” J. of Process Control, vol. 18, pp.61-70, 2008. [6] C. C. Hang, “Improvement of transient response by means of variable set point weighting,” IEEE Trans. on Ind. Electron., vol. 43, pp. 477-484,
1996.
[7] Aurelio Piazzi and Antonio Visioli, A Noncausal Approach for PID control, Journal of Process Control, 4 March 2006.
[8] S. Gerks¡ic¡ et al. / Control Engineering Practice 14 (2006) 935–948, Advanced Control Algorithms Embedded in a Programmable Logic Controller, 22 July 2005.
[9] Héctor Bastida,Pedro Ponce, Ricardo Ramírez and Arturo Molina, Model and Control for Coupled Tanks using Labview. International Conference on Mechatronics, Electronics and Automotive Engineering 2013.
[10] N. Serhat Gunes and A. Uraz, “Two Degree of Freedom Control of a Liquid Tank”, Canadian Journal on Electrical and Electronics Engineering, vol. 1, no. 3, April, 2010.
[11] H. M. Chen, Z. Y. Chen, “Design of a Sliding Mode Controller for a Liquid Tank Level Control System”, IEEE Proceeding of International Conference on Innovative Computing, Information and Control, Sept. 4–7, Kumamoto, Japan, 2007.
[12] E.K. R´ezaei and S.R. Kolla, “Internet-based ON/OFF controller using LabVIEW”, Proceedings of 2003 American Society for Engineering Education Annual Conference & Exposition, American Society for Engineering Education, 2003.
[13] Hou Guoping, Wang Kun and Ye Qixin. LabVIEW7.1 Programming and Virtual Instrument Design. Tsinghua University Press. China, 2005.2. (in Chinese).