ISSN(Online): 2319-8753 ISSN (Print): 2347-6710
I
nternational
J
ournal of
I
nnovative
R
esearch in
S
cience,
E
ngineering and
T
echnology
(A High Impact Factor, Monthly, Peer Reviewed Journal)
Visit: www.ijirset.com Vol. 8, Issue 8, August 2019
Performance and Evaluation of Energy
Detector and Matched Filter under AWGN
Probal Sarkar, Ravndra Kumar Sharma, Rakesh Kumar Saxena, Ms. Ragini Malviya
Research Scholar (EI&C), IET, Alwar, Rajasthan, India
Assistant Professor, IET, Alwar, Rajasthan, India
Professor, Global Institute of Technology, Jaipur, Rajasthan, India
Assistant Professor, Noida Institute of Engineering and Technology, Uttar Pradesh, India
ABSTRACT: This paper models the Energy detection
algorithm. Different signal distributions were taken
into account in determining the design parameters for the detector. Exact close form expression for
probability of false alarm, probability of detection
and threshold are analyzed under different PU signal models. Simulations for ROC curve in AWGN The simulation results are tabulated which provides the better understanding of the effect on the system by channel parameters. The result shows that the performance degrades under multipath fading environment. SNR vs. pd curves were simulated for Gaussian approximated signal energy distributions. Analysis on the performance metrics has been carried out in MATLAB simulation.
KEYWORDS: matched filter ,energy detection ,BPSK ,AWGN ,cognitive radio
I. INTRODUCTION
CR is an advanced technique which lessens the issue of spectrum scarcity in electromagnetic spectrum. Spectrum sensing is one of the systems which checks the vacancy of primary user designated to particular frequency spectrum. There are a several methods for spectrum sensing for non-cooperative and cooperative CR users. There are few techniques for non-cooperative CR users such as energy detection, Matched filter detection, cyclostationary feature detection. Energy detection technique is less complex than matched filter and cyclostationary methods. The energy detection technique does not require any data about the signal structure present in the permitted band to detect the occupancy of user in that band. Energy detection works in high signal – to – noise ratio values compared to other methods. The main aim of this work is to explain the problem of spectrum sensing, various spectrum sensing methods, such as matched filter detection, energy detection. We are mainly focusing on energy detector spectrum sensing algorithm, the performance Are four functions of CRN spectrum Sensing, spectrum decision, spectrum management and spectrum sharing Spectrum Sensing: A CR user canOccupy only the vacant spectrum band. Therefore a CR user should superintend the available bands spectrum, pick up their Information, and therefore it can check the white sp
Spectrum Decision: Depend on the availability of spectrum on internal (and possibly external) policies, CR users can allocate a spectrum band.
Spectrum Sharing: Regard to there may be multiple cognitive radio users all of them are trying to access the spectrum, access on CRN should be arranged to prevent multiple users clash in interference bands of the spectrum
ISSN(Online): 2319-8753 ISSN (Print): 2347-6710
I
nternational
J
ournal of
I
nnovative
R
esearch in
S
cience,
E
ngineering and
T
echnology
(A High Impact Factor, Monthly, Peer Reviewed Journal)
Visit: www.ijirset.com Vol. 8, Issue 8, August 2019
sensing is the important one cause the CR technology are depend on it by which the spectrum holes are sensed [6], and it enables CR to configure to the environment, according to this point one of spectrum sensing techniques had taken to discuss and simulate on this paper. It is a necessary issue of CR is to sense the spectrum holes, it‟s based on to be aware of and sensitive to changes on it surrounded environment [1], spectrum sensing algorithms enable the CR to adjust and adapt to the environment by detecting PUs which receiving data across the communication scope of CR users [7].The sensing on CRN has two-main points:
a) To ensure that the secondary user doesn‟t caused interference to a primary user
b) To aid secondary user to recognize and utilize the white space for the required quality of service [2]. The spectrum sensing is to decide and determined between two hypotheses which are:
x (t)=w(t), H0 (PU absent) x (t)=h n(t)+w(t), H1 (PU present)
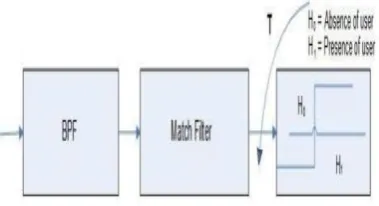
Of energy detection algorithm by varying some parameters and the performance of dynamic threshold on spectrum sensing algorithms (Matched filter detection and Energy detection).Matched filter is designed to maximize the output SNR for a given input signal. MF detection is applied when the secondaryused has prior knowledge of the residing user. In matched filter operation convolution of the unknown signal is done with the filter whose impulse response is time shifted & mirrored with respect to the desired signal. The expression for Where the unknown signal is „x‟ and the impulse response (h) of matched filter that is matched to the reference signal is convolved with it for maximizing the SNR. Matched filter detection is applicable only in cases where the cognitive users know the data from the primary user The block diagram of implementation of matched filter spectrum sensing algorithm is given below:-
Figure 1 block diagram of matched filter detection
In this method, signal is passed through band pass filter of the bandwidth W and is integrated over time interval, the output of the block of an integrator is then compared to a predefined threshold. The goal of this comparison is to discover the existence or absence of the licensed user. The value of threshold can set to be variable or fixed based on the conditions of the channel [6]. The Blind signal detector is the another name of ED [2], because it ignores the signal structure i.e., it estimates the presence of the signal by comparing the energy received with a known threshold ν derived from the statistics of the noise [8], analytically signal can be formalized as a hypothesis test
Y(k)=n(k)….H0 Y(k)=h*s(k)+n(k)….H1
In sample the y(k) is analyzed at each instant k and n(k) is the noise of variance σ2, say y(k) be as sequence of received
samples k ?{1,2….N} at the signal detector, therefore a decision rule can be stated as
ISSN(Online): 2319-8753 ISSN (Print): 2347-6710
I
nternational
J
ournal of
I
nnovative
R
esearch in
S
cience,
E
ngineering and
T
echnology
(A High Impact Factor, Monthly, Peer Reviewed Journal)
Visit: www.ijirset.com Vol. 8, Issue 8, August 2019
Where the estimated energy of the received signal and v is is chosen to be the noise variance All
radio transmitters by definition emit energy into the electromagnetic field. Energy detection (ED) is the simplest spectrum sensing method. As such it is often used as a baseline when evaluating other spectrum sensing methods. Energy detection is the optimal non-coherent detection algorithm The test statistic γ for energy detectors is based on the definition of signal energy, which is related to the physical concept of energy. For a continuous signal, using the common notation from this paper, the formalization is:
. Figure 2 shows the block diagram of ED technique.
For sampled-time real signals, the equation transforms
info: (he largest disadvantage of energy detection is the fact that the test statistic is as sensitive to noise power as to the signal power. In practice the noise power varies. Internal receiver noise changes with production tolerances, temperature and other Environmental factors. Environment noise changes with time and location. This leads to a SNR wall where a detector is incapable of reliably detecting a signal, regardless of the choice of Ns, when signal power is
small compared to noise power. The spectrum sensing algorithms are care about sensing the spectrum holes, these
holes are immigrating with time and frequency so the spectrum holes detection should be real time. Spectrum sensing
ISSN(Online): 2319-8753 ISSN (Print): 2347-6710
I
nternational
J
ournal of
I
nnovative
R
esearch in
S
cience,
E
ngineering and
T
echnology
(A High Impact Factor, Monthly, Peer Reviewed Journal)
Visit: www.ijirset.com Vol. 8, Issue 8, August 2019
Mathematical Model
(5)
Where:
=Noise Power
VT=Threshold Voltage
ω=Frequency
Pfa=Probability of False Alarm
X(n)=[x1…xM xM+1…x2M… xMn
L(n)=[x1 x2…xM] T
L(n)=[xM+1 xM+2…x2M]T
ISSN(Online): 2319-8753 ISSN (Print): 2347-6710
I
nternational
J
ournal of
I
nnovative
R
esearch in
S
cience,
E
ngineering and
T
echnology
(A High Impact Factor, Monthly, Peer Reviewed Journal)
Visit: www.ijirset.com Vol. 8, Issue 8, August 2019
Signal power = (12)
Noise power = (
Where x(t) is the received signal by the unlicensed user, n(t) is the transmitted signal of the licensed user, w(t) is the Additive White Gaussian Noise (AWGN), h is the amplitude gain of the channel. H0 is a null hypothesis, means that there is no signal from licensed user [2],according to the primary user these hypotheses means H0: The spectrum band is idle, H1: The spectrum band is occupied [2].
II. PROPSED METHOD
Matched Filter Detection (MFD) is a spectrum sensing
technique. It is one of the optimal techniques in the field of signal processing. It is known as optimal spectrum detection technique. The MFD is used forth PU spectrum when the transmitted signal from the source is known already (Lee et al 2008). When an unknown signal is matched with the known signal, if the unknown signal property is
similar to the known signal
property, then it assumed that the PU is present in the spectrum. If the property of the unknown signal and the known signal
is not similar, then it is
considered that spectrum is free and the SU can use the spectrum, an adaptive learning process leading to Cognitive nature as defined to be in Cognitive Radio networks. The MFD is an optimal linear filter that is used to maximize the SNR in the additive stochastic noise environment. The output SNR is made maximum by convolution of the transmitted signal which is unknown signal with a filter whose impulse response is time shifted version of the known reference signal
ADDITIVE WHITE GAUSSIAN NOISE: is a basic noise model used in Information theory to mimic the effect of many random processes that occur in nature. The modifiers denote specific characteristics:
Additive because it is added to any noise that might be intrinsic to the information system.
ISSN(Online): 2319-8753 ISSN (Print): 2347-6710
I
nternational
J
ournal of
I
nnovative
R
esearch in
S
cience,
E
ngineering and
T
echnology
(A High Impact Factor, Monthly, Peer Reviewed Journal)
Visit: www.ijirset.com Vol. 8, Issue 8, August 2019
Gaussian because it has a normal distribution in the time domain with an average time domain value of zero Wideband noise comes from many natural noise, such as the thermal vibrations of atoms in conductors (referred to as thermal noise or Johnson–Nyquist noise), shot noise Matched filter detector is a coherent pilot sensor that maximizes the SNR at the output of the detector. It is an optimal filter that requires the prior knowledge of the PU signals. This sensing technique is the best choice when some information about the PU signal are available at the SU receiver. Assuming that the PU transmitter sends a pilot
stream simultaneously with the data, the SU receives the signal and the pilot stream it can consider as a best sensing technique if CR has knowledge of PU. It is very accurate because it maximizes the received signal-to-noise ratio (SNR). Matched filter correlates the signal with time shifted version and compares between the final output of matched filter and predetermined threshold will determine the PU presence. Hence, if this information is not accurate, then the matched filter
operates weakly.,
Fig 4.1 proposed flow chart
III. RESULT ANALYSIS
ISSN(Online): 2319-8753 ISSN (Print): 2347-6710
I
nternational
J
ournal of
I
nnovative
R
esearch in
S
cience,
E
ngineering and
T
echnology
(A High Impact Factor, Monthly, Peer Reviewed Journal)
Visit: www.ijirset.com Vol. 8, Issue 8, August 2019
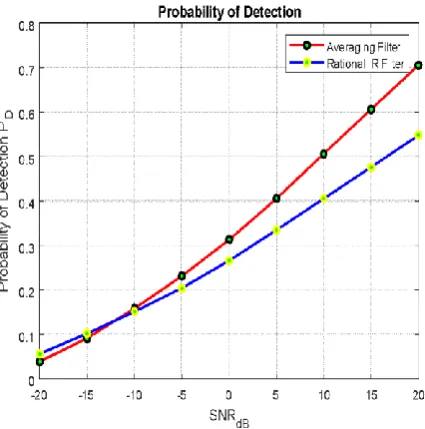
probability that the SU declares the presence of the PU signal when the spectrum is occupied [3][51][52]. The probability of detection is expressed as Where H0 and H1 denote respectively the absence and the presence of the PU signal. The higher the Pd, the better the PU protection is. The probability of false alarm, Pfd, is the probability that the SU declares the presence of the PU signal when the spectrum is actually free (idle). It is expressed as
Pfd = Prob (H1/H0)
The lower the Pfd, the more the spectrum access the SUs will obtain. The probability of miss detection, Pmd, is the probability that the SU declares the absence of a PU signal when the spectrum is occupied. It is given by
Pmd = Prob (H0/H1
These three metrics measure the efficiency of the spectrum sensing techniques and can be expressed as: Pd + Pfd + Pmd =1
There are tradeoffs between the probability of false alarm and the probability of miss detection. False detection of the PU activity causes interference to the PU and missed detection of the PU activity misses spectrum opportunities. This tradeoffs can be expressed as conservative with Pfd and aggressive with Pmd; and a spectrum sensing technique has to fulfil the constraints on both probabilities [6].
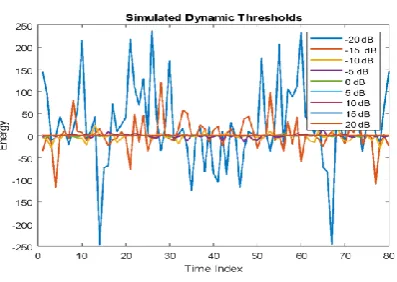
Fig 4.2 SNR Vs threshold graph
ISSN(Online): 2319-8753 ISSN (Print): 2347-6710
I
nternational
J
ournal of
I
nnovative
R
esearch in
S
cience,
E
ngineering and
T
echnology
(A High Impact Factor, Monthly, Peer Reviewed Journal)
Visit: www.ijirset.com Vol. 8, Issue 8, August 2019
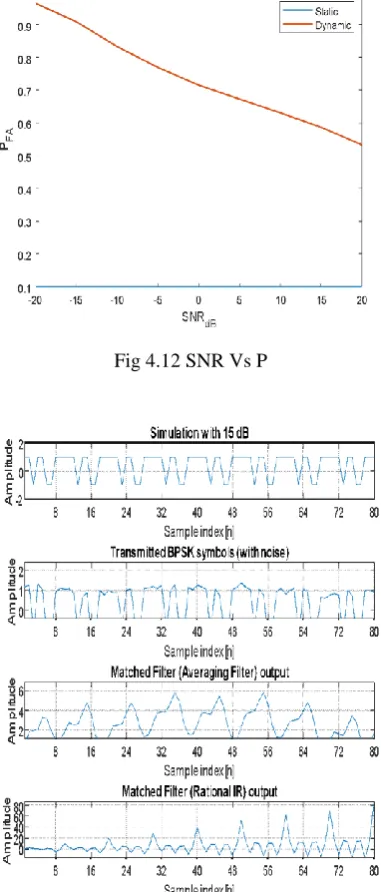
Fig 4.4 SNR Vs PFA graph
ISSN(Online): 2319-8753 ISSN (Print): 2347-6710
I
nternational
J
ournal of
I
nnovative
R
esearch in
S
cience,
E
ngineering and
T
echnology
(A High Impact Factor, Monthly, Peer Reviewed Journal)
Visit: www.ijirset.com Vol. 8, Issue 8, August 2019
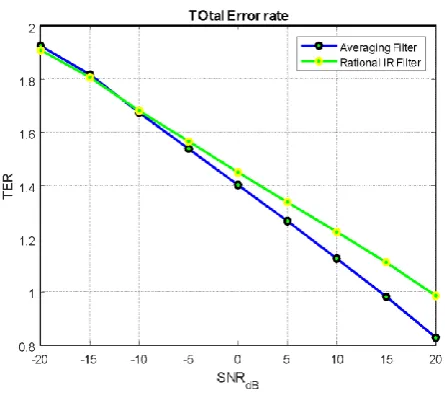
Fig.4.6 SNR Vs TER graph
ISSN(Online): 2319-8753 ISSN (Print): 2347-6710
I
nternational
J
ournal of
I
nnovative
R
esearch in
S
cience,
E
ngineering and
T
echnology
(A High Impact Factor, Monthly, Peer Reviewed Journal)
Visit: www.ijirset.com Vol. 8, Issue 8, August 2019
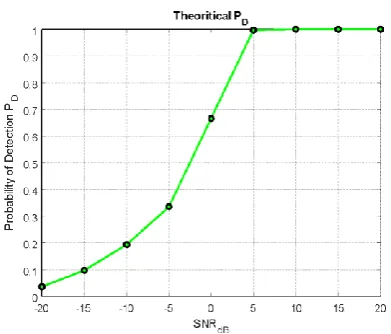
Fig 4.8 SNR Vs PD graph
ISSN(Online): 2319-8753 ISSN (Print): 2347-6710
I
nternational
J
ournal of
I
nnovative
R
esearch in
S
cience,
E
ngineering and
T
echnology
(A High Impact Factor, Monthly, Peer Reviewed Journal)
Visit: www.ijirset.com Vol. 8, Issue 8, August 2019
Fig 4.10 SNR Vs PD graph
ISSN(Online): 2319-8753 ISSN (Print): 2347-6710
I
nternational
J
ournal of
I
nnovative
R
esearch in
S
cience,
E
ngineering and
T
echnology
(A High Impact Factor, Monthly, Peer Reviewed Journal)
Visit: www.ijirset.com Vol. 8, Issue 8, August 2019
Fig 4.12 SNR Vs P
ISSN(Online): 2319-8753 ISSN (Print): 2347-6710
I
nternational
J
ournal of
I
nnovative
R
esearch in
S
cience,
E
ngineering and
T
echnology
(A High Impact Factor, Monthly, Peer Reviewed Journal)
Visit: www.ijirset.com Vol. 8, Issue 8, August 2019
Fig 4.14 Filter output at 20dB
ISSN(Online): 2319-8753 ISSN (Print): 2347-6710
I
nternational
J
ournal of
I
nnovative
R
esearch in
S
cience,
E
ngineering and
T
echnology
(A High Impact Factor, Monthly, Peer Reviewed Journal)
Visit: www.ijirset.com Vol. 8, Issue 8, August 2019
Fig 4.16 Filter output at 10dB
ISSN(Online): 2319-8753 ISSN (Print): 2347-6710
I
nternational
J
ournal of
I
nnovative
R
esearch in
S
cience,
E
ngineering and
T
echnology
(A High Impact Factor, Monthly, Peer Reviewed Journal)
Visit: www.ijirset.com Vol. 8, Issue 8, August 2019
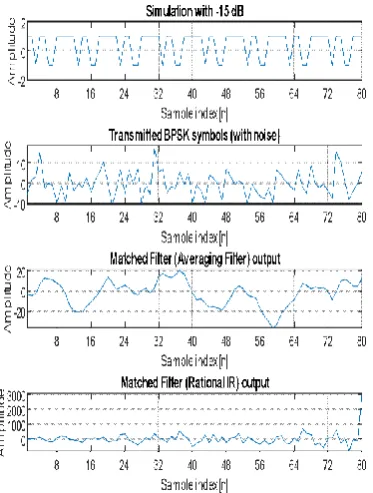
Fig 4.15 Filter output at -5dB
ISSN(Online): 2319-8753 ISSN (Print): 2347-6710
I
nternational
J
ournal of
I
nnovative
R
esearch in
S
cience,
E
ngineering and
T
echnology
(A High Impact Factor, Monthly, Peer Reviewed Journal)
Visit: www.ijirset.com Vol. 8, Issue 8, August 2019
SNR PRESENT
WORK
PREVIOUS WORK
PFA PFA
-20dB 0.091 0.7
10 dB 0.097 0.12
5 dB 0.099 0.18
20dB 0.8 *
Table 1 SNR for Different PFA Value
IV. CONCLUSIONS
Cognitive radio technology is a modernistic technology by which the idle licensed spectrum can be used by an unlicensed
user which is called cognitive radio CR. The CR technology was found to overcome the spectrum incompetence and inefficiency usage troubles. The major motivation of CR technology is current heavily underutilized of spectrum. Surly the PU have all rights to use his spectrum band so CR mustn‟t interfere it on that band. about energy detection which is one of spectrum sensing techniques, explained how to obtain the best available spectrum, to detect the spectrum hole, to estimate the optimum Threshold voltage that produce the minimum Probability of false alarm, calculate the power of signal in special range and random one and finally to enhance Energy Detection Sensing Algorithm. Detect any type of signal, and does not need any knowledge about the signal to be detected. Moreover, the noise power needs to be known to set the determination threshold energy detection based spectrum sensing are its simplicity, low computational and implementation costs as well as its ability to work regardless of the actual signal to be detected. In the present work, without involving the sampling theorems and the accompanying approximation, we derive the expressions for probability of detection and false alarm over AWGN. Therefore, the calculation is progressively precise. Also, the performance of the energy detector in real-time is analyzed.
REFERENCES
1. Roshdy Abdelrassoul, SM IEEE et.al.Comparative Study of Spectrum Sensing for Cognitive Radio System Using Energy Detection over
Different Channels 2016 World Symposium on Computer 978-0-7695-5832-5/16 $31.00 © 2016 IEEE DOI 10.1109/WSCAR.2016.13 Applications & Research
2. Mesut Do÷an, Gönül Turhan-Sayan Target Detection by Energy Features Extracted from Simulated Ultra Wideband Radar Signals
978-1-5090-6494-6/17/$31.00 ©2017 IEEE
3. Cheng Jiang The Face Detection Algorithm Based on Local Elastic Potential Energy Feature- 978-1-5386-2062-5/17/$31.00 ©2017 IEEE
4. Haykin S., Thomson DJ., Reed J.H.,"Spectrum Sensing for CognitiveRadio", Proceedings of the IEEE, Vol 97, pp.849-877, 12 May 2009.
5. Herath S.P., Rajatheva N., Tellambura C., "Energy Detection of Unknown Signals in Fading and Diversity Reception", IEEETransaction on
Communication Vol. 59, No. 9, September 2011, pp. 2443 – 2453.
6. Shah, Amir H. Dar, Anam Haq, Asad Ullah Khan, Tahir Javed, Shahid A. Khan, „„comparative Analysis of Primary Transmitter Detection Based
Spectrum Sensing Techniques in Cognitive Radio Systems”Australian Journal of Basic and Applied Sciences, 4(9): 4522-4531, 2010
7. Kyouwoong Kim; Akbar, I.A.; Bae, K.K.; Jung-Sun Um; SpoonerC.M.; Reed, J.H. "Cyclostationary Approaches to Signal Detection and
Classification in Cognitive Radio", New Frontiers in DynamicSpectrum Access Networks, 2007. DySPAN, 2nd IEEE International Symposium, pp. 212- 215, 17-2- April 2007.
8. H.Urkowitz, “Energy detection of unknown deterministic signals,” Proceedings of the IEEE, vol.55 no. 4, pp. 523-531, 1967.
9. F. F. Digham et al., “On the Energy Detectionof Unknown Signals over Fading Channels,” in Proceedings of the IEEE International Conference
on Communication, Seattle, Washington, USA, 2003, pp3575-357
10. .Ying Loong Lee ,Wasan Kadhim Saad, Ayman Abd ElSaleh,Mahamod Ismail," Improved Detection Performance of Cognitive Radio Networks