Biodegradation of Reactive Red 11 Azo Dye Using
Enterobacter sp. and gamma proteobacterium
collected from dye industry
Hemant Kr. Sharma1, Kavery Bajpai2, Shubhangi Shukla3, Reena Kumari4, Sujeet K. Singh5
Student, Division of Biotechnology, Cytogene Research & Development, Indira Nagar, Lucknow, U.P, INDIA –
2260161
Student, Institute of Applied Medicine & Research, Ghaziabad, U.P, INDIA – 2012012 Student, Amity Institute of Biotechnology, Amity University, Lucknow, U.P, INDIA - 2260103 Student, Amity Institute of Biotechnology, Amity University, Lucknow, U.P, INDIA - 2260104
Director, Cytogene Research & Development, Indira Nagar, Lucknow, U.P, INDIA - 2260165
ABSTRACT: Effluent sample collected from a dye industry of Chennai was used as a source for the isolation of 9 morphologically distinct bacteria capable of decolorizing textile dye Reactive red 11 which was purchased from local market in Chennai. Bacterium present in the effluent sample are grown in growth media along with the dye with varying concentration and several colonies were obtained using which decolorization assay was performed using textile dye Reactive red 11to screen for high dye decolorizing bacterial strains. 2 bacterial strains showed high decolorization of Reactive red 11 and these colonies were stored for further use. Genomic DNA of these 2 bacterial strains is isolated and identified as Enterobacter sp. and gamma proteobacteria by 16S rDNA analysis. GC-MS analysis of the degraded product of reactive red 11 these bacterium showed the presence of to 5,8- dihydronapthalen-2-amine which has a molecular mass of 145.2 and 6-(aminomethyl)-N-benzylnapthalen-dihydronapthalen-2-amine which has a molecular mass of 162.
Keywords: Effluent, decolorization, Enterobacter, proteobacteria, genomic, GC-MS.
II. INTRODUCTION
Since prehistoric period, people have been using colorants to dye furs, textiles and other objects. These natural substances were mainly obtained from plants, vegetables or animals. Dyes are used for colouring food, cosmetics, paper, plastic and textile industries. Solutions retain them by physical adsorption by making compounds with metals and salts using covalent bonds. Many chemical dyes have been used increasingly in textile and dyeing industries because of their ease and cost effectiveness in synthesis, firmness and variety in color compared to that of natural dyes. About 100,000 commercial dyes are manufacture including several varieties of dyes such as acidic, basic, reactive, azo, diazo, anthraquinone based meta complex dyes. Over 100,000 commercially available dyes exist and more than 7 × 10⁵ metric tons of dyestuff are produced worldwide annually(1) . In textile and paper coloration industries synthetic dyes from residual dye baths are released to waste streams. It is estimated that up to 50% of the applied dye, depending on the type, can be lost in effluents during textile dyeing processes.
III. MATERIAL AND METHODS
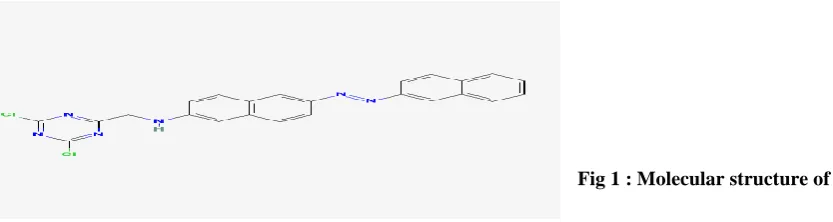
Dye Reactive red 11 dye was purchased from the local market from Ganpathi colour company Pvt. Ltd, Chennai. The stock solution of dye (50g/l) was prepared and filter sterilized. Dye is added in various concentrations to the appropriate growth mediums.
Fig 1 : Molecular structure of dye
A) Effluent Sample : Two different effluent samples was obtained from MOHAN DYES from Kanchipuram, Chennai. Bacterium present in this sample are grown in appropriate growth mediums along with dye.
B) Other Materials : All the chemicals used were of analytical grade and procured from HiMedia Pvt. Ltd, Mumbai. The materials required for PCR amplification (Taq Polymerase, dNTPs, primers) were obtained from Bioserve Biotechnologies India Pvt. Ltd, Hyderabad.
C) Methods:
1) Isolation of dye decolorizing bacteria on solid medium plates
2) Screening of high dye decolorizing organism from textile dye effluent 3) Genomic DNA isolation of high dye decolorizing bacteria
4) 16SrDNA analysis to identify the bacteria 5) Degradation pathway analysis by GC-MS
D) Isolation of dye decolorizing bacteria on solid medium : Effluent samples were collected from MOHANS DYE from Kanchipuram, Chennai and were used as a source to isolate morphologically distinct bacterial colonies which are capable of decolorizing the azo dye Reactive Red11.
Effluent sample was first grown in LB media along with dye and then subjected to enriched culture technique using enrichment media broth. The concentration of dye were subsequently increased from 50mg/l to 250 mg/l. Minimal media used was of following composition in g/l C6H12O6 (1.00), K2HPO4 (7.00),KH2PO4 (2.00), Na3C6H5O7 (0.50),
MnSO4 (0.10), (NH4)2SO4 (1.00)(13). Final culture was plated on LB as well as Minimal media plates and kept for
incubation on 37oC. Colonies are grown on both the plates which are used further for streaking on other L B and Minimal plates to isolate single colonies. The isolates were stored in the cold room at 40 C for further use.
E) Genomic DNA isolation of high dye decolorizing bacteria : All selected organisms were grown in LB media overnight at 37 0 C. Now these grown cultures are taken an 2 ml eppendorf tube and centrifuged. Genomic DNA from all the selected samples were isolated. The isolated DNA was loaded in electrophoresis tank and the presence of DNA was checked by running in agarose gel (0.8%) stained with ethidium bromide. The gel is seen in transilluminator and genomic DNA is found.
F) 16S rDNA analysis to identify the bacteria :
Polymerase Chain Reaction : The reaction mixture of total volume of 30µl consisted of 3µl of 10x Buffer, 1 µl of 10mM dNTPs, and 1µl of 16S rDNA primer (5picomole/µl), 3U/µl of Taq Polymerase, 5µl of template DNA (280ng/ml) and 19 µl of sterile distilled water.
Sequencing of PCR Product : The PCR product was sequenced to identify the bacterial isolate using ABI 3130XL (Analyzer, USA). The sequence was then subjected for BLAST to identify the bacterial isolate. (http://blast.ncbi.nlm.nih.gov/Blast.cgi)(6)
G) Biodegradation of Reactive red 11 by bacteria—
Degraded Product Extraction : First 100 ml LB media was prepared along with dye (250mg/l) having best dye degrading culture. After incubating till 24 hours at 370 C inoculation of LB in Minimal media is done in 5 conical flasks of 100 ml. Incubation of each flask was done till 24th ,72th,120th hour . The organic compounds were extracted using ethyl acetate as solvent from the incubated dye containing culture in minimal media using a separating funnel. Lower dye phase was eliminated while ethyl acetate phase was then subjected to evaporation by keeping at room temperature overnight. A powdery residue of organic compounds thus obtained was subjected to GC-MS analysis.
H) GC-MS Analysis : Powdery residue of organic compounds obtained after evaporation along with the control is given for GC-MS analysis to Sophisticated Analytical Instrument Facility, IIT Madras, Chennai. Chromatogram and mass spectra is obtained, analysed and predicted.
IV. RESULTS
A)Isolation of dye decolorizing bacteria from effluent sample -- Effluent sample was first inoculated in LB broth containing 50mg/l of dye. The enrichment is done in enrichment media up to 250 mg/ml of dye concentration by subculturing the grown LB broth in fresh LB broth with the incubation time of 16-18 hour.
Now inoculation of LB media is done in minimal media broth and incubated over night. Grown culture in minimal media is now serially diluted and plated on LB agar plates as well as minimal media agar plates. 12 colonies are selected from the minimal media plates and streaking is done on minimal media plates. Incubation is done and colonies obtained are kept for further studies and stored in cold room. Culture in minimal media before and after growth of strain is shown in figure 2 and figure 3 respectively.
Fig.2 Culture in minimal media before Fig.3 Culture in minimal media after
decolorization decolorization
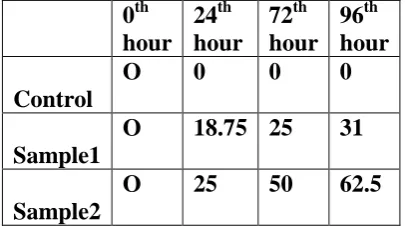
B) Screening of high dye decolorizing organisms from textile dye effluent : Out of the streaked plates 5 colonies named as c1, c2, c3, c4, c5 are picked and subjected to dye decolorization assay. In this assay first all the picked colonies were inoculated in 5 test tubes containing minimal broth along with dye in concentration of 250mg/l. Same procedure is also done in LB broth. One control test tube is also made. Readings for decolorization are taken at the intervals of 0hr, 24hr, 48hr,72hr,96hr . The absorption of the dye is checked at different intervals in colorimeter at λmax
Table1:Decolorizing in minimal media Graph 1: % of decolorization in minimal media
Table2. Decolorization in LB medium Graph 2. Decolorization in LB Medium
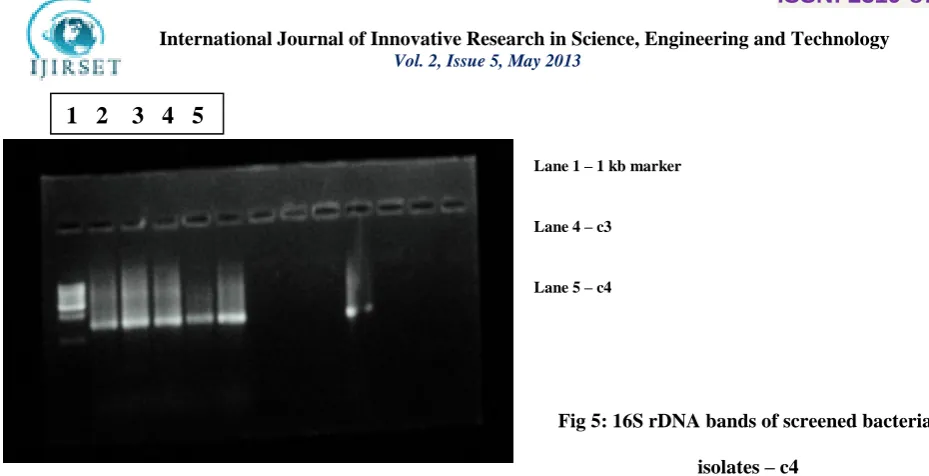
C) Genomic DNA isolation of high dye decolorizing bacteria : DNA was isolated from 2 high dye decolorizing colonies c3 and c4 by standard bacterial genomic DNA isolation protocol. The presence of DNA was analyzed by running in 0.8% agarose gel by gel electrophoresis. Genomic DNA is found in analyzed. The gel in figure 8 shows the DNA isolated from the screened bacterial isolates.
Lane 1 – 1 kb marker
Lane 4 – c3
Lane 5 – c4
Fig 4: 16S rDNA bands of screened bacterial
isolates – c3
0
50
100
0
24
72
96
deco lo riza tio n … % of decolorization Vs Time (hours)
BLUE-100 mg CONC. PINK-250 mg CONC. 0 20 40 60 80 100
0 24 48 72
% o f Dec o lo riza tio n Time (hours) % of Decolorization Vs Time
control sample1 sample2
0
thhour
24
thhour
72
thhour
96
thhour
Control
O
0
0
0
Sample1
O
18.75 25
31
Sample2
O
25
50
62.5
0
thhour
24
thhour
48
thhour
72th
hour
control
0
0
0
0
Sample1 0
53
86
93
Sample2 0
60
86
93
Lane 1 – 1 kb marker
Lane 4 – c3
Lane 5 – c4
Fig 5: 16S rDNA bands of screened bacterial
isolates – c4
D) Identification of high decolorizing bacteria by 16S rDNA analysis : Amplification of 16S rDNA sequence of each of the sample was amplified using universal 16S rDNA forward and reverse primers. The gel image in figure 4 shows the amplified 16S rDNA bands of the screened bacterial isolates. The size of amplified product was found to be 1.5 kb when compared to 1 kb molecular marker.
Amplified products were further purified by DNA elution column and were subjected to cycle sequencing. Thus sequence obtained by the cycle sequencing was subjected to BLAST analysis. The 16S rDNA sequence of the strain c3 and c4 are given in Figure 6a.1) and Figure 6b.1).
Figure 6: Sequencing an identification of screened bacterial strains: a) c3 b) c4
6 a.1) sequence – strain c3
GTTAACCATTAAATGTGTAATGCAAGTCGACGGTAGCACAGAGAGCTTGCTCTCGGGTGACGAGTGGCG GACGGGTGAGTAATGTCTGGGAAACTGCCTGATGGAGGGGGATAACTACTGGAAACGGTAGCTAATACC GCATAATGTCGCAAGACCAAAGAGGGGGACCTTCGGGCCTCTTGCCATCGGATGTGCCCAGATGGGATT AGCTAGTAGGTGGGGTAATGGCTCACCTAGGCGACGATCCCTAGCTGGTCTGAGAGGATGACCAGCCAC ACTGGAACTGAGACACGGTCCAGACTCCTACGGGAGGCAGCAGTGGGGAATATTGCACAATGGGCGCAA GCCTGATGCAGCCATGCCGCGTGTATGAAGAAGGCCTTCGGGTTGTAAAGTACTTTCAGCGAGGAGGAA GGCATTGTGGTTAATAACCGCAGTGATTGACGTTACTCGCAGAAGAAGCACCGGCTAACTCCGTGCCAGC AGCCGCGGTAATACGGAGGGTGCAAGCGTTAATCGGAATTACTGGGCGTAAAGCGCACGCAGGCGGTCT GTTAAGTCAGATGTGAAATCCCCGGGCTCAACCTGGGAACTGCATTTGAAACTGGCAGGCTTGAGTCTTG TAGAGGGGGGTAGAATTCCAGGTGTAGCGGTGAAATGCGTAGAGATCTGGAGGAATACCGGTGGCGAAG GCGGCCCCCTGGACAAAGACTGACGCTCAGGTGCGAAAGCGTGGGGAGCAAACAGGATTAGATACCCTG GTAGTCCACGCCGTAAACGATGTCGACTTGGAGGTTGTGCCCTTTGAGGCGTGGCTTCCCGGAGCTAACG CGTTAAGTCGACCGCCTGGGGGAGTACGGCGCAGATGATACTTCAATGATGATCGGGGCCCGCACAGCG GTGGGAGCATGGTGGCTTAATTACGAATGCAAACA
6b.1) sequence
GTAGCCCTACAAGAGTGGTCAGCGCACTCCGAAGGTTAGCTACCTACTTCTTTTGCAACCCACTCCCATG GTGTGACGGGCGGTGTGTACAAGGCCCGGGAACGTATTCACCGTAGCATTCTGATCTACGATTACTAGCG ATTCCGACTTCATGGAGTCGAGTTGCAGACTCCAATCCGGACTACGACGCACTTTATGAGGTCCGCTTGC TCTCGCGAGGTCGCTTCTCTTTGTATGCGCCATTGTAGCACGTGTGTAGCCCTACTCGTAAGGGCCATGAT GACTTGACGTCATCCCCACCTTCCTCCAGTTTATCACTGGCAGTCTCCTTTGAGTTCCCGGCCTAACCGCT GGCAACAAAGGATAAGGTTGCGCTCGTTGCGGGACTTAACCCAACATTTCACAACACGAGCTGACGACA GCCATGCAGCACCTGTCTCAGAGTTCCCGAAGGCACCAAGGCATCTCTGGCAAGTTCTCTGGATGTCAAG AGTAGGTAAGGTTCTTCGCGTTGCATCGAATTAAACCACATGCTCCACCGCTTGTGCGGGCCCCCGTCAA TTCATTTGAGTTTTAACCTTGCGGCCGTACTCCCCAGGCGGTCGACTTAACGCGTTAGCTCCGGAAGCCAC GCCTCAAGGGCACAACCTCCAAGTCGACATCGTTTACGGCGTGGACTACCAGGGTATCTAATCCTGTTTG CTCCCCACGCTTTCGCACCTGAGCGTCAGTCTTTGTCCAGGGGGCCGCCTTCGCCACCGGTATTCCTCCAG ATCTCTACGCATTTCACCGCTACACCTGGGAATTCTACCCCCCCTCTACAAGACTCAAGCCTGCCAGTTTC AAATGCAGTTTCCCAGGTTGAGCCGGGATTTCACATCTGACTTAACAGACGCTGCGTGCGCTTACGCCAG TAATACGGAATGACGCATGGCACCTCCGGTAATACGCGCTGCTGGCACGAGTAGGCCAGGTGCTTCCTTC TGTGCGAGTTAAAA
Fig 6. Chromatogram of Reactive Red 11 Fig.7 Mass Spectrum of Reactive Red 11
Fig.8 Chromatogram of 72hr decolorized culture Fig. 9 Mass Spectrum of 72hr. Decolorized culture
V. DISCUSSION & CONCLUSION
Isolation and screening of high dye decolorizing bacterial colonies from effluent sample : Structure of azo dyes plays an important role in decolorization reaction by bacteria. Complexity of the structure of the dye is related to percentage of its decolorization. Number of azo bonds in the dye is related to the colour removal. Colour removal is difficult with highly substituted high molecular weight dyes while dye with simple structure and low molecular weights exhibit greater decolorization in the presence of bacteria(3). In our study 3 bacterial colonies were screened from the 12 bacterial isolates obtained during serial dilution. These bacterial colonies exhibited different decolorization efficiency. So from the study , it can inferred that colour removal process is also depend on the potential of bacteria to attack the dye molecule leading to its decolorization as each bacteria has different dye degrading capacities.
A) GC-MS analysis of Degraded product : Degradation products obtained after GC-MS analysis are found to be to 5,8- dihydro napthalen-2-amine which has a molecular mass of 145.2 and 6-(aminomethyl)-N-benzylnapthalen-2-amine of molecular mass 262. The molecular masses of each products are in correspondence to m/z ratio of respective peaks found in mass spectra. Both of these products are obtained only when azo bond N=N is cleaved. So here by this study it is clear that cleavage of azo bond resulting in degraded products is done by activity of bacterial strains found. Thus study of biodegradation by bacterium is done and bacterium species capable of degrading Reactive red 11 azo dye is also found . Around 100% dye decolorization is done by bacteria found to be Enterobactor and proteobacteria. So here we can say that biological methods can be the most useful tools for decolorization and degradation of these harmful azo dyes. Selection of appropriate media and dye concentration is very important step in this process. We used LB as well as minimal media for decolorization process in which decolorization in LB media has shown very promising results.
A lot of other works is also being done in this area as effect of different concentration of carbon and oxygen and various temperature, pH conditions on percentage of dye decolorization.
ACKNOWLEDGEMENT
I am extremely thankful to both of my colleagues for their whole-hearted support throughout the research work. I am extremely indebted to the co-author, my friend and guide, Mr. Sujeet K. Singh, who gave me the chance to work in his prestigious laboratory. The second co-author of this paper, Ms. Shubhangi Shukla, also helped me a lot while working in laboratory. Last but not the least, my family provided me moral support whenever and wherever I needed. Special thanks to IIT-Madras, for their valuable support in our sample analysis part.
REFERENCES
1) Hosseini S.D., Asghari F.S., Yoshida H. (2009). Decomposition and Decoloration of Acid Orange7 using Sub-critical Water Method .Proceedings
of the World Congress on Engineering and Computer Science Vol. 1: 3-8
2) Mezohegyi G., Kolodkin A., Castro U.I, Bengoa C., Stuber F., Font J. and Fabregat A.(2007). Effective Anaerobic Decolorization of azo dye acid
orange 7 in continuous up flow packed-bed reactor using biological activated carbon system. Indian English Chemical Research 46: 6788-679222.
3) Pearse C.I, Llyod J.R., Guthrie J.T. (2003) Removal of colour from textile wastewater using whole bacterial cells: a review Dyes and Pigments 58:
179-196.
4) Barakat O.S., Darwesh O.M., Sedik M.Z. , Moawad H. and Abd El-Rahim W.M. (2009) Evidence of biodegradation of reactive red textile azo dye
in anoxic/aerobic bioremediation system. 4th Conference on Recent Technology in Agriculture (2009).Egypt.,
5) Ozdemir G., Yasa I., Pazarbas B., Ersoy E., Karaboz1 I., Basaran B., Bitlisli B.O., Sari O. Decolorization of the leather industry dyes by newly isolated bacterial strains .Ege University, Faculty of Science, Department of Biology, Basic and Industrial Microbiology Section 35100. 1-9
Bornova-İzmir,Turkey.