7170
Analysis Of Potential Transit Oriented
Development Area Around Light Rail Station In
Indonesia
Edi Kadarsa, Betty Susanti, Risky Firmansya, Melawaty Agustien
Abstract: Traffic congestion is increasing in Palembang City every year. One of the efforts by the government to overcome the traffic congestion problem is through the cooperative program of the private sector to build LRT lines that are connected with other public transportation. This research is conducted to find out the potential of the area around Jakabaring Railway Depot Station (DJKA) which will be developed following the concept of Transit Orientation Development (TOD). The observation was performed on 800 meters radius around the station. The survey conducted consists of average daily traffic (ADT), land availability, household, and parking inventory in non-housing and intensity. Modeling was conducted to model the trip generation in a residential area with linear regression and trip attraction in a non-residential area using the trip rate method. Research results showed that the area around the station has the potential to be developed following the TOD concept.
Index Terms: Light rail transit, transit-oriented development, trip attraction, trip generation, trip rate.
————————————————————
1. INTRODUCTION
Transportation facilities and infrastructure development in Indonesia have increased significantly. One of them is the development of Light Rail Transit (LRT) infrastructure which has 13 stations of 23 kilometers lane length passing through the strategic area in the Palembang City. Palembang is one of the first city to operate LRT in Indonesia. This LRT mode is hoped to reduce congestion and increase people’s accessibility and mobility. One of the strategies to support LRT growth is by developing a Transit Oriented Development (TOD) based area on LRT stations. TOD is a concept of developing a transit area that synergizes with the environment by maximizing pedestrians and reduce the use of motor vehicle [1]. The Jakabaring Railway Depot Station (DJKA) is one of the stations at the end of LRT line and located in the newly developed area. This was an empty swamp area which a small section of the area was used for community residents and tidal rice fields. Currently, the DJKA area has developed rapidly with mixed use of land which consists of residential areas, commercial areas, and offices. However, the developed area is still considered narrow compared to the total area, therefore it is easily developed through better planning. Most people whose activities are around the station still use their personal vehicle to move around. This can be seen from the small number of public transport passengers at rush hour (public city transport and Bus Rapid Transit available in front of the stations). This research was conducted to obtain an understanding of the potential of areas around the station which will be developed or built based on the TOD concept.
2. LITERATURE REVIEW
According to [1] the TOD concept is a mixed-useneighborhood which is developed around a transit stop and core commercial area. The design, configuration, and mix of uses provide an alternative development by emphasizing a pedestrian-oriented environment and reinforcing the use of public transportation. To develop the area around the station in accordance with the TOD concept, there are 5 main principal to be fulfilled [2], namely: density, diversity, design, destination accessibility, and distance to transit. The development was conducted in the area as far as 400 meters up to 800 meters radius from the stations center. The radius of area development around the station is determined based on the comfortable distance to reach the station on foot [3]. In Indonesia, the requirements of area around the station which has potential to be developed based on TOD concept refers to Agrarian Affairs and Special Planning (ATR) Minister Regulations No. 16 of 2017, that is TOD are located on the transit node; in accordance with the development direction of services and activities centres; located in a low disaster susceptibility area along with mitigation to reduce disaster risk; and located in areas that are not interfere the country’s important installations. The land density level around the station does not become an obstacle in the development or construction. The development or construction strategy around the station can be adjusted to the existing building density. Some commonly used strategies are shown in Fig 1.
————————————————
Edi Kadarsa, lecturer in Department of Civil Engineering, Universitas Sriwijaya, Indonesia; researcher in National Center for Sustainable Transportation Technology, Indonesia, Email: [email protected]
Betty Susanti, lecturer in Department of Civil Engineering, Universitas Sriwijaya, Palembang, Indonesia; researcher in National Center for Sustainable Transportation Technology, Indonesia, Email: [email protected]
Risky Firmansya, graduate of Department of Civil Engineering, Universitas Sriwijaya, Palembang, Indonesia.
7171 Fig. 1 Development strategies of area round stations
(Source: Minister Regulation of ATR No. 16 of 2017)
On re-developable sites; TOD is built in the already constructed area and can be revitalized with newly land usage; on infill sites; TOD is built in an empty land surrounded by already constructed urban area; while on new growth areas; TOD is built in undeveloped land and usually wider in size and is located in the suburbs. To obtain an idea about the potential area to be developed based on the TOD concept, then existing and future trip generation information are needed. The amount and factors influence the trip generation is important to understand, so that the development can increase the trip flow around the station or LRT line. Some researches have been conducted in Indonesia to review variables influencing trip generation in an area. The research result showed that household trip generation is influenced by family income per month, the number of family members, number of working family members, the number of family members that are going to school, transportation expenses; and the amount of car ownership [4] and [5]. The methods commonly used for modeling of household trip generation is Multiple Linear Regression, either using zone data or household data [6]; [7]; [8]. According to [9], the variables influencing trip attraction are the floor area for industry, commercial, offices, other services, employment, and accessibility. While the most commonly used method for trip attraction is
Multiple Linear Regression and Trip Rate, as shown in [10]; [11]; [12]; and [13].
3. METHODS
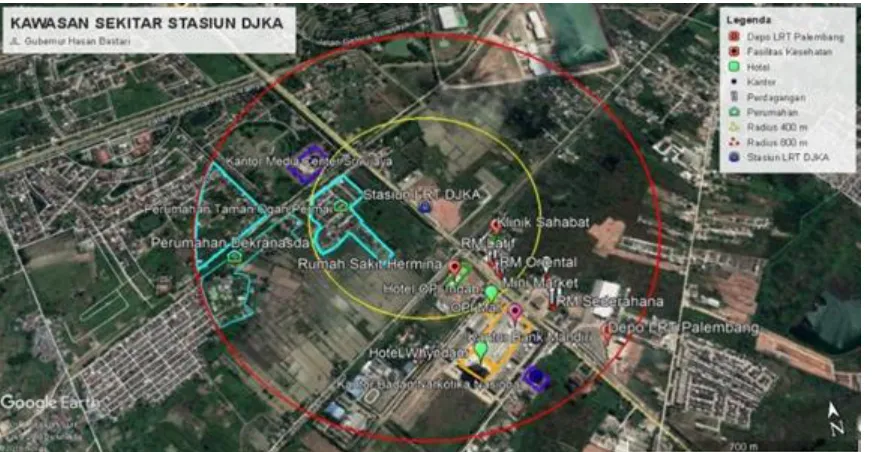
This research was conducted in the area around Light Rail Transit (LRT) DJKA station with an observation radius of 800 meters from the station point (Fig 2). The literary studies were performed to understand the requirements for the location of TOD potential area and identified the data necessary for modeling and analysis. Furthermore, data collecting was performed which include land availability, ADT, socio-economic characteristics of people around the station, household and trip rate to find out the generation and attraction around the station. The prediction of housing generation and attraction around the station was found using the linear regression method, while non-housing based on the data of survey results were compared using the ITE model. Generation and attraction around the station and other data were used to find out the development potential of the area around the station which was determined as TOD. The proposed development and construction of the area was conducted in accordance with the TOD concept and refer to the regional spatial plan and Master plan of City Transportation.
7172
4. DISCUSSION
4.1. Potential TOD Area Identification
Fig 2 shows the DJKA Station with the observation radius of 800 meters from the center point of the station. The observation distance of the land use along the main road was divided into 2, namely from the DJKA station to the Ogan Ilir Regency which was marked in positive and to Palembang City which was marked in negative. To determined the feasibility of TOD area, The Minister Regulation of ATR No. 16 of 2017 states that it is necessary
to know the land use around the stations, so that the variables considered in this study are the type of land use and the availability of land around the station. The results of land use surveys around the station using drones are shown in Fig 3. Another requirement for the development of TOD is based on potential attraction around the station. In line with [14], potential trip attraction are influenced by building area, parking area, number of employees, and the average number of visitors per day. The assessment of potential attraction around the DJKA station presented in Tables 1 and Table 2.
Fig. 3 Condition of land use around the DJKA station
Table 1 Characteristics of land use around the LRT DJKA Station to Ogan Ilir Regency
No
Land Usage Radius Building
Area (m2)
Type of Service
Parking Area
(m2)
Average number of visitors per
day (People/day)
Right Left 0-400
m
400-800 m
1 Office 1 +615 3.142 Offices 720 50
2 Office 2 +600 606 Offices 150
3 Restaurant 1 +560 1.415 Trading 134 300
4 Mini Market +510 425 Trading 78 100
5 Hotel 1 +500 102.992 Commercial 1.612 100
6 Restaurant 2 +360 275 Trading 103 250
7 Mall +470 67.952 Commercial 8.628 800
8 Restaurant 3 +375 320 Trading 61 150
9 Hotel 2 +410 4.227 Commercial 70
10 Policlinic +310 291 Health 35
11 Hospital +300 10.330 Health 1.138 250
Table 2 Characteristics of land use around LRT DJKA Station to Palembang City
No
Land Usage Distance from DJKA Station Building Area (m2)
Number of Employees (people)
Type of Services
Parking Area
(m2)
Average number of visitors per day
(People/day)
Right Left Right Left
Empty Land 0 55.669
Empty
Land 0 126.775
1 Housing -320 Housing
2 Media Centre -440 10.234 30 Offices 1030 100
Empty
Land -460 51.638
3 Dekranasda
7173 The observation results presented in Table 2-3 and Figure
3 shows that the land use around the station is a mixed-use land which consists of shopping centers, offices, and other commercial centers along the main road, and cluster housing behind the commercial or offices center. There is large empty land around the station that can be developed or built. The results of the interview with the local government and people showed that the area around the station is safe from disaster and is located in an area that does not disturb important installation of the country. The obstacle of development around the station area is the Local Regulation No.11 of 2012 on Development of Swamp
Control and Utilization. However, this local regulation does not hinder the development and only regulates the division of land use proportion for residential and commercial which are confirmed in the revised regional spatial plan document. Survey of characteristics of traveler includes the characteristics of socio-economic and the number of the trip in one day which are addressed to the people living around the area of LRT DJKA station within the observation radius (800 meters from the station). The results of data processing of the socio-economic characteristics and number of the trip are presented in Table 3.
Table 3 Socio-economic characteristics and number of trip
No. Socio-Economic Characteristics and
Number of Trip Percentage (%)
1.
Respondents Occupation
- Public employee
- Private employee
- Others
20 64 16
2.
Respondents age
- > 17-35 years old
- 36-55 years old
- > 55 years old
24 70 6
3.
Respondents Monthly Income (IDR)
- < 2 million
- 2 million -4,9 million
- 5 million – 7,5 million
- > 7,5 million
16 55 24 5
4.
Expenditure for Transportation Expenses (IDR)
- < 500 thousand
- 500 thousand -1 million
- 1 million -1,5 million
- > 1,5 million
44 35 16 5
5.
Working Duration
- < 8 hours
- 8 hours
- > 8 hours
19 54 28
6.
Amount of Trip
- 2 x per day
- 5 x per day
67 29 Note: 1 USD = 14.000 IDR
Based on the results of the socio-economic survey in the housing around the station, it can be concluded that the trip generation and attraction potential is significantly high. Table 4 shows that more than 75% of respondents are working in a various field which potentially performs a trip out of the zone. This shows a high trip generation, although this study has not included trip data from students to school and housewives to the market, which both represent productive age travelers. The high prediction of generation and attraction potential is supported by the percentage data of the number of the trip, namely 67% for 2x per day and 29% for 5x per day. However, it is necessary to conduct a review of ability to pay and willingness to pay for public
transportation (i.e., LRT and Feeder) because the respondents’ percentage with transportation expenses lower than 500 thousand is quite high of 44%.
4.2. Trip Generation and Attraction in Non-Housing Land Use
7174 Table 4 The number of trip attraction in non-housing land use
Land Use
Trip Generation and Attraction Morning
(PCU)
Noon (PCU)
Afternoon (PCU)
Hospital 28 60 48
Policlinic 12 14 0
Office1 35 41 15
Office 2 63 78 22
Mini Market 71 76 84
Commercial
(mall, hotel 1, hotel 2) 46 446 242
Restaurant 1 3 44 22
Restaurant 2 6 60 25
Restaurant 3 3 35 25
Numbers 267 854 483
Based on the data analysis, the high generation and attraction come from the trade center area with the number of vehicles coming at noon is 76 PCU and afternoon is 84 PCU or average visitors of 800 people/day to the Mall only. The high generation and attraction occur in the hospital with 60 PCU at noon and 48 PCU in the afternoon or average visitors of 250 people/day. Then it is followed by mini market, offices centre and restaurant with 20-80 PCU at noon and afternoon or average visitors of 100 people/day. The trip potential around the station can be even higher when the development for non-housing considers mall or commercial areas, hospital, offices centers and restaurants. The calculation results using the ITE Method resulting in a different attraction value with the survey results conducted. The t-test between the modeling results with the survey results shows t value greater than 0.05 so that it can be concluded that there are differences between survey results
with the calculation results using the ITE Method. This is because the research for ITE model was performed in the already developed urban areas, while this research was conducted in the newly built or developed area. Therefore, this research only used the data from the survey result.
4.3. Trip Generation in the Housing Land Use
Modelling is used to observe the relationship between the numbers of trip per day of people who live around the station with independent variables that influence the level of such trip, namely: amount of income (X1), transportation expense (X2) and the amount of car ownership (X3) which are generally used in determining the trip generation model. A correlation test was performed to find out the degree of relationship between dependent and independent variables. After the correlation test met the modeling requirements, the regression was performed, as shown in Table 5.
Table 5 Regression results of trip generation model in the housing land use
Model
Variable Constant Coefficient Standard
t Sig. B Std.
Error Beta
1
(Constant) .879 .218 4.022 .000
Income .254 .109 .237 2.335 .022
Transportation Expense .183 .085 .201 2.148 .034 Number of owned vehicles .291 .100 .317 2.906 .005 ANOVA test was conducted to see whether the three
variables that are considered significant is subsequently influencing the trip generation. The test results showed significance value below 0.05 which indicates that the three variables influence the trip generation. Moreover, the F value is positive which make it reasonable to state that the relationship between dependent and independent variables are directly proportional. Validation conducted by comparing the obtained models with the results of a trip generation survey on land use planning. The T-Test results showed significance value below 0.05, which can be concluded that there is no difference between the survey results and the model.
4.4. Average Daily Traffic (ADT)
7175 Table 6 The average daily traffic in front of the DJKA Station
Time Number of Vehicles
Movement Direction of Palembang City-Ogan Ilir Movement Direction of Ogan Ilir- Palembang City Motorbike Car
Public Transport &
Bus
Truck 2 axles
Truck 3
axles Motorbike Car
Public Transport &
Bus
Truck 2 axles
Truck 3 axles
06.00-0700 163 89 1 11 1 163 89 1 11 1
07.00-08.00 217 119 1 40 1 216 119 - 40 1
08.00-09.00 203 152 1 83 9 208 181 - 83 9
09.00-10.00 150 150 1 89 7 150 151 1 105 6
10.00-11.00 150 206 1 131 11 97 101 2 114 6
11.00-12.00 104 118 5 134 10 108 127 1 120 18
12.00-13.00 103 89 3 69 5 90 120 1 71 13
13.00-14.00 116 120 8 106 9 111 104 5 60 12
14.00-15.00 77 134 1 135 12 56 128 12 67 9
15.00-16.00 95 106 1 76 15 145 151 2 83 6
16.00-17.00 156 168 4 70 19 219 128 1 65 14
17.00-18.00 143 179 2 57 8 233 101 1 60 17
18.00-19.00 118 197 - 52 6 126 122 1 24 12
19.00-20.00 103 177 1 48 2 89 97 - 18 14
The survey results show that the ADT of passengers car and motorbike is considerably high especially at 07.00-11.00 and 16.00-18.00, which is when people doing their activities outside the house for the purpose of business, working or shopping in the offices or shopping center around the station. This ADT is predicted to be continuously developed along with the construction of the large area or empty land, especially to the Ogan Ilir direction. Thus, it can be concluded that there is a high potential of TOD for the area around the station and will continue increasing along with the ongoing development.
5 CONCLUSION
Based on the analysis conducted, it can be concluded that the area around the station has the potential to be determined as the TOD area based on the Minister Regulation of ATR No. 16 of 2017. There are integration between several modes of public transportation in DJKA station including line-based LRT and public transportation as a feeder. There is a vast area of empty lands around the station, both owned by the government and private party so that the development can be conducted using the strategy of new growth areas. This land is in the area safe from disaster and located in the area that does not disturb the important installation of the country. Trip generation and attraction around the station is considerably high, so does with the ADT of vehicles passing in front of the station. This trip generation and attraction will continuously be developed because a vast area of empty land still exists. The development of area around the station is also supported and in line with the regional spatial plan. Furthermore, a review is necessary to determine the appropriate strategy to move the private transportation users to public
transportation using the TOD concept by considering the characteristics and behavior of the people moving around the station. Therefore, when the generation and attraction increase, the movement is expected to use public transportation, instead of private vehicles. Moreover, considering the current development concept, namely shopping center, offices, hotels, hospitals and culinary which are developed on the side of the road and behind the housing clusters, then a review of park and ride near the station should be conducted so that people who live in the residential area relatively close to the TOD area and not reached by public transportation can use car, motorbike, or bicycle that can be parked in the available area. Other supporting infrastructures to be reviewed is the safe and comfortable pedestrian path, which is free from heat, rain, and safe from accidents and criminals especially within the radius of 800 meters from the station. This infrastructure connects the station with residential areas, shopping centers, offices, hospitals, and culinary. Therefore, it will attract people to walk and use public transportation when moving around.
ACKNOWLEDGMENT
7176
REFERENCES
[1] Calthorpe P (1993) The Next American Metropolis: Ecology, community, and the American dreams. Princeton Architectural Press. New York
[2] Ewing R, Cervero R (2010) Travel and the built environment: A meta-analysis-American Planning Association 76(3): 265-294
[3] Dirgahayani P, Situngkir F (2015) The impact of public transportation on reducing transport-related social exclusion: an exploratory study in the case of Jakarta. Proceedings of the Eastern Asia Society of Transportation Studies (EASTS) 2015 Conference, Cebu City, Philippine, 11–14 September 2015
[4] Olayiwola SM (2014) Urban socio-economic variables and intra-urban trips in Ogun State, Nigeria. Indonesian Journal of Geography 46(1): 52-61
[5] Yayat KD, Kombaitan B, Pradono, Purboyo HP (2016) Traffic impact assesment practice in Indonesia. Procedia - Social and Behavioral Sciences 227(2016): 75–80.
[6] Priyanto S, Friandi EP (2010) Analyzing of public transport trip generation in developing countries; a case study in Yogyakarta, Indonesia. International Journal of Civil and Environmental Engineering 4(6): 167-171.
[7] Sulistyono S, Hasanuddin A, Adrisyanti YO (2012) Trip generation analysis using multiple linear regression method on Bumi Estate Muktisari and Taman Gading Housing Jember Regency. Proceeding of The 15th FSTPT International Symposium, Bekasi, Indonesia, November 23-24, 2012
[8] Anggraini R, Sugiarto S, Pramanda H (2017) Factors affecting trip generation of motorcyclist for the purpose of nonmandatory activities. AIP Conference Proceedings 1903, 060011 (2017); https://doi.org/10.1063/1.5011565
[9] Yayat KD, Kombaitan B, Purboyo H (2018) Hotel trip generation in tourism city (Case study: Bandung City, Indonesia. Sci.Int.(Lahore) 30(2): 177-181
[10]Zenina N, Borisov A (2013) Regression analysis for transport trip generation evaluation. Information Technology and Management Science 2013(16): 89-94
[11]Amavi AA, Romerob JP, Dominguez A, dell’Olio L, Ibeas A (2014) Advanced trip generation/attraction models. Procedia - Social and Behavioral Sciences 160 (2014): 430–439
[12]Sasidhar K, Vineeth Y, Vineethreddy, Subbarao SSV (2016) Trip attraction rates of commercial land use: A case study. Indian Journal of Science and Technology 9(30): 1-5
[13]Al Razib MS, Rahman FI (2017) Determination of trip attraction rates of shopping centers in Uttara Area, Dhaka. American Journal of Management Science and Engineering 2(5): 150-155