3034
Balanced Housing Policy Optimization
Riski Trisuci, Hanny Wahidin Wiranegara, Yayat Supriatna, Anindita Ramadhani
Abstract— Balanced housing policy objective is to reach a harmony in diversity. It regulates the diversity of housing units into 3:2:1 proportion. It shows a comparison of 3 simple type houses, 2 medium types, and 1 luxury type based on its area or price. Due to the profit gain, the developers found it difficult to apply. This study aim is to identify the optimized housing proportion fulfilling the comparison and still gaining the profit. The unit of analysis is cluster where the community harmony can take place. Burgundy Residence and Olive Residence in Summarecon Bekasi took as samples. The research method is operational research. By comparing the number of each house types, its affordability, and its proportion using the simplex-method showed that there is inconsistency in this balanced housing policy based on an area and price. The two clusters showed imbalance proportion in term of area and affordability. The optimization has balanced proportion with an expanded stretch of land. The unit prices also need to be increased to keep gaining the profit. In terms of affordability, the real price of the simple type is much higher than the price set in the policy. The housing type proportion based on the area and prices are not synchronous. The balanced housing policy in terms of price cannot realize its objectives because the simple type is certainly not able to be in one stretch with two other types. It means that the goal of balanced housing policy to create harmony cannot be achieved.
Index Terms— balanced housing proportion, balanced housing policy, landed housing, house affordability, simplex-method —————————— ◆ ——————————
1 INTRODUCTION
BALANCED housing or “social mix” (in Europe) or “mixed income communities” or “poverty deconcentration” (in the U.S) has been recently employed to combat socio-spatial segregation and prevent the formation of new clusters of deprived households [1]. In neighbourhoods where social mix has evolved ‘organically’ over time, social mix is more likely to be a positive phenomenon [2]. It is a prerequisite for the development of 'inclusive', 'sustainable' and 'cohesive' communities (Arthurson in 3). The idea of social mix can be implemented in quite different ways, even within the same jurisdictional, urban, economic, and cultural context (Arthurson in 4). Balanced housing is about having a mix of people with different characteristics such as age, tenure, class, income, ethnicity and so on [5, 6]. ‘Balance’ connotes an external reference point with which comparisons can be made. It goes beyond a mere description of local, compared to ‘reference’, population attributes [5]. Social mix and balance must be guaranteed in the territorial space at the scale of buildings, districts, cities, and conurbations [7]. Inconsistent housing policies of communities have a number of destructive consequences, including increasing differentiation in the level of socio-economic development across communities and less coherent socio-economic space of an agglomeration [8]. Due to concentrated poverty leads to high aggregated social costs [9] such as unemployment [10], violence and homicides [11], crime [10], etc., balanced housing offer an alternative to the ills of concentrated poverty [10]. Balanced housing or social mix housing policy may accomplish a number of social [10, 8, 12, 13], economic [10, 12, 14] and environmental outcomes [10] that improves the welfare of residents [8]. Composition, concentration, and scale are the three aspects of social mixing policies [1]. Composition is the basis for mixing the people (ethnicity, race, religion, income, housing tenure, etc.).
Concentration is the amount of which group comprise the ideal mix or minimally required to produce the desired outcomes. Scale is the level of geography which relevant mix be measured. More research might be needed to address the question of what kinds of diversity might ‘work’ best, where and in what combinations [13]. This study chosen income and housing type as a basis in the neighborhood scale (such as a cluster in housing) with an ideal mixture 3:2:1. In Indonesia, there is a ministerial regulation on balanced housing as stated in [15][16][17]. As a guideline for the proportion of house types, the basis used is the area and price of the house. Regarding affordability, the problem is the proportion of simple types. Generally this simple type is ignored. Private developers have reasons for the difficulty of applying these balanced housing rules, related to profit gaining. Therefore, it was needed to identify the problem in optimizing the application of this balanced housing. One side of the simple type is not excluded, on the other hand it still giving profit. In the fringe of Jabotabek area as the largest metropolitan in Indonesia, a number of large-scale housing is growing, including Sumarecon Bekasi. As one of the big scale residential area, it was chosen as a sample to answer this research question: what is the proportion of housing units based on their type that follows the rules of balanced housing while still providing benefits to the developer?
2 LITERATURE
REVIEW
2.1 Balanced Housing Pattern
Balanced housing is built in a balanced pattern including different types of house, applied from the neighborhood scale to over than 10.000 units of housing. Balanced pattern has a certain proportion among simple houses, medium houses, and luxury homes. Provisions for balanced housing must meet the location and composition requirements as shown in Table 1. Referring to the regulations, Summarecon Bekasi with more than 1000 housing units, so a simple type should be in the same stretch with other types.
____________________________
• Riski Trisuci (Author): Department of Urban and Regional Planning,
Universitas Trisakti, Jakarta, Indonesia
• Hanny Wahidin Wiranegara (Corresponding Author): Department of
Urban and Regional Planning, Universitas Trisakti, Jakarta, Indonesia, 0811803994. E-mail: [email protected]
3035
TABLE1.
PROVISIONS FOR BALANCED HOUSING
Scale Location Terms Composition Terms
Housing (50 - 1000 units)
Simple houses may not be in one stretch, but must be in the same district/city
1) Proportion of numbers per type of house is: simple houses: medium houses: luxury homes = 3:2:1 2) Composition of simple
house area min. 15% of the total land area Settlements (1000 -
3000 units)
Simple house must be in the same stretch Residential Environment
(3000 - 10,000 units)
Settlement area (more than 10,000 units)
Source: [16], [17]
The objectives of implementing the balanced housing policy are: a) item 1: ensuring the availability of luxury homes, medium-sized houses, and simple houses in one stretch or not in one stretch for a simple house; b) item 2: realize harmony among various groups of people from various professions, economic levels, and social status starting on the scale of housing, settlements, housing environment, and settlement areas; c) item 3: realize cross subsidies for the provision of infrastructure, facilities and public utilities, as well as financing housing construction; d) item 4: creating harmony of living spaces both socially and economically, and e) item 5: utilizing the use of land intended for housing and settlement areas. This is in lined with [18], one of the important goals of the existence of balanced housing is to develop people, families and communities that are healthy and sustainable. Based on the regulation by Minister of Public Housing [17]: a) simple house is a public house built on land with floor area and selling price in accordance with government regulations, where the price provision is contained in [19]. b) medium house is a
commercial house with a selling price of more than 1 (one) to 6 (six) times the selling price of a simple house. c) luxury house is a commercial house with a selling price greater than 6 (six) times the selling price of a simple house. While public house is organized to meet the needs of the low-income people but the commercial house is held for profit generally done by private developers. The highest selling price limit for simple landed houses in Jabotabek (zone II) based on regulation of [20] is 158 million rupiah.
2.2 Affordable Housing
[21] defined affordable housing as the houses that have a lower price than the prevailing market price in meeting the affordability requirements of the low income people. Affordability can be measured by various indicators. Affordability of housing is broadly related to factors of the economic level of the community. According to [22], if a household spends more than 30% of its income on housing then there is an affordability problem, i.e. the household does not have the ability to occupy a decent place to live. Based on law [23], rental rates are not greater than 1/3 of the income of low-income people. Affordability of low income people (called MBR) is approached with a ratio of 30% or 1/3 of the income spent on housing. Central government accommodates affordable housing with the simple type houses. As stated in [20] that the simple house is a house built on land with a land area of 60-200 m2 with a maximum limit on housing prices
according to the existing zoning. Based on [24] and [25], the MBR is a community that has an income of three and a half million to five and a half million rupiahs a month. To get an idea of the amount of the MBR income, it is assumed to be a
minimum wage in the relevant zone. The average minimum wage in the city and regency areas covered by the Jabodetabek area is 3,927,561.38 rupiahs [26], so that the standard price that is affordable for housing in the Jabodetabek area is a maximum of 1,309,187.13 rupiahs per month. The price of land that used for affordable housing must be able to produce affordable housing prices by the MBR.
2.3 Balanced Pattern for Landed Housing
The results of previous studies on the proportion of the various housing types in the landed housing using the simplex-method showed an alternative proportion of the number of housing types that still provides benefits. That is, the proportion of different types of houses can be optimized to meet balanced housing while still gaining profit. The following are the results of those research:
1) Based on [27] by the simplex-method, the number of each type of the houses built were 4 units of type 80 m2, 24 units of type 57 m2, 3 types of houses of 50
m2, and 14 types of houses of 42 m2. The maximum
profit that will be obtained by UD Griya Cempaka Alam Real Estate is 2,484,000,000 rupiahs.
2) The results of [28] research: a) to obtain maximum profit, the type to be built is a simple type (type 65/144) of 387 units, a medium type (type 96/180) of 69 units and a type 141/144 as many as 95 units, as well as luxury types (type 221/200) as many as 64 units. The maximum profit is 78,483,073,000 rupiahs; b) the development plan consists of ten types with a total of 521 housing units with a profit of 75,092,668,000 rupiahs while using the simplex method only four types of buildings were built with a total of 636 housing units with a maximum profit of 78,483,073,000 rupiahs. From this, it can be seen that optimization using the simplex method obtained a greater gain of 3.3 billion rupiahs.
3 METHODS
3036 function. In operating linear programming, the simplex-method
was used. This method mathematically starts from the feasibility of solving basic to other feasible basic solutions, which was done repeatedly until an optimum solution is reached.
The steps in using the simplex method are as follows.
1. The Purpose Function: It is formed based on the total profit of each type of houses.
2. The Limitation Function: It is formed based on factors that influence housing development by developers, namely: land area, number of units, and average price per house type. Based on these three constraints, three kinds of boundary functions was formed, namely the land area constraint function, the number of units constraint function, and the average price per house type constraint function. The latest type constraint function itself consists of three kinds, namely the constraint of simple houses versus medium houses, the function constraints of medium houses versus luxury houses, and the function constraints of simple houses versus luxury homes.
4 ANALYSIS
AND
DISCUSSION
The first step in analysis is to identify the policy as the base for the balanced housing proportion. The second, to calculate the existing proportion of houses based on area and price in the sampled clusters. The third, to optimize housing types in accordance to the policy.
4.1 Policies Inconsistencies
The regulation analysis showed that there are inconsistencies in the policies that apply. Inconsistencies between the objectives and the rules in [16],[17] article 7 paragraph 1 is contradictory to the objectives of item 2 and item 4. In the paragraph it is stated that the location requirements for simple types can be carried out in one or the same stretch as other types as long as they are still in the same regency/city. If a simple type of house is separated from the type of medium and luxury homes, the objective of a balanced housing for item 2 and item 4 can not be achieved. That is there will be no interaction between different economic and social groups. To achieve the objectives of item 2 and item 4, a simple type should only be allowed to be built on the same stretch.
4.2 Balanced Housing Proportion Optimization
The analysis of the proportion and the optimization of Burgundy and Olive Residence housing proportion are explained as follows. In order to meet the requirement of the regulation, the proportion of housing has to be shifted to 3:2:1 (simple: medium: luxury); in the other hand, the proportion also need to consider the developer’s benefit. Therefore, there are two aspects considered on the modelling, i.e. land area and price of housing.
4.2.1 Optimization in Burgundy Residence Cluster
The range area of existing land in Burgundy Residence Cluster is as follows: the smallest or simplest type of housing land area is 55-91m2, the medium or medium type has 92-127m2, and the
luxury type is 128-163m2. Table 2 shows an overview of existing
housing in the Burgundy Residence cluster.
TABLE2
THE NUMBER OF UNITS,SIZES AND AVERAGE PRICES PER HOUSE
TYPE IN THE BURGUNDY RESIDENCE CLUSTER
Category number of units
average area per unit (m2)
average price per unit (in
rupiahs) Simple type 195 76.3 1,393,067,692 Medium type 161 104.8 1,987,863,975 Luxury type 32 156.4 2,067,175,000
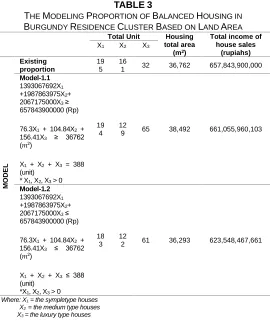
Based on table 2, the proportion of the simple types: medium types: luxury types in Burgundy Residence Cluster was 6:5:1. It hasn’t meet the regulated proportion that was 3:2:1. The average price of the simple units also not as intended in the regulations. Optimization models of balanced housing proportion in Burgundy Residence Cluster was built in accordance to the regulation of 3:2:1 units. Model-1.1 built with the condition of expanded stretch of land and the model-1.2 built with the existing stretch of land.
Table 3 shows the proportion model of the balanced housing in Burgundy Residence Cluster based on the area.
TABLE3
THE MODELING PROPORTION OF BALANCED HOUSING IN
BURGUNDY RESIDENCE CLUSTER BASED ON LAND AREA
Total Unit Housing
total area (m2)
Total income of house sales
(rupiahs) X1 X2 X3
M
ODE
L
Existing proportion
19 5
16
1 32 36,762 657,843,900,000 Model-1.1
1393067692X1 +1987863975X2+ 2067175000X3 ≥ 657843900000 (Rp)
76.3X1 + 104.84X2 + 156.41X3 ≥ 36762 (𝑚2)
X1 + X2 + X3 = 388 (unit)
* X1, X2, X3 > 0
19 4
12
9 65 38,492 661,055,960,103
Model-1.2 1393067692X1 +1987863975X2+ 2067175000X3 ≤ 657843900000 (Rp)
76.3X1 + 104.84X2 + 156.41X3 ≤ 36762 (𝑚2)
X1 + X2 + X3≤ 388 (unit)
*X1, X2, X3 > 0
18 3
12
2 61 36,293 623,548,467,661
Where: X1 = the sympletype houses
X2 = the medium type houses
X3 = the luxury type houses
3037 type is 2.
179,932,981.68-.
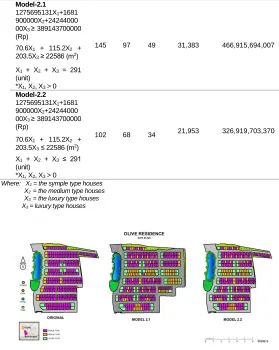
Fig. 1 Burgundy Residence Optimization Site Plan
Fig. 1 shows more diverse layout in model 1 and 2 than the original layout. The housing types diversity is hoped to be a way to enhance of social harmony.
4.2.2 Optimization in Olive Residence Cluster
In the Olive Residence cluster, the simple type has an area of 55-104.5 m2, the medium type is 104.6-154 m2, and the luxury
type is 155-203.5 m2. See Table 4. Based on this table, the
proportion of simple types: medium types: luxury types in Olive Residence Cluster is 24.2:1.2:1. It hasn’t met the regulated proportion of 3:2:1. The average price of the simple type is also not as intended in the regulations. The optimization models of balanced housing proportion in Olive Residence Cluster was built in accordance to the regulation of 3:2:1 units. Model-2.1 built with the condition of expanded stretch of land and the model-2.2 built with the existing stretch of land.
TABLE4
THE NUMBER OF UNITS,SIZES AND AVERAGE PRICES PER HOUSE
TYPE IN THE OLIVE RESIDENCE CLUSTER
Category number of units
average area per unit (m2)
average price per unit (rupiahs) Simple type 267 70.6 1,275,695,131 Medium type 13 115.2 1,681,900,000 Luxury type 11 203.5 2,424,400,000
Table 5 shows the modeling proportion of balanced housing in Olive Residence Cluster based on the area (m2).
TABLE5
MODELING PROPORTION OF BALANCED HOUSING IN OLIVE
RESIDENCE CLUSTER BASED ON LAND AREA
Total Unit Housing
total area (m2)
Total income of house sales
(rupiahs) X1 X2 X3
M Existing proportion O D E L 267 13 11 22,586 389,143,700,000
Model-2.1 1275695131X1+1681 900000X2+24244000 00X3 ≥ 389143700000 (Rp)
70.6X1 + 115.2X2 + 203.5X3 ≥ 22586 (m2)
X1 + X2 + X3 = 291 (unit)
*X1, X2, X3 > 0
145 97 49 31,383 466,915,694,007
Model-2.2 1275695131X1+1681 900000X2+24244000 00X3 ≥ 389143700000 (Rp)
70.6X1 + 115.2X2 + 203.5X3 ≤ 22586 (m2)
X1 + X2 + X3≤ 291 (unit)
*X1, X2, X3 > 0
102 68 34 21,953 326,919,703,370
Where: X1 = the symple type houses
X2 = the medium type houses
X3 = the luxury type houses
X3 = luxury type houses
Fig. 2 Olive Residence Optimization Site Plan
3038 are affordable for people with minimum income of
Rp.17,524,861.86. The minimum income level was calculated three times the value of installments so that the house is considered affordable. This is in accordance with the theory of occupancy affordability. The price of an affordable mortgage or rent is 1/3 or 30% of income per month [22].
4.4 Discussion
The procedure adopted is to juxtapose the results of the analyses of two cases with the applicable provisions to determine the application of the policy. Matters to be compared include:
1) Proportion of the house types. Based on the law [17] article 8, both of the clusters do not meet the standard. However, in Burgundy Residence, the proportion of simple types has exceeds the required amount.
2) The size of a simple type. Based on: a) Law [17], article 1 paragraph 5 states that a simple type is a public house built on land with floor area and selling price in accordance with government regulations, b) Law [20], item g. Provisions on the area of a simple type houses in both clusters are met, in fact all types actually has an area that includes the broad category of a simple house.
3) The simple type house prices. Referring to: a) Law [17], article 1 paragraphs 5 and b) Law [20], item d. The limit on the price of landed houses applicable for 2019 is 158 million rupiah, while the smallest type in both clusters has an average price of >1 billion rupiah. This condition due to the land price, so it must be controlled.
4) Expanse of development. Based on law [16], article 7 paragraph 1, the location of balanced housing may be on one stretch or not, as long as it is still in the same district/city. These provisions allow to build simple types in a separate area with medium and luxury types. If they are not built in one overlay, the developer should build a simple type of house on a different stretch, but in reality it is not fulfilled.
5) Meeting the obligations of simple type houses.
Developers do not build the simple types with prices according to government restrictions on the same stretch, different overlays, or build public flats. Fulfillment of simple type obligations with an area and price that is in accordance with government restrictions is not implemented.
In general it can be concluded that these policies in force have provisions that cannot be fully implemented. Balanced housing in terms of area per house type can be fulfilled. In terms of its price, the type of simple house will still not be affordable by the MBR. So, balanced housing has not yet been implemented. Balanced housing policy should offer economic and social sustainability. Various diverse groups of people living in the same stretch from the cluster/neighborhood scale are expected to foster mutual relations. This relationship is only created if there is a space for interaction among the residents that can take place every day. It has been a challenge for developers to participate in realizing a balanced housing policy. Government and private collaboration need to be done. The efforts need to do are as follows. First, provide land
supply and controlling land prices for urban housing development. Second, enforce rules about limiting the ceiling price of simple type to stay affordable. Third, limiting maximum land tenure by private. Fourth, upholding the social function of the land both in policy and implementation. Fifth, trying to implement cross subsidy inter income groups.
5 CONCLUSSIONS
The balanced housing policy shows the inconsistency between the objectives and the rules therein. The goal of creating socioeconomic harmony can be achieved on a cluster scale. On this scale, optimization of the proportion of balanced housing can be met from calculations based on land area, but not in terms of house prices. With the price of land in urban areas that is not controlled, then the maximum price provisions for simple houses cannot be met, so that the prices of simple houses are not affordable for the low income group. This has made it difficult to implement a balanced housing policy on one stretch of landed housing.
ACKNOWLEDGEMENT
Many thanks to the members of Urban and Regional Planning Program, Universitas Trisakti for their assistance and Summarecon Bekasi for providing the data so the research could take place.
REFERENCES
[1] G. Galster, "Neighborhood Social Mix: Theory, Evidence, and Implications for Policy and Planning." Policy, Planning, and People: Promoting Justice in Urban Development, 2013.
[2] A. Morris, M. Jamieson, and R. Patulny, "Is social mixing of tenures a solution for public housing estates?"
Evidence Base, vol. 1, available at
https://apo.org.au/sites/default/files/resource-files/2012/07/apo-nid30251-1150156.pdf, Australia, 2012. [3] K. Arthurson, "Creating Inclusive Communities through
Balancing Social Mix: A Critical Relationship or Tenuous Link?", Urban Policy and Research, vol. 20 no. 3, pp. 245-261, DOI: 10.1080/0811114022000005898, UK, 2002. [4] K. Arthurson, "Social Mix and the City: Challenging the
Mixed Communities Consensus in Housing and Urban Planning Policies", Collingwood: CSIRO Publishing, 2012. [5] I. Cole and B. Goodchild, "Social Mix and the ‘Balanced
Community’ in British housing policy – a tale of two epochs" GeoJournal, vol. 51, pp 351-361. DOI: https://doi.org/10.1023/A:1012049526513, Netherland, 2000.
[6] D. Rose, A. Germain, M. H. Bacqué, G. Bridge, Y. Fijalkow, and T. Slater, "‘Social Mix’ and Neighbourhood Revitalization in a Transatlantic Perspective: Comparing Local Policy Discourses and Expectations in Paris (France), Bristol (UK) and Montréal (Canada)",
International Journal of Urban & Regional Research, vol. 37 no. 2, pp. 430-450, DOI: 10.1111/j.1468-2427.2012.01127.x, 2013.
[7] J. P. Brouant, "Social cohesion and land use law: is there a place for legal regulation in France?" Land Use Law, Housing and Social and Territorial Cohesion, pp. 59-65, available at https://serdeaut.univ-paris1.fr/fileadmin/atelierdroitfiscal/brouant_social_cohesi on_01.pdf, 2006.
3039 Ufimtseva, "Housing sector development in
socio-economic space of agglomeration" MATEC Web Conf.,
vol. 143, 04001, DOI: 10.1051/matecconf/201714304001, Russia, 2018.
[9] I. Tosics, "Towards balanced metropolitan housing markets: the role of government, planning policy and financial regulations" Enhr Conference. available at https://www.enhr.net/documents/2011%20France/WS04/P APER-YvanTosics-WS04.pdf , France, 2011.
[10]R. L. Glover, A. Carpenter, and R. Duckworth, "Developing Inclusive Communities: Challenges and Opportunities for Mixed-Income Housing (2017-06-01)". FRB Atlanta Community and Economic Development Discussion
Paper, No. 2017-1. Available at SSRN:
https://ssrn.com/abstract=2993829, June, 2017.
[11]J. E. Rosenbaum, L. K. Stroh, and C. A. Flynn. "Lake Parc Place: A study of mixed‐income housing," Housing Policy
Debate, vol. 9 no. 4, pp 703-740, DOI:
10.1080/10511482.1998.9521314, 1998.
[12]G. Galster, "Neighbourhood Social Mix as a Goal of Housing Policy: A Theoretical Analysis" European Journal of Housing Policy, vol. 7 no. 1, pp. 19-43, DOI: 10.1080/14616710601132526 , UK, 2007.
[13]R. Atkinson, "Occasional Paper 1: Neighbourhoods and the Impacts of Social Mix: Crime, Tenure Diversification and Assisted Mobility" Housing and Community Research Unit/ESRC Centre for Neighbourhood Research, available at
https://pdfs.semanticscholar.org/f2f6/d343657f7becd393f3 499e229c53b0f1c829.pdf , Australia, 2005.
[14]D. J. Manley, M. V. Ham, and J. Doherty, "Social mixing as a cure for negative neighbourhood effects: Evidence based policy or urban myth?" Mixed Communities: Gentrification by Stealth? , pp. 151-168. DOI: https://doi.org/10.1332/policypress/9781847424938.003.0 011, Policy Press: Bristol, 2012.
[15]Joint Decree of the Minister of Home Affairs, the Minister of Public Works, and the Minister of Public Housing Number 648-381 of 1992, 739/KPTS/1992, and 09/KPTS/1992 Guidelines for the Development of Housing and Settlements with a Balanced Housing Environment. Jakarta.
[16]Minister of Public Housing Regulation No. 10 of 2012 Implementation of Housing and Settlement Areas with Balanced Housing. Jakarta.
[17]Minister of Public Housing Regulation No. 07 of 2013 Amendment to the Regulation of the Minister of Public Housing No. 10 of 2012 concerning Implementation of Housing and Settlement Areas with Balanced Housing. Jakarta.
[18]F. Hanurawan. “Perspective of Social Psychology towards the Implementation of Balanced Residential Development Policies for the Development of Healthy, Sustainable of Individuals, Families, and Communities”. Journal of Psychological Science, vol. 5, no. 1, pp. 1-7. http://journal2.um.ac.id/index.php/JSPsi/article/view/604/3 70, 2015.
[19]Minister of Public Works and Public Housing Decree No. 1126/KPTS/M/2018 Limitation on Selling Price of Prosperous Houses for Credit/Financing of Subsidized Housing Ownership.
[20]Minister of Public Works and Public Housing Decree No. 587/KPTS/M/2019 concerning Zone Areas, Amounts of
Income Limits, Limits for the Lowest Balance of Applicant Savings, Limitation of Landed House Prices and Flats, Unrestricted Limits on the Construction of Self-Help Homes, Limits of Land Area and Area of Houses, Limitation of Funds for Assistance in the Funding of Housing Based on Housing Savings, and Index in the Implementation of Savings Based Housing Financing Assistance.
[21]E. Mulliner, K. Smallbone, and V. Maliene, “An Assessment of Sustainable Housing Affordability Using A Multiple Criteria Decision Making Method”. Omega, vol.
41, no. 2, pp. 270-279, DOI:
https://doi.org/10.1016/j.omega.2012.05.002 , 2012. [22]A. Downs, “Still Stuck in Traffic: Coping with Peak-Hour
Traffic Congestion”. Brookings Institution Press, JSTOR, available at www.jstor.org/stable/10.7864/j.ctt1vjqprt. 2004.
[23]Minister of Public Housing Regulation No. 14 of 2007 Rental Management of Rental Housing. Jakarta.
[24]Minister of Public Housing Regulation No. 27 of 2012 Procurement of Housing through Credit/Financing of Prosperous Ownership with Supporting Liquidity Facilities Housing Finance. Jakarta.
[25]Minister of Public Housing Regulation No. 28 of 2012 Instructions for Implementing Housing Procurement through Credit/Financing of Prosperous Ownership with Support of Liquidity Facilities Housing Finance. Jakarta. [26]-, “List of UMP/UMK in the Jabodetabek Region in 2019”,
Available at https://www.infojabodetabek.com/daftar-ump-umk-di-wilayah-jabodetabek/. 2019.
[27]H. Natalia, A. Sahari, and A. I. Jaya, “Optimization of Housing Development Using Simplex Method (Case Study: UD. Griya Cempaka Alam Residence)”. Jurnal Ilmiah Matematika Terapan, vol. 12, no. 1, pp 74-82, DOI: http://dx.doi.org/10.22487/j2450766X.2015.v12.i1.7489, 2015.
[28]R. F. Utari and A. S. Amal, “Optimization of The Number of Household Production in Housing Development Projects Using Simplex Method (Case Study: PT. Araya Bumi Megah Malang)”. Media Teknik Sipil, vol. 10, no. 2, pp 174-182, DOI: 10.22219/jmts.v10i2.1792, 2012.