© 2015 IJSRST | Volume 1 | Issue 3 | Print ISSN: 2395-6011 | Online ISSN: 2395-602X Themed Section: Science and Technology
Optimization of EDM parameters on surface quality and MRR of
WC-40Cocomposites using NSGA-II
D. Kanagarajan
Department of Manufacturing Engineering, Annamalai university, Annamalai Nagar, Tamil Nadu, India Email: [email protected]
ABSTRACT
The correct selection of manufacturing conditions is one of the most important aspects to take into consideration in the majority of manufacturing processes and particularly, in processes related to Electrical Discharge Machining (EDM). It is a capable of machining geometrically complex or hard material components, that are precise and difficult-to-machine such as heat treated tool steels, composites, super alloys, ceramics, carbides, heat resistant steels etc. In the present work, the effectivenessof the EDM process with tungsten carbide and cobalt composites is evaluated in terms of the material removal rate and the surface finish quality of the workpiece produced. The objective of this research is to study the influence of operating parameters of EDM such as pulse current, pulse on time, electrode rotation and flushing pressure on material removal rate and surface roughness. The experimental results are used to develop the statistical models based on second order polynomial equations for the different process characteristics. The non-dominated sorting genetic algorithm (NSGA-II) has been used to optimize the processing conditions. A non-dominated solution set has been obtained and reported.
Keywords: WC/Co composite. Electrical discharge machining (EDM). Non-dominated sorting genetic algorithm(NSGA-II)
I.
INTRODUCTIONElectro discharge machine manufacturers and users are always interested in acquiring better stability and higher productivity in the machining process. The higher rate of material removal with desired accuracy and minimal surface damage make the EDM operation less costly and the process more economically viable and affordable. However, due to a great number of variables and a variety of products, optimal machining performance is rarely achieved. It is necessary to investigate how the erosion parameters affect the machining process. The results will provide significant information to achieve optimal performance in the process [1].
Often optimization problems have multiple objectives. Most of the time these objectives are conflicting (i.e.,
applied in various problem solving tasks and have received a great deal of attention even by the classical multicriteria optimization and decision-making communities [5].Non dominatedSortingGA (NSGA-II) is one of the most widely used method for generating the Pareto frontier. The NSGA-II algorithm ranks the individuals based on dominance. NSGA-II uses elitism and a phenotype crowd comparison operator that keeps diversity without specifying any additional parameters [6].
The present study is focused on the die-sinking EDM of cobalt bonded tungsten carbide (WC–Co), to analyze the influence of current intensity, pulse time, electrode rotational speed and flushing pressure over technological variables such as surface roughness, and matel removal rate (MRR). The use of DOE and regression techniques has enabled to create second order polynomial models, which make it possible to explain the variability associated with each of the technological variables studied. In addition, these models can be used for optimization by which the optimum parameter settings can be obtained for the desired objectives [7].NSGA-II algorithm has been used for the optimization of EDM characteristics of WC-Co composites. The objectives of the present study for optimization are maximization of the MRR and minimization of surface roughness. The NSGA-II algorithm has been used for optimization of EDM characteristicsof WC/Co composites.
II.
EXPERIMENTAL STUDYThe experiments were conducted in an Electronica diesinking EDM (M100 model, Electronica, India) machine,which has been equipped with a transistor switched powersupply. The electrode has been fed downwards under servocontrol into the workpiece. Copper cylindrical electrodes of12 mm diameter were used as tool. Kerosene was used as adielectric fluid. The dielectric fluid was circulated by jetflushing. The machining conditions are provided in Table I.
Parameter ranges are selected on the basis of preliminary experiments conducted by using a one variable at a timeapproach. There are a large number of factors to considerwithin the EDM process, but in this work the level of thecurrent, pulse on time, electrode rotation and dielectricflushing pressure have only been taken into account asdesign factors. The factors and setting levels are presentedinTable II[8]. Experiments have been conducted accordingto L27 orthogonal array covering the full range ofcurrent settings, with pulse on time settings to collect moredata for modeling. For each experiment, a new set of tooland workpiece has been used. The experiments wereconducted on WC/40%Co composites. The density ofWC and Co are 15.7 g/cc and 13.55 g/cc while the grainsizes of WC and Co are
6 μm and 3 μm, respectively.
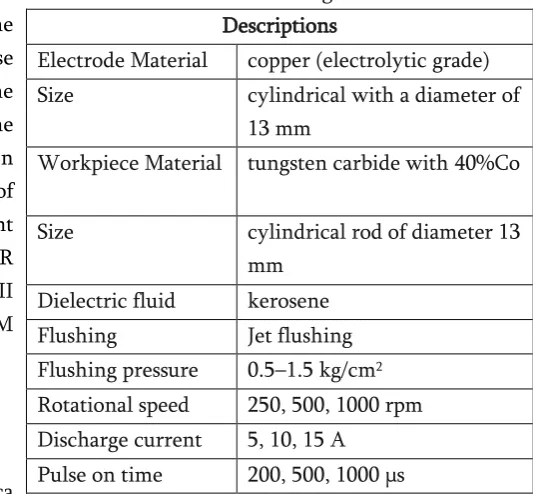
TABLE I. Machining conditions Descriptions
Electrode Material copper (electrolytic grade) Size cylindrical with a diameter of
13 mm
Workpiece Material tungsten carbide with 40%Co
Size cylindrical rod of diameter 13 mm
Dielectric fluid kerosene Flushing Jet flushing Flushing pressure 0.5–1.5 kg/cm2
Rotational speed 250, 500, 1000 rpm Discharge current 5, 10, 15 A
Pulse on time 200, 500, 1000 μs
The response variables selected for this study are metalremoval rate (MRR) and surface roughness (Ra), the metalremoval rate has been calculated using the followingexpression:
machining of
Time
part from removed matel
of Volume )
The surface roughness has been measured on a SurfcoderSE1200 surface testing analyser (Kosaka, Japan). Foreach sample, five readings of surface roughness were takenand an average value of the five was considered as the finalreading. The results are presented in Table 3.
TABLE III
Electro discharge machining characteristics of WC-40Co composite
S.No
Elec
trod
e
rot
ati
on,
rpm
C
urre
nt
,
A
P
ulse
on
time, µs Flush
in
g
pre
ssure
,
K
g/
cm
2
MRR, mg/
m
in
Ra, µm
1. 250 5 200 0.5 67.22 10.22 2. 250 5 200 1.0 142.21 7.81 3. 250 5 200 1.5 149.22 5.93 4. 250 10 500 0.5 76.55 14.24 5. 250 10 500 1.0 151.53 9.81 6. 250 10 500 1.5 138.51 7.73 7. 250 15 1000 0.5 83.82 17.52 8. 250 15 1000 1.0 158.86 13.31 9. 250 15 1000 1.5 145.81 11.22 10. 500 5 500 0.5 84.58 10.51 11. 500 5 500 1.0 159.10 6.93 12. 500 5 500 1.5 146.01 5.75 13. 500 10 1000 0.5 99.31 12.61 14. 500 10 1000 1.0 174.31 8.45 15. 500 10 1000 1.5 161.32 6.37 16. 500 15 200 0.5 116.22 13.32 17. 500 15 200 1.0 180.28 9.62 18. 500 15 200 1.5 178.22 8.93 19. 1000 5 1000 0.5 78.81 9.83 20. 1000 5 1000 1.0 153.82 5.61 21. 1000 5 1000 1.5 140.81 5.95 22. 1000 10 200 0.5 103.72 9.12 23. 1000 10 200 1.0 160.57 5.68 24. 1000 10 200 1.5 165.71 7.25 25. 1000 15 500 0.5 105.02 13.37 26. 1000 15 500 1.0 180.33 9.46 27. 1000 15 500 1.5 167.22 7.32
TABLE II
Process parameters and their levels
Parameters Level 1 Level 2 Level 3 Rotational speed,
rpm
250 500 1000
Current, A 5 10 15
Pulse on time, s 200 500 1000 Flushing pressure,
Kg/cm2
0.5 1.0 1.5
III.
STATISTICAL MODELINGStatistical models based on second order polynomialequations are developed for the different process characteristicsusing the experimental results.
MRR(Metal removal rate) = -154.553-0.202S+5.607C-0.042T+41.401P-0.001S2+0.162C2+0.001T2-17.933P2+
0.002SC-0.004ST-0.023SP+0.013CP-0.001TP
Ra(surface roughness)=16.988-0.012S-0.028C+0.009T-13.376P+0.001S2+0.026C2-0.002T2+3.977P20.003SC
-0.014ST-0.004SP-0.033CP-0.004TP
Here, electrode rotation (R) is in rpm, current ( I ) in
A,pulse on time ( T ) in μs and flushing pressure (P) in kg/cm2.
IV.
OPTIMIZATIONThe objectives of the present study for optimization are asfollows:
1. Maximization of the MRR
2. Minimization of surface roughness
A. General Procedure of Evolutionary Multi Objective Optimization
As stated before, dual goals in a multi objective optimization are to find a set of solutions as close as possible to the pareto optimal front and simultaneously as diverse as possible. Except the fitness assignment method for multiple objectives the basic structure of a pareto based evolutionary multi objective optimization is similar to that of GA [9]. The flow chart of the NSGA-II program is shown in Figure.1. It starts with a random initial generation. First, the parents and offspring are combined, to form a string. When the objective functions of all strings in a generation are calculated, the solutions are classified into various non dominated fronts.
B. NSGA-II Algorithm
The steps involved in the solution of optimization problem using NSGA-II are summarized as follows [10].
1. Population Initialization:
The population is initialized based on the problem range and constraints if any.
2. Non Dominated sort:
The initialized population is sorted based on non-domination. The fast sort algorithm is described as below
. for each individual p in main population P
-Initialize Sp= 0. This set would contain all the
individuals that is being
dominated by p. - Initialize np= 0. This would be the number of
individuals that dominate p. - for each individual q in P
*if p dominates q then
. add q to the set Spi.e. Sp= SP U{q}
* else if q dominates p then
. increment the domination counter for p i.e. np= np+ 1
- if np= 0 i.e. no individuals dominate p then p
belongs to the first front; Set rank of individual p to one i.e Prank= 1. Update the first
front set by adding pto front one i.eF1 = F1U{q}
. This is carried out for all the individuals in main population P.
. Initialize the front counter to one. i= 1
. Following is carried out while the ithfront is
nonempty i.e. Fi0
- Q = 0. The set for storing the individuals for (i+ 1)thfront.
- for each individual p in front Fi
* for each individual q in Sp(Spis the set of
individuals dominated by p)
. nq = nq -1, decrement the domination count for
individual q.
. if nq= 0 then none of the individuals in the
subsequent fronts would dominate q. Hence set qrank=
i+ 1. Update the set Q with individual q i.e. Q = Q U q. - Increment the front counter by one.
- Now the set Q is the next front and hence Fi
= Q.
This algorithm is better than the original NSGA [11] since it utilizes the information about the set that an individual dominate (Sp) and number of individuals
that dominate the individual (np).
C.Crowding Distance:
- initialize the distance to be zero for all the individuals i.e. Fi(dj) = 0,
where j corresponds to the jthindividual in
front Fi.
- for each objective function m
* Sort the individuals in front Fibased
on objective m i.e. I = sort(Fi,m).
* Assign infinite distance to boundary values for each individual
in Fii.e. I(d1) = andI
( )
dn =* for k = 2 to (n-1)
( ) ( ) (
1)
max.(
min 1)
. . m m k k f f m k I m k I d I d I − − − + + =. I(k).m is the value of the mthobjective function of
the kth individual in I
The basic idea behind the crowing distance is finding the euclidian distance between each individual in a front based on their m objectives in the m dimensional hyper space. The individuals in the boundary are always selected since they have infinite distance assignment.
D. Selection:
Once the individuals are sorted based on non domination and with crowding distance assigned, the selection is carried out using a crowded comparison operator(
n)[12]. The comparison is carried out asbelow based on
(1) non domination rank pranki.e. individuals in
front Fiwill have their rank
as prank= i.
(2) crowding distance Fi(dj)
. p
n qif- prank<qrank
- or if p and q belong to the same front FithenFi(dp) > Fi(dq) i.e. the crowding
distance should be more.
The individuals are selected by using a binary tournament selection with crowed comparison operator.
E. Genetic Operators:
Real coded GA's use Simulated Binary Crossover (SBX), operator for crossover and polynomial mutation [11].
5.1. Simulated Binary Crossover:
Simulated binary crossover simulates the binary crossover observed in nature and is give as below.
(
)
(
)
k k k k
k
p
p
c
1,1
1,1
2,2
1
−
+
+
=
(
)
(
)
k k k k
k
p
p
c
2,1
1,1
2,2
1
−
+
+
=
where ci,kis the ithchild with kthcomponent, pi,kis the
selected parent and k (
0) is a sample from a randomnumber generated having the density
( ) (
1
)
,
0
1
2
1
+
=
if
p
c c( ) (
1)
1 , 12 1 2 + = +
ifp
c
c
This distribution can be obtained from a uniformly sampled random number u between (0,1). cis the
distribution index for crossover. That is
( ) ( )
( 1)1 2 +
=
u u( )
(
)
( 1)1
1
2
1
+−
=
u
u
Polynomial Mutation:The polynomial mutation is performed by ck= pk+ (pku-pkl)k
where ckis the child and pkis the parent with pkubeing
the upper boundon the parent component, pklis the
lower bound and kis small variation which is
calculated from a polynomial distribution by using
, 1 ) 2 ( 1 1 −
= m+
k k r
(
)
21
, 0.51 1
1
−
−
= k + k
k r m if r
rkisan uniformly sampled random number between
(0,1) and
mis mutation distribution index.F. Recombination and Selection
The offspring population is combined with the current generation population and selection is performed to set the individuals of the next generation. Since all the previous and current best individuals are added in the population, elitism is ensured. Population is now sorted based on non domination. The new generation is filled by each front subsequently until the population size exceeds the current population size. If by adding all the individuals in front Fjthe population exceeds N then
individuals in front Fjare selected based on their
crowding distance in the descending order until the population size is N. The process repeats to generate the subsequent generations.
The control parameters of NSGA-II must be adjusted to give the best performance. The parameters used for the present study are probability of crossover pc=0.9
with distribution index η c=20, mutation probability
pm=0.25 and population size pz=100. It was found that
the NSGA-II with those control parameters produces better convergence and distribution of optimal solutions located along the Pareto optimal solutions. The 1000 generations are quite enough to find the true optimal solutions.
Figure 1: Flow chart of NSGA IIprogramme [12]
V.
DISCUSSIONElectro discharge machining characteristics of WC/Co composites produced through the powder metallurgy route are studied. Second order polynomial models were developedfor metal removal rate (MRR) and surface roughness(Ra) using MINITAB software. The fit summary recommendedthat the quadratic model is statistically significantfor analysis of MRR. The value of R2 is over 95%, whichmeans that the regression
model provides an excellentexplanation of the relationship between the independentvariables (factors) and the response (MRR). The associatedp-value for the model is lower than 0.05 (i.e., p=0.05, or95% confidence) indicates that the model is considered tobe statistically significant [14].TableIVpresents the results of the quadratic model for the MRR in the form of ANOVA. The value of P in Table IVfor this model is less than 0.05 (i.e.= 0.05, or 95% confidence) indicates that the model is considered to be statistically significant, which is desirable as it demonstrates that the terms in the model have a significant effect on the response.In the same manner, the main effect of electrode rotation (S) and pulse on time (T), second order effect of electrode
Start
Initialize population gen =0
Front = 1
Is population classified
Crowded tournament selection
New population
Selection & crossover & mutation
gen < Max gen
Stop gen=gen+1
Identify non dominated individual
Front = Front+1
Yes
Yes
No
rotation (S) and interaction effect of electrode rotation (S) with Current (C), pulse on time (T) and flushing pressure (P) are significant and the other model terms can be regarded as insignificant
TABLE IV
Analysis of Variance for MRR of WC-40%Co composite
Source DF SS MS F P
Regress .
13 35160.2 1
2704.6 1476.30 0.00 1 Linear 4 14175.2
2
3543.7 193435. 7
0.00 1 Square 4 13544.4
2
3386.1 184828. 5
0.01 2 Interact
i.
5 0.31 0.06 3.30 0.03
9 Resi.
Err
13 0.22 0.02
Total 26
The value of R2 calculated in Table 4for this model is
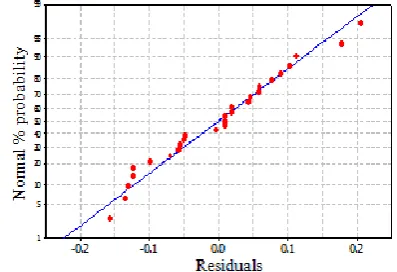
over 0.99, reasonable close to unity, which is acceptable. It indicates that about 99.3% of the variability in the data is explained by this model. It also confirms this model provides an excellent explanation of the relationship between the independent factors and the response. Figure2.displays the normal probability plot of the residuals for MRR. It shows the regression model is fairly well fitted with the observed values.the estimated response surface for MRR in relation to the design parameters of flushing pressure and electrode rotation. As can be seen from this figure, the optimum MRR (125.48mg/min) is obtained at electrode rotation (800 to 900rpm) and flushing pressure (1 to 1.25Kg/cm2). The rate of
increase in MRR is very high in the specified electrode rotation speed for any value of flushing pressure.
Figure 2.Normal probability plot residuals for MRR ofWC-40Co composite
Similarly the value of R2 for surface roughness is 96%
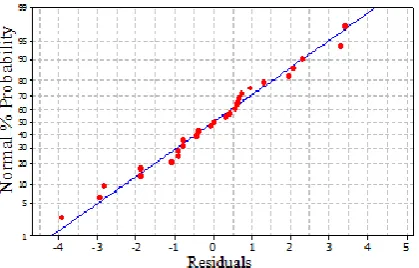
which means that the regression model provides anexcellent explanation of the relationship between the independent variables (factors) and the response (Ra). The associated p-value for the model is lower than 0.05 (i.e., p=0.05, or 95% confidence), which indicates that the model is considered statistically significant. The result proves that the electrode rotation and flushing pressure enhance the surface finish. The ANOVA table for the quadratic modelfor Ra is shown in Table V. The model results indicate that the model is significant and the lack of fit is insignificant. Figure 3 displays the normal probability plot of the residuals for Ra. It is observed that the residuals are located on a straight line, which means that the errors are normally distributed and the regression model is fairly adequate
TABLE V
Analysis of Variance for Ra of WC-40Co composite
Source DF SS MS F P
Regression 13 339.89 26.14 901.18 0.001 Linear 4 26.18 6.54 225.61 0.001 Square 4 14.70 3.67 126.71 0.004 Interaction 5 0.28 0.05 2.10 0.146 Resi. Error 13 0.37 0.02
Figure 3:Normal probability plot residuals for Ra of 60WC-40Co composite
A single objective optimization algorithm will normally be terminated upon obtaining an optimal solution. However, for most of the multi-objective problems, there could be a number of optimal solutions. Suitability of one solution depends on a number of factors including user’s choice and problem
environment, and hence finding the entire set of optimal solutions may be desired. Among the Paretooptimal solution, none of the solutions is absolutely better than any other solution and hence this solution is called asnon-dominated solution.
GAs can find good solutions to linear and nonlinear problems by simultaneously exploring multiple regions of the solution space and exponentially exploiting promising areas through mutation, crossover and selection operations. In general, the fittest individuals of any population are more likely to reproduce and survive to the next generation, therefore improving successive generations. Non dominating sorting GA (NSGA-II) developed by Deb and Goel in 2002 is of the best methods for generating the Pareto frontier and is used in this study. The NSGA-II algorithm ranks the individuals based on dominance. The fast nondominated sorting procedure allows us to find the non domination frontiers where individuals of the frontier set are not dominated by any solution. The crowding distance is calculated for each individual of the new population. Crowding factor gives the GA the ability to distinguish
individuals that have the same rank. This forces the GA to uniformly cover the frontier rather than bunching up at several good points by trying to keep population diversity. The comparison operator (≺n) is used by the GA to sort the population for selection purposes [15]. The procedure was repeated ten times to get a greater number of points in the Pareto solution set.
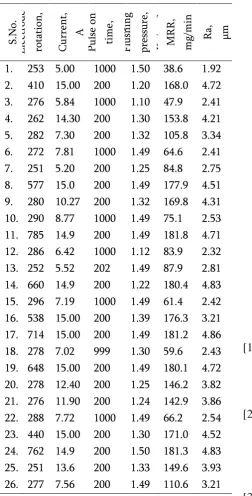
The non dominated solution set obtained over the entire optimization process is shown in Figure. 5. This shows the formation of the Pareto front leading to the final set of solutions. Thecorresponding objective function values and decision variables of this non-dominated solution set are given in Table IV. The 26 out of 100 sets were presented since none of the solutions in the non-dominated set is absolutely better than any other; any one of them is an acceptable solution. The choice of one solution over the other depends on the requirement of the process engineer. If a better surface finish or a higher production rate is required, a suitable combination of variables can be selected from Table V.
on the surface. More sparks produce much more wear. Hence the increase in pulse on time has negative effects in all the objectives and the optimum value obtained is close to the minimum value of pulse on time. The interaction effect of pulse on time and electrode rotation on MRR is gradually increases with reducing pulse on time. The optimum level exists when S= 700 to 900rpm, T=200 to 300 s, C=10A and P=1Kg/cm2 and the maximum possible MRR is
158mg/min.
From the experimental results presented in Table III the parameters for trial no.20 resulted in a Ra value of 5.61µm and the MRR of 153.82mg/min. By optimization using NSGA–II, it can be seen that the MRR can be increased to 181.8mg/min for the surface finish of 4.71µm (trial no.11 Table.IV), which is comparatively higher than that of the experimental value at the same time less surface roughness.It will be observed in the SEM observation of Figure 4.The optimum results of the RSM is MRR=158mg/min at 3.2µm Ra, incase of NSGA-II the optimum values are MRR=181.8mg/min with 4.71µm Ra. So the NSGA-II gives better solution than the RSM and also it is seen from the optimized results of the NSGA-II that trial no.16 from Table IV shows the MRR is 176.3mg/min at the same surface finish of RSM results. From the optimization results there are 10 different cases in which the MRR are greater than the highest value of MRR obtained by experiments with less roughness values.
Figure 4: Machined surface observed atS=785rpm, C =14.9A,
T =200 s,P=1.49Kg/cm2
From Table IV it is seen that the optimum values of electrode rotational speed ranges from 253 to 762rpm. Increase in speed beyond 762rpm may not have much impact on the EDM characteristics. In this composition, the MRR and Ra is higher than the
WC-40%Co composition which is
discussedKanagarajanetal(2008). Due to the increase in percentage of cobalt the strength of material is reduced, so MRR increases with cobalt content. From the optimized results there are many solutions available with less surface roughness and higher MRR values. Hence wide range of optimum current values are observed in Table IV.
The surface roughness depends on the size of spark crater during machining. To obtain a flat crater, it is important to control electrical discharging energy at a smaller level by setting a pulse on time. Since most EDM machines are designed to discharge with the electrical discharging current proportional to the pulse on time[17,18]. Obviously with shorter duration of sparks the surface finish will be better. Hence an optimum value of pulse on time is 200µs as observed from Table IV.
The optimum flushing pressure values are between 1.1 to 1.5Kg/cm2 as observed from TableIV.With low
reducing surface cracks and improve the surface quality [19].
TABLE IV
Optimal combinations of parameters for EDM of WC-40Co composite
S.No.
Elec
trod
e
rot
ati
on,
rpm
C
urre
nt
,
A
P
ulse
on
time, µs
Fl
ush
in
g
pre
ssure
,
K
g/
c
m
2
MRR, mg/
m
in
Ra, µm
1. 253 5.00 1000 1.50 38.6 1.92 2. 410 15.00 200 1.20 168.0 4.72 3. 276 5.84 1000 1.10 47.9 2.41 4. 262 14.30 200 1.30 153.8 4.21 5. 282 7.30 200 1.32 105.8 3.34 6. 272 7.81 1000 1.49 64.6 2.41 7. 251 5.20 200 1.25 84.8 2.75 8. 577 15.0 200 1.49 177.9 4.51 9. 280 10.27 200 1.32 169.8 4.31 10. 290 8.77 1000 1.49 75.1 2.53 11. 785 14.9 200 1.49 181.8 4.71 12. 286 6.42 1000 1.12 83.9 2.32 13. 252 5.52 202 1.49 87.9 2.81 14. 660 14.9 200 1.22 180.4 4.83 15. 296 7.19 1000 1.49 61.4 2.42 16. 538 15.00 200 1.39 176.3 3.21 17. 714 15.00 200 1.49 181.2 4.86 18. 278 7.02 999 1.30 59.6 2.43 19. 648 15.00 200 1.49 180.1 4.72 20. 278 12.40 200 1.25 146.2 3.82 21. 276 11.90 200 1.24 142.9 3.86 22. 288 7.72 1000 1.49 66.2 2.54 23. 440 15.00 200 1.30 171.0 4.52 24. 762 14.9 200 1.50 181.3 4.83 25. 251 13.6 200 1.33 149.6 3.93 26. 277 7.56 200 1.49 110.6 3.21
Figure 5: Optimal chart obtained through NSGA- II for WC-40Co composite
VI.
CONCLUSIONThe EDM process parameters of WC-40Co composites have been optimized by using Non dominated Sorting Genetic Algorithm (NSGA-II), and a non dominated solution set is obtained the second order polynomial models developed for metal removal rate and surface roughness have been used for this research. The optimized solutions WC-40Co composition is 180.33mg/min and 9.46µm. which is compared with the NSGA-II optimized results (181.5mg/min and 4.71µm) shows the same MRR is obtained with 50% less roughness values.
VII.
REFERENCES[1]
Chen Y, Mahdavian SM (1999) Parametric study into erosionwear in a computer numerical controlled electro-dischargemachining process. J Wear 236:350–354[2]
Kuriakose S, Shunmugam MS (2005) Multi objective optimizationof wire electro discharge machining process by nondominated sorting genetic algorithm. J Mater Process Technol170:133–141
[3]
Deb K, Pratap A, Agarwal S, Meyarivan T (2002) A fast elitistmulti-objective genetic algorithm: NSGA-II. IEEE T EvolutComput 6(2):182–197symposium on intelligent and evolutionarysystems, Cairns, Australia, pp 150–161
[5]
Srinivas N, Deb K (1994) Multiobjective optimization usingnondominated sorting in genetic algorithms. EvolComput 2(3):221–248[6]
Deb K, Sundar J, Rao N UB, Chaudhuri S (2006) Reference pointbased multi objective optimization using evolutionary algorithms.Int J Comp Intell Res 2(3):273–286[7]
lgnizio JP (1976) Goal programming and its extensions. LexingtonBooks, Lexington, MA, USA[8]
Kanagarajan D, Karthikeyan R, Palanikumar K, Paulo DavimJ(2009) Application of goal programming technique for electrodischarge machining characteristics of cemented carbide (WC/Co). Int J Mater Product Technol,Vol. 35, Nos. ½.[9]
Eng.M, Bo Fu, CmsSichuan, "Piezo electric actuator design via multi objective optimization methods”, PhD thesis, VR China, pp39-41.[10]
Aravind seshadri, “A fast elitist multi objectivegenetic algorithm NSGA-II”-
,http://www.mathworks.com, Internet specification.
[11]
Raghuwanshi.M.M, Kakde.O.G,(2004) “Survey onmulti objective evolutionary and real coded genetic algorithms”, Proceedings of the 8th Asia Pacific Symposium on Intelligent and Evolutionary Systems, pp150-161.
[12]
Kalyanmoy Deb, Agarwal.R.P,(1995) “Simulatedbinary crossover for continuous search space”, Journal of Complex Systems. Vol. 9, pp115-148.
[13]
Nassif N, Kajl S, Sabourin R (2005) Optimization of HVAC control system strategy using two objective genetic algorithms. JHVAC&R Res 11(3):459-48613.[14]
Montgomery DC, Peck EA, Vining GG (2003) Introduction tolinear regression analysis, 3rd edn. Wiley, New York[15]
Sarin.V.K,(1981) Cemented carbide cutting tools, Advances in Powder Technology, Ed, D.Y. Chin, ASM,pp253-287.[16]
Kanagarajan.D, Karthikeyan.R, Palanikumar.K, PauloDavim.J (2008),“Optimization of electrical discharge machining characteristics of WC/Co composites using Non-dominated sorting genetic algorithms (NSGA-II) ”, Journal of Advanced Manufacturing Technology, 36:1124–1132,[17]
Liao.Y.S, Huang.J.T, Chen.Y.H,(2004) “A study toachieve a fine surface finish in wire EDM”, Journal of Material Processing Technology, Vol.149, pp165-171.
![Figure 1: Flow chart of NSGA IIprogramme [12]](https://thumb-us.123doks.com/thumbv2/123dok_us/9055113.1441311/6.595.306.537.56.294/figure-flow-chart-nsga-iiprogramme.webp)