ULTRASOUND IMAGING
In recent years, the field of non-destructive testing has
seen an expansion in the use of synthetic aperture imaging
techniques, from the conventional synthetic aperture focusing
technique (SAFT) and the total focusing method (TFM)
through to the virtual source aperture (VSA) technique. Each
technique shares a common imaging principle, which allows
for improved lateral resolution and signal-to-noise ratio
(SNR) by synthesising a larger aperture and the averaging
effect. However, the computational burden of the advanced
imaging algorithm limits the speed at which such systems
can operate, which is further compounded by the acquisition
of a larger number of raw amplitude data. Previous work
has sought to limit transmission cycles in an effort to achieve
a real-time data acquisition and imaging system, but at the
detriment of image quality.
This paper introduces several improvements to the VSA
technique that allow for real-time imaging at lateral
resolution and SNR levels comparable to and exceeding those
of TFM, which is often referred to as the ‘gold standard’ in
image quality. For this, three improvements are presented:
firstly, by applying an apodisation function on transmit it
is shown that improvements in side-lobe suppression can
be achieved while maintaining a wide main lobe; secondly,
two VSA scanning strategies are introduced, allowing for a
greater averaging effect due to the additional virtual sources;
and finally, a self-adaptive weighting function is applied to
each pixel in the B-scan image based on the principles of
incoherent and coherent summation.
Keywords: ultrasonics, arrays, post processing, data processing, full matrix capture, synthetic aperture focusing technique, synthetic transmit aperture, virtual source, phased array.
1. Introduction
One of the drawbacks in the imaging of the conventional synthetic aperture focusing technique (SAFT)[1] through an array transducer is the low signal-to-noise ratio of the received signals due to the low power output generated by a single transducer element of the array. While increasing the number of collected A-scans allows for the averaging effect to improve the SNR, it is at the detriment of inspection speed, where the transfer of data from the pulser/ receiver and processing of the imaging algorithm increase. One technique that exploits this approach is the total focusing method (TFM)[2], which uses the full matrix data of an array transducer acquired using the full matrix capture (FMC) technique. For an
array of N elements, conventional SAFT collects N number of A-scans, while the full matrix of data collects N2. This increase in data allows for a larger number of A-scans to contribute to pixel intensity, but introduces significant challenges in the real-time acquisition and processing of the data. While some work has been carried out to show that limiting the number of transmission cycles offers a compromise between inspection speed and image quality[3], the principle is still based on a single-element firing sequentially.
A completely separate piece of work developed for medical ultrasound[4] proposes the use of a single virtual source positioned behind the transducer, allowing for a larger, near-spherical wavefront to propagate through the test specimen. This increase in energy provides an improvement in SNR while reducing the number of transmissions to just a single firing. The technique has been further explored for its applicability to non-destructive testing (NDT) and combined with a SAFT-like imaging algorithm, where it is known as the virtual source aperture (VSA) technique[5]. In this work, a comparison of conventional SAFT, VSA and TFM is presented, where the resolution is shown as being comparable to that of TFM. However, the additional data and angular coverage offered by FMC showed TFM as providing better overall image quality. Part of this earlier work suggested that multiple VSA firings could provide greater angular coverage while retaining a low number of transmission cycles, allowing for rapid processing of high-quality imagery.
This paper introduces an extension of the VSA technique, termed multiple virtual source aperture (MVSA), where two scanning strategies are developed. The first is linear-MVSA, where a virtual source is placed behind a sub-aperture of the array, which is then electronically moved along the entire aperture, allowing for a greater number of time-domain signals to be collected. The second approach is to sweep the virtual source along a range of angles (swept-MVSA) over the entire aperture, allowing for a series of virtual sources to be defined, simulating a steered wave in the material. When combining these techniques with appropriate apodisation over the array during transmit, it is shown that rapid, high-quality, fully-focused imagery is possible with low implementation costs.
2. Virtual source aperture imaging
Since the introduction of array transducers in the field of ultrasonic non-destructive testing (NDT), it is now possible to simulate a seemingly infinite number of scanning, sweeping, transmission and reception strategies. The most common implementation is phased array (PA), where the operator has the ability to sweep through a range of angles and focus at various depths in the material, the data acquisition strategy being to transmit on all elements of the array to simulate a focused beam and to sum all collected A-scans into a single data source for render. More recently, FMC has been explored, where an unfocused sequential scan of the array is performed where each individual element acts as a transmitter while all elements in the array act as receivers. Combining a phased array-type transmitting strategy (where all elements transmit in
Multiple virtual source aperture imaging for
non-destructive testing
M Sutcliffe, P Charlton and M Weston Submitted 23.10.13 Accepted 19.12.13
parallel) with a FMC-type receive strategy (where all elements receive data individually) allows for an unfocused spherical wave to be transmitted over the entire aperture, while providing the ability to implement an advanced imaging algorithm on the data collected over the array. This has the advantage of limiting the transmission cycles significantly over those of phased array and FMC, allowing for the rapid acquisition of data while providing sufficient time domain information to generate an image of reasonable quality.
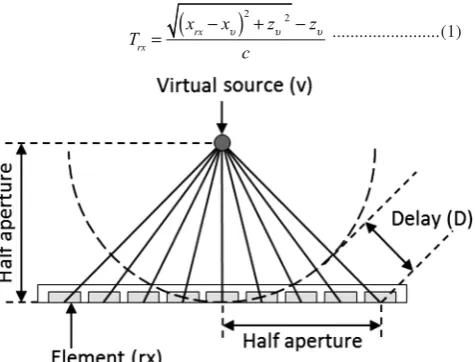
Treating the focus of the transducer as a virtual source for synthetic aperture processing allows for improvements in lateral resolution beyond the natural focus of the transducer[4], a technique first explored by Karman and O’Donnell[6] for use with medical ultrasound. Assuming a geometric relationship allows for the virtual source to be represented as a point at which ultrasonic energy is first emitted. Illustrated in Figure 1, it can be assumed that there is a virtual source of ultrasonic energy positioned behind the transducer. As the aim is to generate a spherical wavefront, it can be determined that the optimal positioning of this virtual source vertically is half the width of the active aperture (assuming a 1D linear array) to allow for the widest possible angular coverage relative to the transducer.
In reality there is no actual point source of ultrasonic energy and it is necessary to simulate this by delaying the transmitting of each element. This delay pattern can be calculated by subtracting the vertical virtual source position from the path lengths to each transducer element. This is shown in Figure 2 and Equation (1), where T is the delay value for transmit element rx at location x and
v is the position of the virtual source:
T rx=
xrx−xυ
(
)
2+zυ2−zυ
c ...(1)
Imaging of the virtual source acquired data is accomplished through a variation of the standard SAFT algorithm, where a region of interest is defined as a grid of pixels. The intensity values of the pixels are then determined by summing the relevant parts of the A-scans in relation to the pixel, probe and virtual source geometry. This algorithm is expressed in Equation (2), where c is the velocity of the medium, N is the number of elements in the array, x, z is a pixel location in the image, xrx is the x position of the receiving element and xv, zv is the position of the virtual source. All measurements are relative to the centre of the transducer and a 1D linear array is assumed. A Hilbert transform (h) has been used to convert the time domain signal into its real and imaginary parts to yield phase information. Time zero is assumed to be directly below the virtual source. Dependent on hardware implementation, a delay compensation may be required to account for the time of the first received signal:
I x
( )
,z = hrx rx=1N
∑
(
xυ−x)
2
+
(
zυ+z)
2
+
(
xrx−x)
2+z2c ⎛
⎝ ⎜ ⎜
⎞
⎠ ⎟ ⎟ ...(2)
As stated, it is desired to produce a spherical wavefront as if an ultrasonic emission from the virtual source had occurred. However, as the virtual source is simply a concept that can be represented geometrically, the physical implementation of the virtual source results in only an approximation to this spherical wavefront; this is shown in Figure 3. This approximation can manifest as imaging artefacts during the render process as peak side lobe levels are increased and defraction arcs from the edge of each element become apparent. While apodisation has been shown to reduce some of these artefacts[4], there is typically a trade-off between optimal resolution and peak side lobe level; this is examined later as part of this work.
Within the literature, TFM is often termed the ‘gold standard’[7,8] in terms of image quality. While the primary motivation for this work is to provide a rapid inspection technique by exploiting a limited number of transmission cycles and maintain an acceptable image quality, to quantify this work it is deemed necessary to provide a comparison of the results against the FMC+TFM technique to measure resolution and SNR.
2.1 Effect of apodisation
In array imaging, the weighting of individual elements is known as apodisation and may occur on either transmit or receive. In the case of transmit, apodisation must be carefully selected as in some cases a lower amplitude signal may be produced, affecting the SNR and overall image quality. The implementation of apodisation within signal processing is achieved through windowing. Within the signal processing literature, several windowing functions are commonly used to broaden the main lobe and lower the side lobes, each with their own characteristics. For this work, three window functions have been studied to determine the optimal apodisation setting for
Figure 1. Ideal wavefront of a virtual source placed behind the transducer
Figure 2. The geometry of a linear array when calculating the delay times for a virtual source positioned behind the transducer
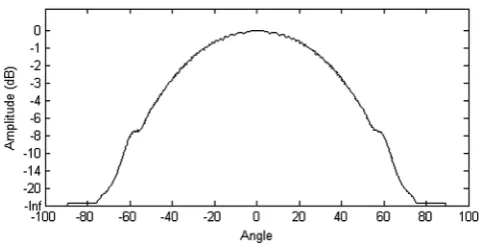
VSA: rectangular, Hamming and Tukey, and have been selected on their individual characteristics. From these characteristics, and given the VSA delay law, it is expected that the rectangular window would produce the beam with a wide main lobe[6] and poor side lobe suppression, while the Hamming window would produce a beam with a narrow main lobe and low side lobes. However, in the case of a virtual source placed behind the transducer, it is preferable to have a wide main lobe with minimal side lobes, and for this the Tukey window provides the best compromise.
The effect of apodisation was tested on a virtual source placed at the centre of the array and positioned at half the aperture height. For this, a Rayleigh-Sommerfeld integral model was developed, allowing for the properties of the physical array to be considered when positioning the virtual source. The model was configured for a 64-element array transducer with a 0.6 mm pitch and 0.51 mm element width. The delay calculations for the VSA were included in the model and a travelling wave assumed. This allows for rapid processing of the model to examine interactions of the beam at any point in time. Further modification to the model allowed for incorporation of the apodisation functions; the results are shown in Figures 4 to 9.
From these Figures it can be observed that the Tukey window provided the best compromise in main lobe width versus side lobe level. With no apodisation applied (rectangular window), the differences in the main lobe and side lobe intensities were measured at approximately 2.5 dB. While both the Hamming and Tukey windows improved side lobe suppression, the optimal apodisation function was determined as the Tukey window, where the peak main lobe and side lobe differences were measured as negligible.
2.2 Multiple virtual source aperture
Figure 10 introduces two scanning VSA strategies. The first (linear-MVSA) is to create a ‘virtual array’ behind the transducer by electronically shifting the virtual source along a sub-aperture of the physical array. This concept was first used in medical ultrasound[9], where it was shown to increase the resolution and SNR of a B-mode imaging system. This work has been expanded here to include apodisation on transmit and to assess its suitability for NDT. A consideration in MVSA is that the number of virtual sources in the array must be less than the physical number of elements of the array in order to keep transmission cycles to below that of FMC and achieve faster frame rates. The second scanning strategy (swept-MVSA) is an original approach that aims to provide greater angular coverage over the image. In swept-MVSA, it is proposed
Figure 4. Modelled beam interaction for rectangular window
Figure 5. Beam profile for rectangular window
Figure 6. Modelled beam interaction for Hamming window
Figure 7. Beam profile for Hamming window
Figure 8. Modelled beam interaction for Tukey window
Figure 9. Beam profile for Tukey window
that several virtual sources are positioned along an arc to generate some degree of directionality to the wavefront. By summing contributions from each virtual source position, improvements in resolution and SNR can be obtained.
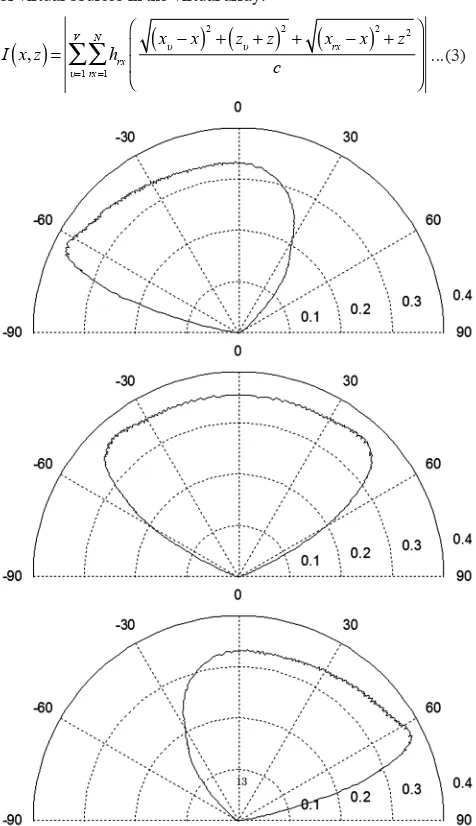
As the aim of the virtual source is to generate a spherical wavefront in relation to the transducer, and given that the virtual source is positioned behind the transducer, the ability to steer this wavefront is not necessarily obvious. In traditional phased array imaging, beam steering is achieved by changing the delay law to allow for a range of angles to be inspected. This data is then summed to produce a sectorial scan. As discussed in Figure 2, the concept of the virtual source is to determine a delay pattern that will generate a spherical wavefront in the material. Therefore, as the virtual source sweeps through the range of angles, the element that transmits first may not be the centre of the physical array, while the true beam centre for the virtual source remains the centre of the array. However, as the delays are calculated, the shape of the wavefront outside the radius of the virtual source allows for a certain degree of directionality to occur. To illustrate this, the Rayleigh-Sommerfeld model was executed, where the virtual source was positioned at –30º, 0º and 30º and polar plots obtained of the beam profile. This is shown in Figure 11, where this steering capability is shown.
For both linear-MVSA and swept-MVSA, assigning each virtual source a geometric position allows for a simple modification to the imaging algorithm discussed to account for the additional virtual sources. This is expressed in Equation (3), where V is the number of virtual sources in the virtual array:
I x
( )
,z = hrx rx=1N
∑
υ=1
V
∑
(
xυ−x)
2
+
(
zυ+z)
2
+
(
xrx−x)
2
+z2
c ⎛ ⎝ ⎜ ⎜ ⎞ ⎠ ⎟ ⎟ ...(3)
2.3 Coherence weighting
Due to beam divergence, in traditional synthetic aperture imaging the lateral resolution degrades with depth. Considering a focal point positioned some distance from the transducer, as the depth from the transducer to the focal point increases, so the ultrasonic beam widens. As the imaging algorithm selects the appropriate sample point from each raw signal in relation to the image focal position, transducer geometry and received signal, sample points that are in-phase provide constructive interference during the image reconstruction process. This corresponds to high spatial coherence across the received synthetic aperture acquired signals, as shown in Figure 12(a). This constructive interference is desirable with the synthetic aperture imaging process. However, in the case that the synthetic focus is steered away from the high intensity sample points produced by an indication, out-of-phase data is selected, producing destructive interference within the image reconstruction algorithm corresponding to low spatial coherence, as shown in Figure 12(b).
Improved SNR is a natural result of the FMC+TFM process, as the signal summation acts as a form of signal averaging. The reduction in the number of acquired signals as part of the VSA data acquisition process limits this natural averaging process, introducing more noise into the image than would be present in the FMC+TFM process. In the field of optics, Liao et al[10] showed that exploiting the spatial coherence of the raw signals allows for an appropriate weighting function to be developed based on the coherence factor (CF)[11]. Considering MVSA for a given pixel, the CF is shown in Equation (4):
CF x
( )
,z =hrx rx=1
N
∑
υ=1 V
∑
(
xυ−x)
2
+
(
zυ+z)
2
+
(
xrx−x)
2+z2 c ⎛ ⎝ ⎜ ⎜ ⎞ ⎠ ⎟ ⎟ 2
VN hrx
xυ−x
(
)
2+
(
zυ+z)
2
+
(
xrx−x)
2+z2 c ⎛ ⎝ ⎜ ⎜ ⎞ ⎠ ⎟ ⎟ 2
rx=1 N
∑
υ=1 V
∑
...(4)
In this Equation, the numerator represents the coherent energy in the synthetic aperture imaging sum and the denominator represents the total energy for the delayed signals in the synthetic aperture imaging sum[10]. From this definition, the CF calculates a weighting value ranging from 0 to 1, where the CF is at its maximum when the signals are in-phase and are identical across the synthetic aperture. The CF value is calculated for every pixel in the image, allowing for appropriate weighting to be applied that reduces with respect to synthetic aperture steering errors. This has a significant advantage over other SAFT weighting functions in that the weighting function is self-adaptive and is determined from the raw data. Incorporating the CF into Equation (3) leads to Equation (5), where Iʹ represents
the new pixel intensity value calculated from the original imaging algorithm multiplied by the CF:
I x′
( )
,z =I x( )
,z CF x( )
,z ...(5)2.4 Ease of inspection
An often overlooked aspect of synthetic aperture imaging is the relative ease of the inspection set-up. In conventional ultrasound,
Figure 11. Ability to steer VSA beam. Top: –30º; middle: 0º; and bottom: 30º
a highly-skilled operator is required to interpret the raw amplitude data and to make calculations as to the approximate size and location of a defect. In the case of phased array technology, the operator has the ability to represent the entire B-scan image, allowing for ease of data interpretation. However, this is at the cost of a complex set-up scenario, where the operater must be trained in the use of phased array to determine the optimal inspection parameters, such as sweep angles, start and end gates, focal position and wedge parameters, which is a cumbersome process for many systems.
On the surface, the synthetic aperture techniques discussed in this work can appear complex, as the imaging algorithm has to perform many thousands of calculations in order to render just a single B-scan image. In reality, however, much of this complexity is unseen by the operator, resulting in a simplified inspection process and allowing for de-skilling of the process. Considering a standard contact mode system using VSA, FMC or SAFT, it is only necessary to provide basic transducer information (pitch and number of elements), a region of interest to inspect relative to the transducer and the velocity of the material being inspected. From this, there is sufficient information for the algorithm to process the request (including the calculation of start and end gates). When including a wedge, only two further pieces of information are required: wedge depth and angle, although it is possible for some systems to ultrasonically determine the wedge parameters[12].
2.5 MVSA imaging system
A custom MVSA imaging system was developed, allowing for execution of the FMC+TFM, VSA and MVSA imaging algorithms on both the CPU and GPU, allowing for the acceleration of code over the GPGPU architecture. All algorithms were implemented in the time domain and connected to a data acquisition system capable of acquiring data at a rate of 38 Mb/s. Data was acquired with an 8-bit amplitude resolution and presented with 48 dB dynamic range. Processing was undertaken on a Windows 7 desktop-based PC containing two Quadcore 3 GHz CPUs and a Nvidia Tesla C2075 graphics card equipped with 448 CUDA cores and 6048 MB of GDDR5 memory. For this work, an Olympus 5L64-A2 transducer, containing a 64-element linear array with a 5 MHz central frequency, was used, with data sampled at a rate of 25 MHz.
An aluminium test-block with a longitudinal velocity of 6300 m/s and multiple side-drilled holes (SDH) was used and a region of interest selected –20 mm to +20 mm horizontally and at 20 mm to 60 mm depth. The region of interest was divided into pixels representing 0.125 of a mm, with the overall image pixel dimensions measured as 320 × 320 pixels.
2.5.1 Measuring performance
In this paper, the VSA technique has been developed as a data acquisition and imaging system, with improved resolution and SNR than in previous work[5]. The ability of FMC+TFM to fully exploit the focusing capabilities of an array transducer allows for increased resolution compared to traditional B-scanning implementations, and the averaging effect is shown to provide a significant improvement in SNR. For this work, FMC+TFM results are compared to the adapted VSA algorithms to measure image quality.
It is useful, therefore, to quantitatively measure speed and image performance in terms of its ability to detect and image a point-like reflector. For each inspection scenario it is necessary to acquire, process and image the raw data. The speed at which this occurs was measured in Hz, representative of the frame rate of the system (the number of B-scans that can be generated in 1 s), and was determined by logging the duration of each activity within the software. An estimation of SNR was calculated from the reconstructed image based on the root-mean-squared (RMS) approach, where SNR is measured from the RMS of the entire image against its peak response. This is preferable over measuring
the SNR against the raw A-scans, as pixel intensity is determined from contributions from all A-scans and provides a better measure of overall image quality. The array performance indicator (API)[2] allows for a dimensionless measure of the spatial size of a point-like reflector and was developed as a method to compare TFM against other B-scan imaging techniques. API is calculated by obtaining an area measurement within a –6 dB drop from an indication and is normalised using λ2.
To assess the MVSA imaging capabilities, speed (measured in Hz), SNR and API were used as key performance indicators. In the case of SNR and API, a measurement was first obtained from the FMC+TFM image to provide a reference signal. All subsequent measurements were then adjusted to these reference values to provide a measure in a dB scale indicating the difference in performance. In the case of SNR, a high dB value is desirable, while for the API a lower score is preferred.
3. Results and discussion
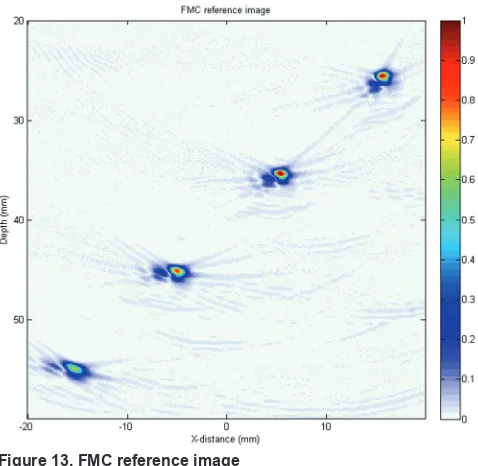
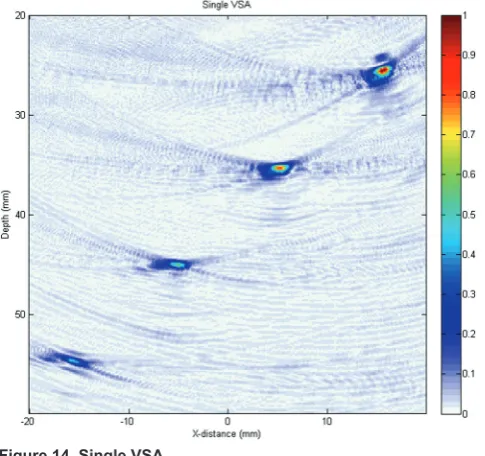
Figures 13 to 19 show the results from the experimental MVSA imaging system. For reference, Figure 13 (FMC+TFM) is included here as a comparison to each other technique discussed and developed in this paper. In each case, the experimental system was able to clearly image the SDHs of the test specimen. FMC+TFM (Figure 13) provided a high-quality image reconstruction of the artificial flaws from which the SNR, API and frame rates were obtained as a benchmark for all other techniques. Quantitative measurements for all techniques are given in Table 1.
From these experimental results it can be observed that a single VSA transmission with no coherence factor applied (Figure 14) gave the worst performance in terms of SNR and API, but provided the fastest method of data acquisition and processing. This was to be expected, as the number of collected raw A-scans (64) was significantly lower than that with FMC (4096), allowing for rapid data processing, but with a lower contribution to pixel intensity summation during the image reconstruction phase. However, all SDHs were clearly identified and image quality was measured to within 3 dB of that of the reference image. Increasing the number of virtual sources allowed for a greater contribution to pixel intensity values, thus improving image quality significantly over that of a single VSA firing, as can be seen in Figures 16 and 18, where performance was measured to within just 1 dB of the reference image. More importantly, the use of swept-MVSA allowed for greater angular coverage over linear-MVSA, improving the SNR.
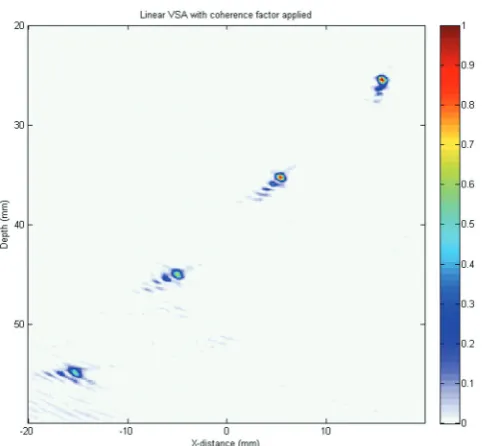
Figures 15, 17 and 19 show each VSA technique discussed with the addition of a coherence weighting factor. This self-adapting algorithm significantly improved image quality, as can be seen in Table 1, where an average improvement of 4 dB was observed against the reference image. In all cases, SNR was increased to levels above the FMC+TFM reference image, where even a single VSA firing provided a high-quality image reconstruction with an increased API score. It should be noted that further work is required to assess the suitability of coherence factor weighting when imaging non-point-like reflectors. It has been included here to show how digital signal processing can allow for vast improvements in synthetic aperture imaging.
In all cases, the use of VSA and MVSA performed much faster than FMC+TFM, which was to be expected as the underlying algorithm has less data to process. By incorporating the coherence weighting factor within the virtual source image reconstruction algorithm, no additional overhead was incurred. In this work, each image generated measured 320 × 320 pixels, which for the reference image and using standard CPU processing took approximately 50 s to acquire the data, process and render, making the technique impractical for real-time inspection. While some improvement was seen when executing code over the GPU, the VSA/MVSA technique provided the best performance when considering speed, with acceptable results obtained from each of the methods.
Table 1. Performance measurements for each inspection technique: FMC+TFM – standard FMC+TFM algorithm; VSA – a single virtual source; VSA+CF – a single virtual source with coherence factor applied; SMVSA – a swept VSA from –30º to +30º at 10º increments; SMVSA+CF – a swept VSA from –30º to +30º at 10º increments with coherence factor applied; LMVSA – a linear scanned VSA using a sub-aperture of 16 elements and an increment of 8 elements; and finally LMVSA+CF – a linear scanned VSA using a sub-aperture of 16 elements and an increment of 8 elements with coherence factor applied
Time
CPU TimeGPU SNRdB APIdB
FMC+TFM 0.02 Hz 0.08 Hz 0 dB 0 dB
VSA 8.31 Hz 16.01 Hz –1 dB 2 dB
VSA+CF 8.31 Hz 16.01 Hz 4 dB –4 dB
SMVSA 0.46 Hz 9.39 Hz 1 dB 1 dB
SMVSA+CF 0.46 Hz 9.39 Hz 4 dB –4 dB
LMVSA 0.31 Hz 12.49 Hz –1 dB 1 dB LMVSA+CF 0.31 Hz 12.49 Hz 4 dB –5 dB
Figure 14. Single VSA Figure 15. Single VSA with coherence factor applied
Figure 16. Swept-MVSA –30º to +30º at 10º increments
4. Conclusion
This work introduced several improvements to the standard VSA technique, where apodisation during transmit was explored as a method of maintaining a wide main lobe, and two scanning strategies were developed utilising multiple virtual sources. To quantitatively measure performance, FMC+TFM was used as a gold reference standard and statistics gathered in terms of speed, SNR and API, where it was shown that VSA/MVSA provided images of comparable quality to that of FMC+TFM, without the determinant in speed commonly associated with FMC. The use of a ‘coherence factor’ was explored as part of this work, where it was acknowledged that further work is needed to assess its suitability in the detection of a non-point-like reflector. For this reason, comparisons were provided with and without ‘coherence factor’ weighting, where the VSA/MVSA technique was shown to perform well against the reference image, while maintaining a rapid data acquisition and processing strategy. This illustrated the use of VSA/MVSA as a viable inspection method with high image reconstruction and real-time processing.
Acknowledgements
This work was completed in partnership with TWI Technology Centre (Wales), Swansea Metropolitan University, the University of Wales and the Prince of Wales Innovation Scholarship Scheme (POWIS).
References
1. J A Jensen, S I Nikolov, K L Gammelmark and M H Pedersen, ‘Synthetic aperture ultrasound imaging’, Ultrasonics, 44, Suppl 1, pp e5-e15, 2006.
2. C Holmes, B Drinkwater and P Wilcox, ‘Post-processing of the full matrix of ultrasonic transmit-receive array data for non-destructive evaluation’, NDT&E International, 38 (8), pp 701-711, 2005.
3. L Moreau, B Drinkwater and P Wilcox, ‘Ultrasonic imaging algorithms with limited transmission cycles for rapid non-destructive evaluation’, IEEE Transactions on Ultrasonics, Ferroelectrics and Frequency Control, 56, pp 1932-1944, 2009. 4. C H Frazier and W R O’Brien, ‘Synthetic aperture techniques
with a virtual source element’, IEEE Transactions on Ultrasonics, Ferroelectrics and Frequency Control, 45 (1), pp 196-207, 1998.
5. M Sutcliffe, M Weston, P Charlton, B Dutton and K Donne, ‘Virtual source aperture imaging for non-destructive testing’, Insight, Vol 54, No 7, pp 371-379, 2012.
6. M Karaman and M O’Donnell, ‘Synthetic aperture imaging for small-scale systems’, IEEE Transactions on Ultrasonics, Ferroelectrics and Frequency Control, 42 (3), pp 429-442, 1995.
7. C Holmes, B W Drinkwater and P D Wilcox, ‘Advanced post-processing for scanned ultrasonic arrays: application to defect detection and classification in non-destructive evaluation’, Ultrasonics, 48 (6-7), pp 636-642, 2008. doi:10.1016/j. ultras.2008.07.019
8. O Oralkan, J A Johnson, K Kaviani, T H Lee and B T Khuri-Yakub, ‘Capacitive micro-machined ultrasonic transducers: next-generation arrays for acoustic imaging?’, IEEE Transactions on Ultrasonics, Ferroelectrics and Frequency Control, 49, 2002.
9. M Bae and M Jeong, ‘A study of synthetic-aperture imaging with virtual source elements in B-mode ultrasound imaging systems’, IEEE Transactions on Ultrasonics, Ferroelectrics and Frequency Control, 47, pp 1510-1518, 2000.
10. C Liao, M Li and P Li, ‘Optoacoustic imaging with synthetic aperture focusing and coherence weighting’, Optics Letters, 29 (21), pp 2506-2508, 2004.
11. Z Zhang and T Buma, ‘Adaptive terahertz imaging using a virtual transceiver and coherence weighting’, Optics Express, 17 (20), pp 17812-17817, 2009.
12. M Weston, P Mudge, C Davis and A Peyton, ‘Time-efficient auto-focusing algorithms for ultrasonic inspection of dual-layered media using full matrix capture’, NDT&E International, 47, pp 43-50, 2012.