Licensed under Creative Common Page 1
http://ijecm.co.uk/
ISSN 2348 0386
PUBLIC SPENDING ON HEALTH, REDUCTION OF POVERTY
AND MILLENNIUM DEVELOPMENT GOALS ACHIEVEMENT
IN NIGERIA: A COMPUTABLE GENERAL EQUILIBRIUM
MICRO SIMULATION (CGE-MS) APPROACH
Ernest Simeon O. Odior
Department of Economics, Faculty of Social Sciences, University of Lagos, Lagos, Nigeria [email protected]; [email protected]
Abstract
This study examines the effect of public spending policy on the basic health services in the
reduction of poverty and in achievement of millennium development goals in Nigeria. The main
aim of this study is to explore how public spending on basic health services can help to attain
the United Nations, Millennium Development Goals (MDG) in terms of improving health services
and in reducing poverty in Nigeria. The study employs a dynamic CGE-MS method in analysing
the likely effects of an increased in public spending or expenditure on health in Nigeria. It was
found that it will be very hard for Nigeria to attain the Millennium Development Goals target, in
terms of health and reduction of poverty by the year 2015, because the policy measure in our
analysis was unable to meet this goal. However, the simulated analysis shows that if
government resources are redirected to public health systems, this will go a long way is in
determining the reduction of poverty in Nigeria. The study suggested that, for Nigeria
government to attain the MDG in terms of health service and in reduction of poverty, public
expenditure on health should be considered as an important issue in the public investment
portfolio.
Licensed under Creative Common Page 2 INTRODUCTION
For the past two decades the world has continue in unfolding programmes on human development. Health services seem to be a real issue to human development attainment and this problem largely affect a group of developing countries particular in the sub-Saharan Africa. The Millennium Development Goals (MDGs) in health (goal four to six in the MDGs objectives) aim towards the reduction between 1990 and 2015, child mortality would have reduced by two thirds, and there would have adequate improvement in maternal health and other diseases like the HIV/AIDS, malaria etc,(UN-MDG, 2008) .Bad healthcare and neglect of basic health services can all be influential in causing and sustaining the extraordinary level of under nutrition in the developing countries.
An improvement in health is essential if a nation wants to reduction poverty. Conventionally, many measured health using the infant mortality rate and life expectancy at birth. But the state of being diseased or unhealthy within a population (morbidity) is not reflected in this conventional health measured. Therefore, in measurement of health status, the World Health Organisation proposed that health status should be measured in line with disability adjusted life expectancy. In terms of health measurements life expectancy is seen as a good indicator though a lagging indicator because, the data on morbidity is still very poor, the advantage is that it captures all causes of untimely death (Roberts, 2003; Gupta, 2003).
In the past two decades, as a result of the sudden increase in the world price of oil, Nigeria has substantially raised the public spending on her primary health care. Simply re-allocating a larger of the public resources to basic health service, due to the windfall in the oil sector is not enough to ensure that the vast majority of poor citizens in Nigeria enjoy quality health services. To ensure adequate health service delivery to the citizenry in country, the effect of government expenditure on basic health care depends largely on the public sector incentive and the existing institutions.
Licensed under Creative Common Page 3 The study is divided into eight sections; following this introduction is section two which focus on brief review of health relevant literature. Section 3 presents the model policy experiments description and specification. Section 4 captures the database of model while, section 5discusses the model simulation experiment, result analysis and interpretation. Findings and policy implication is captured in section 6, while section7 and 8presents the study conclusions and limitations of the study.
REVIEW OF RELEVANT LITERATURE
It is widely believed that the primary objective of a country to her citizens in terms of health services delivery is to offer a safety-net for the poor in health services delivery and equally regulate and ensure good health care systems and provide good health insurance. Many poor households are prone to serious impoverishment and even if victims are catastrophic or serious illness/injury and these poor households are without a safety net. For this fact, public spending on health should be primarily and firstly directed to interventions with public goods characteristics. The strong positive externalities should be biased towards the poor (Roberts, 2003).
According to Gupta et al (2003), health services depends on some variety of variables or factors and some of these factors includes; environmental, cultural, social, economic, geographical, as well as interventions in the sector. In most econometric analysis, the evidences had shown that most per capita income and public spending has limited power to explain the cross-country variance in services. In most countries, especially the in developing countries, public spending has often been mis-allocated and mis-directed and this has been inter alia by substituting for private spending. Primary health care facilities have no clear benefit to improve human health. Nevertheless, some public health programmes have been successfully demonstrated, for e.g. immunization programmes, but the effectiveness of these programmes depends on the health budgets so as to have influenced greatly on the aggregate picture of health services delivery.
Licensed under Creative Common Page 4 and quality of the bureaucracy. Some recent empirical evidence supported the fact that the overall good governance environment play an important role in the effective use of the resources allocated to the health sector. This implies that a good governance environment offers a significant explanation for the observed relationship (strong or weak) between service delivery and public spending.
These above issues are important for basic health delivery in Nigeria. The paramount issue in the Nigeria health sector started in the 1980s. Following the fiscal crisis and decline in the country’s oil revenues in the 1980s, tightening financial constraints were imposed upon public spending on the priority sectors of the economy including the health sector. The implication of this was that the allocation of resources to the priority sectors which included the health sector was neglected. Another issue that is paramount in the Nigerian health sector is the issue of high level of corruption and bad bureaucracy in the health sector, these factors has often hinder the effectiveness in service delivery in the sector (Odior, 2011).
The 1990 World Development report’s two-part strategy has become an almost undisputed paradigm in development discussions. In this report it is been argued that to achieved apolitically and rapid sustainable progress on poverty, two strategies that have equal important elements must be involved. The first element is to make use of labour which is the poor most abundant asset. The second element is to give the poor the basic social services these includes; good nutrition, good primary education primary, basic health care and family planning (see World Bank, 1990). The East Asian experience has probably contributed most to the consensus that health care and education are essential the growth of the economic and for the reduction of poverty and both variables are essential to prepare the populations, especially poor countries for international economic integration.
This "instrumental" vision of human capital formation is not shared in all analyses. Perhaps most explicitly in the UNDP’s Human Development Report, improving education and health are seen as goals in themselves, not just means to achieving something else. Much has been written on the social dimension of adjustment, including the idea that social spending was cut during stabilization and adjustment programmes. The decline in such spending has been well documented. For example, Fortson (2006) notes that it declined by 26% for a sample of African countries in recent years. The negative effects have been well described, e.g., by Strauss and Thomas (1998) who analyse the negative effect of declining health services and increasing food prices on child (and adult)health in Côte d'Ivoire during the 1980s.
Licensed under Creative Common Page 5 improve education and health, in other words, most subsidies on education and health are actually programed towards the poor. For example, empirical evidence now exists at least for developing countries like Malawi, Côted’Ivoire, Kenya, Ghana, Uganda, Nigeria etc.
Also, in recent studies in most developing countries, it was often stated that their allocation of public expenditure for human capital development is often considered inequitable and inefficient because, the general notion is that expansion in the human knowledge is significant for the growth of any economy and also for the reduction of poverty. That is, creating human capital involves education with formal education systems and good healthcare systems. Developing world often cited low education attainments along with the rates of returns to schooling at a high estimate as the reason for government continue spending to achieve better and more quality schools. Current studies have shown that particularly in Sub-Saharan Africa, school enrollments is low and poor and combine with the growing level of child labour which is often done at the expense of inadequate health, good education and good nutrition, despite government spend much on human capital development programmes (education and health) in those countries.
POLICY EXPERIMENTS DESCRIPTION AND SPECIFICATION OF MODELS
Policy Experiments Description
In this study, the computable general equilibrium-micro simulation (CGE-MS) model is used to simulate the effect of alternative/other health policies on the long-run growth of health and on poverty in Nigeria. The starting point in the simulating experiment is the dynamic base growth path which provides the base against which the other scenarios (experiment) (a period 2004 to 2015) are compared. That is before any other counterfactual dynamic simulation is carried out. This benchmark simulation is based on assumptions on the public expenditure on health sector annual percentage growth rate. The period 2004-2015 is the base run for the analysis. The assumption in the model is that all the explanatory variables assumed a constant growth rates throughout the simulation experiments. On this study, the information is summarized in a set of indicators. These include; data on level of poverty, disaggregated household welfare, macroeconomic growth and data on the structure of trade and production.
Licensed under Creative Common Page 6 see if the intervention will produce more positive or moderate effect on health sector in terms of meeting the MDG on health and in term of reduction of poverty in Nigeria.
Model Specifications
Household Consumption Demand:
Linear expenditure system (LES) gives the household consumer demand. LES is derived from the maximization of Stone-Geary utility function that is subject to a spending constraint(Lofgren et al, 2002). The model takes relevant prices such as prices of intermediate inputs prices, factors prices and outputs prices as given while, the model markets are assumed to be competitive. The bulk of household incomes come from factors. They also receive dividends, government transfers and remittances. Direct taxes, savings and consumption are the important items on the household expenditure side. This study model includes 13,574 households from the household survey. It is assumed that the households’ tax income is pay directly to the government authority and their savings are fixed proportion of the household total disposable income (income after tax). We also assumed that household demand is derived from a C-D utility function.
Household Consumption Expenditure
1
.(1
).(1
).
h i h h h h
i INSDNG
EH
shii
MPS
TINS
YI
,h
H
(1)wherehH(INSDNG)is defined as a set of household,
EH
his defined as the household consumption expenditure, whileshii
i his defined as the share of net income andTINS
his defined as the direct tax rate for institution i.Equation(1) defined the total value of consumption expenditure as the remaining income after household direct taxes by institution, household savings and transfers to other non-government domestic institution.
LES Consumption Demand by Household for Commodity
Spending byHousehold on Marketed Commodities
' ' ' '
' '
.
.
.
.
.
m m m h
c ch c c h c h h c c h ac a c h c C a A c C
PQ QH
PQ
EH
PQ
PXAC
Licensed under Creative Common Page 7 Household Consumption Spending on Home Commodities
' ' ' '
' '
.
.
h h.
.
m.
hac ach ac a ch a ch h c c h ac a c h c C a A c C
PXAC QHA
PXAC
EH
PQ
PXAC
(3)where; ch
QH is defined as the consumption quantity of marketed commodity c for household h
m c h
is defined as the consumption subsistence of marketed commodity c for householdh, h a c h
is defined as the consumption subsistence of home commodity c from activity a forhousehold h, and m
c h
is defined as the consumption marginal share of spending on marketed commodity c forhousehold h.
This study assumed that households’ maximized the Stone Geary utility function and this is subject to the consumption spending constraint. Consumption (consumer demand) is split across different commodities. Equations (2 and 3) also define a one-period static. The resulting first order condition, equations (2 and 3) are known as linear expenditure system(LES) function. Equations (2 and 3) are LES, since individual spending on commodities is a linear function of total consumption expenditure. Household consumption expenditure(EH) is modeled using a LES expenditure function.
Government
Government in every country receives their income basically from direct taxes and indirect taxes. These taxes incomes earned by government are spent on investment, consumption, transfers, debt services that are interest payment on both domestic debt and foreign debt. The real demand of government which is investment and consumption are determined exogenously and disaggregated. Government demand function is represented as;
The demand of Government Consumption
.
c c
QG
GADJ qg
,c
C
(4)In equation (4) the consumption demand by government for commodity is defines as
QG
c, while the government consumption adjustment factor (the exogenous variable) is defines asGADJ
isLicensed under Creative Common Page 8
Revenue of the Government
This variable (government revenue) is exogenous or independent in the model. It is made up of the receipt from taxes (direct taxes, indirect taxes, import tariffs) and other sources of revenue. The equation for government revenue (YG) is given below:
. . . .
a
i i f f a a a a a c c c
i INSDNG f F a A a A c CM
YG TINS YI tf YF tva PVA QVA ta PA QA tm pwm QM EXR
. .
. . . .
c c c c c c gov f gov row
c CE c C f F
te pwe QE EXR tq PQ QQ YIF trnsfr EXR
(5)
Note: The totality of government receipts is the sum of the receipts from direct and indirect taxes, transfers receipt from outside that country and factor income
Government Expenditure(EG)
EG = government total expense is the sum of the expenditure on the goods in the economy and transfers to households.
.
.
c c igov
c C i INSDNG
EG
PQ QG
transfr
CPI
(6)
THE DATA-BASE OF THE MODEL
In building a database for simulation and calibration, the study makes use of 2004 data of the structural characteristics of the Nigerian economy. Data were extracted for labour force, population, poverty, government demand, savings, and different elasticities parameters for macroeconomic variables. The extracted data were used to build the social accounting matrix (SAM) that was used in the calibration. The extracted data were derived from the 2004 National Accounts of Nigeria (NBS,2005; 2006), CBN Statistical Bulletin (2004) and CBN Annual Report and Statement of Accounts (2004; 2005).
The Description of Macro and Micro Sam
This Macro SAM consists of eight blocks. The SAM includes disparate data which includes, data for production activities and commodities activities, data for factors income, household data, taxes, savings, government income data and data for activities from the rest and to the rest of the world (ROW) (Lofgren et al., 2003).
Licensed under Creative Common Page 9 mineral products and manufacturing (two industrial activities), utilities & construction, wholesale & retail trade, hotel & restaurant, transportation, communication, administration, other services (seven services activities). The Micro SAM has eight institutions and related accounts these include; rural income, urban lower-income, urban upper-income (the Micro SAM specifies three households categories) other institutions and related accounts which includes; government, rest of the world, saving-investment, indirect taxes, direct taxes. The Micro SAM included four factors of production, these are divided into agricultural and non-agricultural labour and agricultural and non-agricultural capital.
Poverty Data
The experiment on poverty indicators were calculated in a separate poverty module using the representative household (RH) method. In the model a lognormal frequency function is used to specified the within group household distribution function. A poverty line of 791.10 Naira was used in this study. The line was based on two thirds of the average per-capita expenditure (PCE) or 23,733 Naira this yielded estimates of 54.41percent43.19percent and 63.27percent for national, urban and rural poverty incidence (P0) in the 2005 data set in the national bureau statistic, of the Nigeria poverty profile for in the respectively. This poverty line is required to provide the minimum 2,900 calories per person per day. All persons with PCE less than this amount are considered poor. Those equal to or above are non-poor. A core poor (or extreme poverty) are defined as one-third of the average PCE of 11,867 Naira. All persons with PCEs between 11,867 and 23,733 Naira are considered moderately poor (see NBS, 2005)). In model calibration the study used a log-standard error of 0.35 for all the representative-households both in the urban and the rural areas (Lofgren et al.,2003). In the measures of poverty, the module covers the three proposed class of measures of poverty by Foster et al. (1984), these include: the head-count ratio, the poverty gap ratio (P0, P1 respectively) and poverty severity (P2).
MODEL SIMULATION & ANALYSIS
Licensed under Creative Common Page 10 In simulation, it is assumed that government demand in the base path grows at the same constant annual rate of6.92 percent per year, a rate that is calibrated to maintain the base-year, across all government functional areas such as administration, economic, social and community services and transfers payments. Administration is subdivided into general administration, national assembly, defence and internal security; economic service is subdivided into agriculture, construction, transport and communication and others; social and community service is subdivided into, education, health and others, while transfer is subdivided into public debt charges (internal and external), external obligation, pension and gratuities, deferred custom duties, contingencies and subventions and others/ CFR charges ( CBN, 2004) (see Table 1).
The computed based simulation assumption show that, most real macroeconomic variables aggregates grow between the annual rates of 6.09 percent and 8.70 percent this is including production sectors and the household consumption, except for the mineral production sectors (see Table 1). The Table 1 also specified the endogenous annual growth rate of TFP which is given as greater than zero (0.17). A population growth rate of 2.83 percent is computed for Nigeria, given this high level of the growth rate of population, the economy recorded a very low per-capita income. However, the head-count poverty rate (P0) in 2004 gave 54.41 percent, while the head-count poverty rate (P0) was 65.60 percent in 1996;the calculated in the base simulation assumptions table gave a decrease and a point deviation of -11.19 percent
Table 1: Assumptions of Base Simulation
Macroeconomic Base Simulation Assumption Base year, 2004
Welfare indicators Base Simulation Assumptions
Activities Naira (Billions)
Annual growth rates of the base year (%)
Per capita of Household consumption
Billion of Naira
Base Annual growth rates (%)
Total GDP (at factor cost) 8261.44 6.09 Rural income 1106.89 1.88
Absorption 8320.10 4.72
Urban lower
income 494.01 2.21
Household consumption 7196.43 6.30
Urban higher
income 1152.66 3.00
Government demand 1123.67 6.92
Average, all
households 292.97 0.72
Investment 631.15 6.36 Rural 103.92 4.74
Licensed under Creative Common Page 11
Exports 4358.23 7.51
% point deviations from base year (2004) values
Imports 4150.17 8.69
Poverty headcount (P0)
Agriculture 2578.96 6.50 National 54.41 -11.19
Mineral products 2842.84 3.43 Rural 63.27 -5.93
Manufacturing industry 372.06 10.07 Urban 43.19 -15.01
Government services 471.66 10.85 Elasticity -1.08
Other services 1999.43 8.20
Poverty gap (P1)
Real exchange rate 100.00 -0.42 National 21.80 -14.00
Agric and non-agric trade terms 100.00 -0.33 Rural 25.82 -10.08
Population 129.18 2.83 Urban 16.70 -18.90
Depreciation of Capital 47.40 10.05 Elasticity -2.48
Index of TFP 100.00 0.17
Poverty
severity (P2)
Total factor income 8262.08 6.15 National 11.91 -8.79
Agric-Labour 56.23 4.20 Rural 14.06 -6.64
Non-AgricLabour 122.14 3.81 Urban 9.18 -11.42
Agriculture Capital 2619.79 2.63 Elasticity -5.07
Non-Agriculture Capital 5439.91 1.77
Base year % share of Government Expenditure in Total GDP
Base year Ratios to GDP(%)
% point deviations from
base year values Priority Sectors
Billion of Naira
Base Annual Share of Govt. Expenditure in Total GDP (%)
Investment 7.64 2.43 Agriculture 49.95 0.60
Government expenditure (spending) 16.66 -0.99 Transport 15.05 0.18
Saving 15.87 1.80 Education 85.58. 1.04
Government saving 8.24 -0.63 Health 52.42 0.63
National poverty headcount (P0) 54.41 -11.19 Defence 85.05 1.10 Sources: Computations of the Author and Aigbokhan, 2000.
Note: Poverty percentage point deviations are based on the base year (2004) and 1996 poverty figures (FOS, 1999)
Licensed under Creative Common Page 12 and parameters on the issues of health, that makes their human capital more productive, as we have seen in a cross-section of many developing and developed countries. For this fact, the uses of these data are not only particular to Nigeria, therefore this basic reason, the justification for using the elasticities data of growth on government expenditure obtained from other studies is obvious.
The model assumptions for the base simulations were presented in Table 1 while, Tables 2 & 3 below respectively shows the linkage elasticity parameters of total factors productivity and non-base simulations assumptions used in calibration in this study. These elasticities in the productivity functions have been scaled on the basis of the share of base-year economy represented by the activities or factors to which the productivity effect is directed.
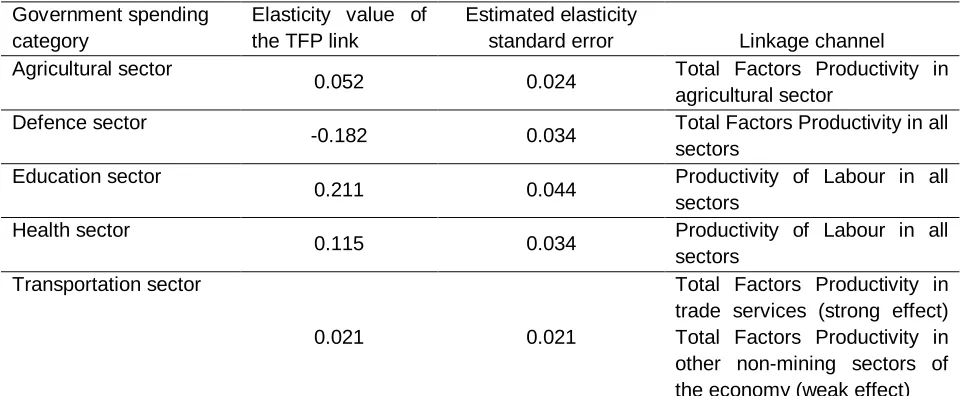
Table 2: Linkage Elasticity Parameters of Total Factors Productivity Government spending
category
Elasticity value of the TFP link
Estimated elasticity
standard error Linkage channel Agricultural sector
0.052 0.024 Total Factors Productivity in agricultural sector
Defence sector
-0.182 0.034 Total Factors Productivity in all sectors
Education sector
0.211 0.044 Productivity of Labour in all sectors
Health sector
0.115 0.034 Productivity of Labour in all sectors
Transportation sector
0.021 0.021
Total Factors Productivity in trade services (strong effect) Total Factors Productivity in other non-mining sectors of the economy (weak effect) Note: Estimates (t statistics) elasticity value of the TFP link and their standard error are based on Odior
(2011) Fan &Rao (2004)
Analysis and Interpretation of Simulation Results: Welfare and Poverty Effects
The results of simulation experiments are present in Tables 4. The base year 2004, computation shows that there is size similarity between public spending on agricultural services and public
Table 3: Non-Base Simulation Assumptions Name of Simulation Description of Experiment
SIMHEAL Re-allocation of public expenditure from “others” to health services
Licensed under Creative Common Page 13 spending on health services (see Table 1). In the simulating experiment, public expenditure in 2005 is redirected to health, this raise the percentage share of the gross domestic product in the initial (base year) spending on health from 0.63 percent in 2004 to 1.99 percent in 2005, while holding the real growth of total demand of government constant. In this case it is expected that demand of government in all the areas where government function will grow at the same annual rate of 6.92 percent. This implies that 10 percent (or 1.36 percent of the gross domestic product) of the overall government expenses is channeled towards health classified as more productive area from the less productive area classified as “other’.
The non-base simulation assumptions consider the effect of reallocating government demand into health on poverty. These simulations involve re-allocating government demand into health sector, for better health services to the citizens. This is public intervention. This intervention is to show whether there is an improvement in terms of poverty reduction. The simulated result shows that when a higher elasticity was given in form of intervention, the intervention has a less significant (but moderate) effect on overall performance of the economy and also on poverty reduction. This result confirmed that public expenditure on health care service is significant to determine poverty reduction.
Regarding the impacts on household welfare and poverty, the reallocation of government spending to health marginally increases the per-capita consumption growth rate of urban and rural sectors comparing the results with the base scenario (see SIMHEAL1 Table 4). We observed an overall increase in the rural, urban lower and the urban higher incomes annual growth rate of 0.43percent 0.67 percent and 0.28percent, these represent an increase of 22.87percent 30.31percent and 39.33percentof the households’ welfare respectively. The national, rural and urban poverty headcount rate (P0) declined slightly by 11.68, 6.83 and 13.29 percentage points respectively, which are just 4.38 percent 15.18 percent and 10.66 percent deviation from the national, rural and urban health growth path respectively. The growth elasticity for poverty reduction for Nigeria shows that, an increase of 1percentin health services will reduce the national, rural and urban head-court poverty (P0) level by 1.12percent. The implication of is that the increases in public spending in basic health services will definitely have positive impact on poverty reduction.
Licensed under Creative Common Page 14 However, the decomposed results presented in Table 4 SIMHEAL1 stated that public expenditure on health plays a significant role in promoting welfare and poverty reduction.
Table 4: Public Expenditure on Health and The Reduction of Poverty Scenario: Welfare Indicators, Poverty Indicators and Result Summary of Sensitivity Analysis Per Capita income of the
Household consumption (Naira (billion)) Annual % growth rates (2004-2015) Initial Value,
2004
The Base Growth
Path SIMHEAL1
Sensitivity Analysis SIMHEAL2
Rural income 1106.89 1.88 2.31 3.02
Urban lower income 494.01 2.21 2.88 4.25
Urban higher income 1152.66 3.00 4.18 4.75
Average all households 292.97 0.72 1.90 2.95
Rural 103.92 4.74 4.67 4.92
Urban 562.58 4.41 5.03 5.40
Poverty headcount (P0) Level (%) % point deviations from base year values
National 54.41 -11.19 -11.68 -23.01
Rural 63.27 -5.93 -6.83 -13.30
Urban 43.19 -12.01 -13.29 -20.11
Elasticity -1.08 -1.12 -1.96
Poverty gap (P1) Level (%)
National 21.80 -14.00 -14.34 -21.98
Rural 25.82 -10.08 -10.23 -19.08
Urban 16.70 -18.90 -16.29 -23.79
Elasticity -2.48 -2.16 -2.38
Poverty severity (P2) Level (%)
National 11.91 -8.79 -8.65 -12.65
Rural 14.06 -6.64 -8.02 -10.17
Urban 9.18 -11.42 -10.89 -14.02
Elasticity -5.07 -3.55 -4.78
% ratios to GDP % point deviations from base year values
Values of Sensitivity Analysis
Investment 7.64 2.43 1.83 1.29
Government Expenditure 16.66 -0.99 -0.91 -2.40
Savings 15.87 1.80 -0.20 -0.23
Government Savings 8.24 -0.63 1.31 1.34
National poverty
Licensed under Creative Common Page 15 In this study, the real per capita consumption defines the household consumption expenditure while, in the poverty indicator (national poverty indicators) the ratios between the percent change and the aggregate per capita consumption percent change are defines by P0, P1 and
P2 elasticities. The base growth path, the percentage of poverty point deviations are based on the base year (2004) and 1996 poverty figures (FOS, 1999, NBS, 2004)
Simulated Result of the Sensitivity Analysis: Welfare and Poverty Impacts
Another additional experiment was done to ascertain the sensitivity of the sector in question to changes inelasticity of public spending. The test shows that the sensitivity of the results to alternative values for model parameters is particularly uncertain (see Table 4). Public funds were redirected or re-channeled in favour of the health sector, with an adjustment using the estimated elasticities of the TFP linkage for public expenditure on health to reflect the assumption that the aggregate productivity gain is solely allocated through a productivity gain for the poor people. The implication of this is that, the productivity elasticity for government spending in the health sector is set at the elasticity of education level from 0.115 to 0.211 (see elasticity value of the TFP link in Table 2). This yields dramatically improved on welfare and poverty reduction. The national poverty head-count rate (P0) falls by 23.01 percent percentage points in SIMHEAL2; this represents a 42.78 percent reduction in the incidence of poverty, which nearly meets the MDG of poverty reduction. The welfare improvements are particularly strong for the urban incomes households, where urban poverty head-count rate falls by 20.11 percent percentage points; this is about 46.56 percent reduction in the urban poverty head-count rate, the study shows that a health-led development strategy cannot be ignored.
FINDINGS AND POLICY IMPLICATION OF THE STUDY
The study main finding shows that, the sustainability of the long run grow of the Nigeria economy is depend on how the government laid emphasis on the health sector of the economy and how much of the of public spending is re-reallocated in favour of the health sector, because these will in turn increase the welfare of the people and decreases in poverty. It is also found that, with greater gains among the urban settlers and the relatively rich in Nigeria, but, the distribution of income still worsen.
Licensed under Creative Common Page 16 target for Nigeria is to reduce from 54.41percentin 2004 to 21.40 percent by 2015 the percentage of people or the population in Nigeria living in relative poverty (FGN-MDG, 2005). But the growth elasticity for poverty reduction for Nigeria shows that, an increase of 1% in health services will reduce the national, rural and urban head-court poverty (P0) level by 1.12.
On the sensitivity simulation experiment, more public spending was voted in favour of health, using other values of the estimated parameters in the linkage elasticity of TFP. Looking at sensitivity analysis result, the estimated outcomes were sensitive to the values of the different linkage elasticities of TFP. The outcomes show that public expenditure needed to be better prioritized because looking at the result of the sensitivity analysis on public spending on health, gave a higher return in terms of the growth of economic and reduction in poverty. Therefore, in order to achieve higher reduction in poverty, public investment on health is potentially for the poor and it will contribute to the long term increase in national life expectancy can never be overemphasized.
The estimated outcomes of this paper have several policy implications. For the attainment of a higher poverty reduction, it would be better to prioritized public spending in the urban and rural economy. The government of Nigeria should give priority to health sector of the economy. The reallocating of public funds from the low productivity subsectors and sectors of the economy, sectors like defence, transportation and general administration to the health care sector, will go a long way towards achieving the basic need of in the health sector, also produce faster growth in human productivity and as well as reducing poverty in the country.
Licensed under Creative Common Page 17 CONCLUSION
The main objectives of the paper is to explore how public spending on health can help to achieve the United Nations MDG in terms of improving health service and reduce poverty in Nigeria. A dynamic recursive CGE-MS model was developed, this model incorporates the links and includes the needed minimum household detail to simulate and calibrate the distributional impacts of increasing public expenditure on basic health services and on poverty reduction. The dynamic recursive CGE-MS model was applied to the data of Nigerian economy and estimated over the period 2004 to 2015.
From the ongoing discussion, the results obtained show that public spending and welfare (poverty and income distribution)are best studied in a framework of CGE-MS model, given the nature of economy wide, strong equilibrium effects they imply and since these policy changes take into account interdependencies and interactions within the same economy. This study gave brief literature about the structure and the extent of using a CGE-MS model. In simulating the potential effect of public spending on health care facilities, I rely on elasticities linkages between the growth in total factor productivity (TFP) and public expenditure on the priority areas (focusing on health) and the obtained outcomes depend on the different elasticities values. The result that the accumulated impacts estimated contributed significantly to growth to of the health sector, increase in welfare and decrease in poverty. The past trends in total factor productivity (TFP) growth and factor accumulation, is projected by the continuation of the base growth path, this shows that the aggregate gross domestic product (GDP) witnessed only modest growth and decrease in the headcount poverty rate and some increase in per-capita household consumption within the period 2004-2015.
Licensed under Creative Common Page 18 LIMITATIONS OF THE STUDY
This study has several limitations. Among the most critical are some data constraints, the government should put serious effort into organized, coordinated, and systematic data collection for the long run. Without such data, it is difficult for the government to monitor and evaluate the impacts of various investments and to set future investment priorities to achieve stated objectives.
First, the household classifications in both the urban and rural sectors are too aggregative in the sense that there are (in reality) households with marked differences in income levels within wage-earner household and also within self-employed households. Hence, the result obtained for each of the household groups may not be valid for every household within the group.
Second, relying on the 1996/97 raw data for the whole sample of household budget survey would only limit the results of the objective of this study, which is, to determine the impacts of the different types of government expenditures on poverty in Nigeria.
Third, this study also takes note of the fact that there are other variables rather than government expenditures that determine economic growth and reduce poverty in Nigeria.
Lastly, the model assumes that the economy is in equilibrium but in reality, the Nigerian economy has been embroiled in a number of long running disequilibria and these have been manifested in at least labour and capital unemployment/ underemployment and fiscal deficit, though, the input-out table of Nigeria for recent years recorded balanced government finance, which is an indication of zero fiscal deficits.
REFERENCES
Aigbokhan, B.E. (2000), “Poverty, Growth and inequality in Nigeria, A Case Study” AERC Research Paper 102 Nairobi, Kenya
Barro, R. J. (1997), “Determinant of Economic Growth” A Cross-Country Empirical Study: The MIT Press, Cambridge
Central Bank of Nigeria (CBN) (2004), Statistical Bulletin Volume 15, December, Garki, Abuja, Nigeria Central Bank of Nigeria (CBN) (2005), Statistical Bulletin Volume 16, December, Garki, Abuja, Nigeria Fan, S. and N. Rao (2004), “Public Spending in Developing Countries: Trends, Determination, and Impact. In Coady, D., S. Fan, A. Gulati, H. Lofgren, S. Robinson, and N. Rao, (eds) Public Expenditures, Growth and Poverty in Developing Countries: Issues, Methods and Findings. Draft Report of Synthesis 6. Washington, D.C.: IFPRI
Federal Government of Nigeria (2005), Millennium Development Goals, Published by the National Planning Commission, Abuja
Federal Office of Statistics (1999), Poverty Profile for Nigeria (1980-1996), Lagos, Nigeria
Licensed under Creative Common Page 19 Filmer, D., J. Hammer and L. Pritchett (2000), “Weak Links in the Chain: A Diagnosis of Health Policy inPoor Countries.” World Bank Research Observer 15 (2): 199–224
Fortson, J. (2006), “Mortality, Risk, and Human Capital Investment: The Impact of HIV/AIDS in Sub-SaharanAfrica.” Unpublished paper, University of Chicago
Gupta, S., M. Verhoeven, and E. Tiongson (2003), “Public Spending on Health Care and the Poor,” Health Economics, Vol. 12, pp. 685–96, Also reprinted in Sanjeev Gupta, Benedict Clements, and Gabriela Inchauste, eds., Helping Countries Develop: The Role of Fiscal Policy (Washington: International Monetary Fund, 2004)
Lofgren, H., R.L. Harris, and S. Robinson, with assistance from M. El-Said and M. Thomas (2002), “A Standard Computable General Equilibrium (CGE) Model in GAMS”, Microcomputers Policy Research, Vol.5, Washington, D.C IFPRI
Lofgren, H., S. Robinson, and M.El-Said (2003), “Poverty and Inequality Analysis in a General Equilibrium Framework” The Representative Household Approach, In François Bourguignon and Luiz A. Pereira da Silva (eds), The Impact of Economic Policies on Poverty and Income Distribution: Evaluation Techniques and Tools, World Bank and Oxford University Press, Washington, D.C. and New
MDG (2008), Achieving the Millennium Development Goals in Africa, Recommendations of the Millennium Development Goals, Africa Steering Group, United Nations EuropeanNew York
Mundlak, Y., D. F. Larson, and R. Butzer (1997), “The Determinants of Agricultural Production: A Cross Country Analysis” The World Bank, Memo
Musgrove, P. (1996), “Public and Private Roles in Health: Theory and Financing Patterns,” World Bank Discussion Paper No. 339 (Washington: World Bank).
National Bureau of Statistics (2005), National Accounts of Nigeria, National Bureau of Statistics, Abuja, Nigeria
National Bureau of Statistics (2005), Poverty Profile for Nigeria, National Bureau of Statistics, Abuja, Nigeria
National Bureau of Statistics (2006), The Nigerian Statistical Fact Sheets on Economic Social Development, NBS, Abuja, Nigeria
Odior, E.S. O. (2011), “Government Expenditure on Health, Economic Growth and Long Waves in A CGE Micro-Simulation Analysis: The Case of Nigeria”, European Journal of Economics, Finance and Administrative Sciences (EJEFAS),Issue 31. London, United Kingdom, Page 99 - 113
Poverty in Senegal: A Dynamic Microsimulation CGE Model Analysis,” CEPII, working Paper No.2005-07 Rajkumar, A. S. and V. Swaroop (2002), “Public Spending and Outcomes: Does Governance Matter?” World Bank Working Papers No. 2840 (Washington: World Bank
Roberts, J. (2003), “Poverty Reduction Services in Education and Health: Public Expenditure and Aid” Centre for Aid and Public Expenditure, Overseas Development Institute, 111 Westminster Bridge Road London SE1 7JD UK
Strauss, J. and D. Thomas, (1998), “Health, Nutrition, and Economic Development,” Journal of Economic Literature, Vol. 36, No. 2, pp. 766–817.