RESEARCH
A comprehensive map of the evidence
on the performance evaluation indicators
of public hospitals: a scoping study and best fit
framework synthesis
Kimia Pourmohammadi
1, Nahid Hatam
2, Payam Shojaei
3and Peivand Bastani
2*Abstract
Introduction: Key performance indicators are essential navigation tools for hospitals. They provide managers with valid information enabling them to identify institutional strengths and weaknesses and improve managerial perfor-mance. In this study, the synthesis of evidence relating to hospital performance indicators was carried out by means of a field review and the indicators were analyzed through the Best Fit Method.
Methods: The five-step approach of Arksey and O’Malley was used as follows: selection of the research question; search for related studies; selection and refinement of the studies; synthesis and tabulation of key information; deriva-tion of the related summary and report. Applying the Best Fit Framework Synthesis Method, the initial themes and subthemes were created and a model of public hospitals performance evaluation finally generated.
Results: Forty-nine studies were considered eligible to form part of the synthesis. The final model included the efficiency/productivity, effectiveness and financial themes. The efficiency/productivity sub-themes incorporated human resources indicators, hospital beds, costs, operating room productivity, emergency rooms, ICU, radiology, labs, technology and equipment productivity. Other sub-themes relate to general indicators such as BOR, ALS, number of outpatients and hospitalized patients. Financial themes included profit, revenue, cash flow, cost, investment, assets, debt and liquidity. Concerning effectiveness, the indicators were categorized in terms of access (equity), safety, qual-ity and responsiveness. The accountabilqual-ity indicators were classified into patient-centeredness, staff orientation, and social responsibility.
Conclusion: Hospital performance management is a multi-dimensional issue, each dimension having its own signifi-cance. Based on the evidence, indicators are dependent on the evaluation model employed, the evaluation objective, and the views of executive managers and participants in the study. Selection of the most appropriate indicators is therefore key to a comprehensive performance evaluation system.
Keywords: Hospital, Key performance indicators, Scoping review, Best Fit Framework Synthesis, Equity, Effectiveness, Efficiency
© The Author(s) 2018. This article is distributed under the terms of the Creative Commons Attribution 4.0 International License
(http://creat iveco mmons .org/licen ses/by/4.0/), which permits unrestricted use, distribution, and reproduction in any medium,
provided you give appropriate credit to the original author(s) and the source, provide a link to the Creative Commons license, and indicate if changes were made. The Creative Commons Public Domain Dedication waiver (http://creat iveco mmons .org/
publi cdoma in/zero/1.0/) applies to the data made available in this article, unless otherwise stated.
Open Access
*Correspondence: [email protected]
2 Health Services Management, Health Human Resources Research Center, School of Management and Medical Informatics, Shiraz University of Medical Sciences, Shiraz, Iran
Introduction
Health systems are today one of the largest sectors of the world’s economy and among the most important factors for community development and social welfare [1]. In the World Health Report, hospitals are identified as major health care providers and among the factors determining the equitable distribution of health care and promotion of the justice index in the health system. Furthermore, health systems realize their intermediate and final goals at all levels through enhanced hospital performance [2, 3]. Hospitals are the most essential and, at the same time, most costly part of the health system, so that in devel-oped and developing countries 40% and 80% of the health sector expenses respectively are allocated to hospitals [4, 5]. In line with the rapid growth of expenses, environ-mental changes cause hospitals to face many political, economic, social and cultural changes over time. These changes include population ageing, advances in health technologies, development of information technology and telemedicine [6], all of which require rapid and active responses and measures. In this regard, appraisal of hos-pital performance indicators is an effective strategy for properly managing such changes. Continuous scrutiny of hospital procedures further prepares managers to proac-tively respond to these changes [7–9].
Key performance indicators (KPIs) are considered performance-based decision-making tools for policy-makers and managers at national and local levels. These indicators provide valid information for managers, ena-bling them to identify their strengths and weaknesses and improve their managerial performance. Such information is also a good tool for the development and planning of promotional activities by organizations [10]. However, the paucity of evaluation and control systems in various dimensions such as resources, facilities, staff, goals and strategies means that there is no connection with the environment inside and outside the organization. This is considered to be one of the symptoms of organizations afflicted by disease, leading ultimately to their death [11].
Assessing clinical and economic performance indi-cators in hospitals helps policy-makers, managers and doctors to monitor performance and payment systems. It also promotes procedural transparency and indi-vidual accountability, resulting in better institutional performance [12]. Paying attention to hospital perfor-mance indicators is likewise conducive to achieving the hospital’s internal and external goals [13, 14], mak-ing effective and efficient use of available resources, improving service quality [15], and providing a clear perspective on hospital efficiency and effectiveness [16]. However, given the continuous changes in hospi-tal performance, these indicators should be regularly reviewed on the basis of new evidence [17]. Identifying
performance indicators not only helps to promote the responsiveness, efficiency and effectiveness of organi-zations as well as public trust in them, but also contrib-utes to the planning and development of strategies to deal with complicated environmental changes [18]. The lack of an integrated and universally accepted frame-work for measuring health service performance has led various studies to examine different dimensions and indicators of hospital performance [19–21].
Through a comprehensive review and summary of all studies on a given topic, knowledge synthesis interprets the results of those studies within a general evidential framework so as to provide policymakers and managers with assistance in planning and decision-making [34]. Given that summarizing and publishing research results is one of the main objectives of scoping reviews [35], the evidence about hospital performance indicators was syn-thesized in this study by means of a scoping review and the indicators were analyzed through the use of the Best Fit method.
Method
In this study, a systematic scoping review carried out in 2018, the Arksey and O’Malley approach and the comple-mentary recommendations of Livak were used to spec-ify the performance indicators of public hospitals. The approach consists of five main stages and one optional stage as follows: selecting the research question, search-ing for related studies, selectsearch-ing and refinsearch-ing the studies, synthesizing and tabulating key information, summariz-ing and reportsummariz-ing, and verifysummariz-ing and validatsummariz-ing the results using the expert panel (optional) [35–37]. These stages are discussed as follows.
Selecting the research question
The research question is “What effective performance indicators in public hospitals can be observed in the existing studies?”
Data source and search
At this stage of the scoping review, the three main resources included electronic databases, reference lists of articles and a manual search of other resources, such as relevant key journals, networks, organizations and con-ferences. To ensure that the study was not reiterative, the studies registered at the Cochrane Library were the pri-mary source, where no systematic reviews on the subject were found.
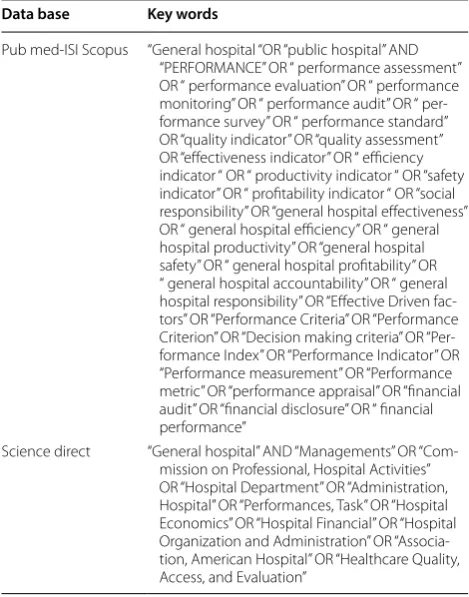
In order to identify the keywords, a pilot study was conducted by the information officer on the PubMed, Web of Science (ISI), Science Direct and SCOPUS data-bases separately. The pilot study showed that by using different keywords in each database, a higher percentage of related articles could be accessed. Table 1 presents the keywords suitable for each database. The main search on the intended databases was done in 2017, from July 26 to the end of December, without time limitations. In addi-tion, so as to have access to new articles related to the subject, the researcher signed up to the databases and activated the alert option.
To increase sensitivity (i.e. to increase the selection of related articles), the researcher examined several
databases, searched with relatively common terms, and used synonym words with the “OR” operator. In addition, in order to increase specificity (i.e. to reduce the selec-tion of unrelated articles), synonyms were used with the “AND” operator. The search strategies are included in Appendix 1: Table 3. To ensure the comprehensiveness of the literature search, references to the selected and related articles were reviewed as well. Furthermore, a manual search was carried out on the resources of net-works, organizations and conferences related to the topic, including unpublished studies of national or local organizations. In order to access unpublished informa-tion sources, experts in the field of hospital operainforma-tion were contacted and access to the identified resources was obtained through personal visits or correspondence with the experts.
Inclusion and exclusion criteria
The following criteria were used as a guide for search-ing and screensearch-ing the articles. The inclusion criteria were English language studies, studies evaluating public hospi-tal indicators, and original studies and reviews including systematic review, meta-analysis, meta-synthesis, scop-ing review, narrative review, rapid review, critical review, Table 1 Selected key words for study
Data base Key words
Pub med-ISI Scopus “General hospital “OR “public hospital” AND
“PERFORMANCE” OR “ performance assessment” OR “ performance evaluation” OR “ performance monitoring” OR “ performance audit” OR “ per-formance survey” OR “ perper-formance standard” OR “quality indicator” OR “quality assessment” OR “effectiveness indicator” OR “ efficiency indicator “ OR “ productivity indicator “ OR “safety indicator” OR “ profitability indicator “ OR “social responsibility” OR “general hospital effectiveness” OR “ general hospital efficiency” OR “ general hospital productivity” OR “general hospital safety” OR “ general hospital profitability” OR “ general hospital accountability” OR “ general hospital responsibility” OR “Effective Driven fac-tors” OR “Performance Criteria” OR “Performance Criterion” OR “Decision making criteria” OR “Per-formance Index” OR “Per“Per-formance Indicator” OR “Performance measurement” OR “Performance metric” OR “performance appraisal” OR “financial audit” OR “financial disclosure” OR “ financial performance”
Science direct “General hospital” AND “Managements” OR
and integrative review. Studies on the indicators of health centers, the health system at the macro level, clinics and community health indicators, journals that did not have a precise review process, and articles such as book reviews, commentaries and opinion articles were adopted as the criteria for exclusion.
Screening
The articles obtained from the search bases were indi-vidually reviewed by two people in three stages (title, abstract and full text). The final decision was made on the basis of agreement, which would require the comments of a third party if agreement was not reached. Screening was effected using the EndNote v.8 software. Given that quality assessment is not commonly performed in scop-ing reviews, the quality of the articles was not investi-gated in this research [38].
Data extraction
According to the refined studies, the data were extracted in order to meet the research objectives and questions. To this end, a data extraction form was initially designed and tested on 10 randomly selected papers. Article authors, years, countries, types of study, study objec-tives, settings, and indices were extracted on this basis. At this stage, one of the authors extracted the data from the selected articles, and the second author examined the data. The form was designed and completed for each arti-cle in the Excel software.
Data synthesis
The Best Fit Framework Synthesis Method was used to analyze the extracted data. In this way, the most suit-able model related to the topic was selected, and the initial themes were created. The codes extracted from
the articles were subsequently positioned in front of the themes [39, 40]. In the present study, the framework introduced by Australia was selected as the primary framework for the performance indicators of public hospitals, which were analyzed in terms of equity, effec-tiveness and efficiency [41]. According to this frame-work, the equity dimension includes the fair access indicators. Also the three dimensions of access, appro-priateness and quality are used to assess service effec-tiveness. For the evaluation of quality, the model adopts the dimensions of safety, responsiveness and continuity of care. Finally, in order to assess efficiency, the sustain-ability of serviced was taken into account (Fig. 1).
Based on the Best Fit Method, the selected frame-work might change during the research and data col-lection, whereby a new conceptual framework could be generated [39]. Under this method, both deductive and inductive approaches were therefore used for data analysis [42] (Fig. 1).
Performance indicators were initially coded as semantic units. In the first stage, indicators related to the dimensions of the initial model were inserted deductively through explicit analysis. Specific words including equity, effectiveness, and efficiency were searched and their related indicators were identified and positioned through the closed coding method. In the second stage, indicators that were not included in the initial framework were classified inductively through the open coding method. For this purpose, the articles were studied one or several times for immer-sion. The indicators were then identified as semantic units through an implicit approach. In the following stage, the codes were grouped on the basis of seman-tic similarities. After that, the codes of each study were compared with those of other studies and ultimately
classified as themes and sub-themes. Finally, the results of these two stages were put together and a new frame-work was created.
Ethical considerations
Before using the open access studies, the journals or authors of the articles were contacted and their permis-sion was obtained. In order to prevent bias, all stages of the study such as screening, data extraction and data analysis were carried out by two individuals.
Results
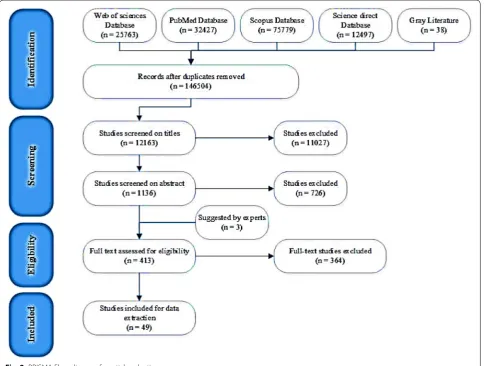
In the initial search, 146,504 English articles were found in scientific databases and by means of manual search, with duplicate and unrelated articles being removed, and 12,163 articles were reviewed. In the second stage, 1136 studies were reviewed based on their abstracts. As a result, 723 articles were excluded because they did not meet the inclusion criteria (413 ones were selected). Finally, after reviewing the full texts of the remaining
articles, 49 ones were considered eligible to enter the study (Fig. 2). The features of these studies are summa-rized in Appendix 2: Table 4. Iran, USA and Brazil had 10, 8 and 5 articles respectively, Australia and Canada had 3, Britain, Turkey, Greece, and New Zealand had 2 articles, and Spain, Romania, Saudi Arabia and Japan had 1 paper; there was 1 article from the OECD countries and 1 from Nordic countries, and the other studies were reviews.
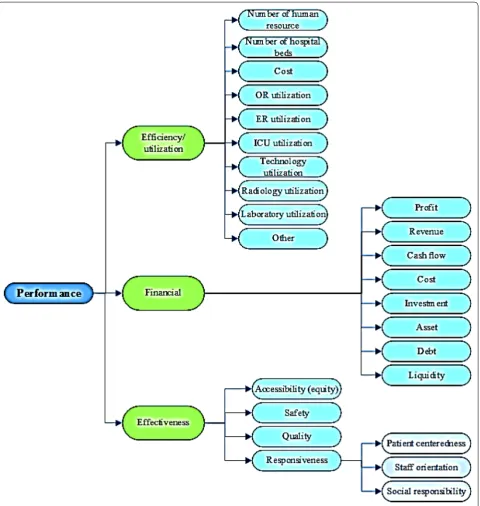
Based on the Best Fit Method, the final model included the efficiency/productivity themes, the effectiveness of the original model and the financial theme identified from the literature review (Fig. 3). The efficiency/pro-ductivity sub-themes included human resources indica-tors, hospital beds, costs, operating room productivity, emergency rooms, ICU, radiology, labs, technology and equipment productivity. Other sub-themes relate to gen-eral indicators such as bed occupancy rate, mean length of stay, number of outpatients and hospitalized patients. Financial themes were categorized into eight sub-themes including: profit, revenue, cash flow, cost, investment,
asset, debt and liquidity. Concerning effectiveness, the indicators were further categorized into the four sub-themes of access (equity), safety, quality and responsive-ness. The accountability indicators were classified into three categories: patient-centeredness, staff orientation, and social responsibility.
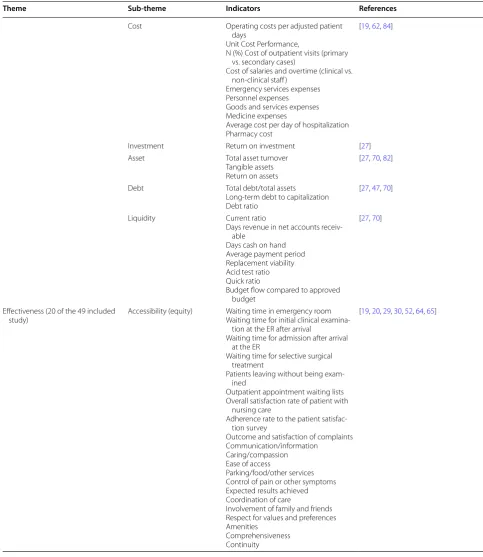
The indicators extracted from the studies are shown in Table 2 based on the final model. In this study, 173 indi-cators of public hospital performance evaluation were identified, most of which were in the effectiveness dimen-sion (100 indicators). Regarding efficiency and financial dimensions, 41 and 32 indicators respectively were iden-tified Best Fit Method.
Table 2 Taxonomy of hospital performance indicators
Theme Sub-theme Indicators References
Efficiency/utilization (17 of the 49
included study) Number of human resources Number of physiciansNumber of nurses,
Number of clinical personnel, Number of full-time equivalent interns/
residents
Number of administrative personnel, Number of nonclinical personnel, FTE/adjusted admissions
[20, 22–24, 45, 51, 52, 79, 80]
Number of hospital beds Percentage of specialized beds (%),
Percentage of other beds
The ratio of active beds to fixed beds
[25, 46, 70, 79, 80]
Cost Cost of medical/operating supplies
Wage and salary payments to person-nel engaged in patient/non-patient care
Capital costs, i.e. building and land; Adjusted depreciation charges for fixed
and movable equipment; Cost/adjusted admission
Cost of inpatient services per patient day (cost per in-patient)
[22, 45, 47, 48, 50, 79]
OR utilization Number of OR cases booked
Number of OR cases performed Number of OR cases cancelled Percentage of OR cancellations Percentage of surgical operations to
surgery beds Day stay surgery rate
[19, 24, 26, 30]
ER utilization Total number of ER visits
ER treatment time [22, 30, 48]
ICU utilization Average ICU bed Occupancy rate
Average ICU length of stay [30, 48]
Technology utilization Use of electronic medical records,
Rate of utilization of existing technol-ogy
Number of high-tech services Number of medical supplies per bed Number of other operating supplies
per bed
Clinical integration (binary) Integrated data base
[20, 22]
Radiology utilization Total radiological procedures [30]
Laboratory utilization Total lab investigations [30]
Other Bed occupancy rate
Average length of stay Bed turnover interval Monthly number of inpatients Monthly number of outpatients Average number of drugs per
encoun-ter
[19, 20, 22–25, 27, 29, 30, 46–48, 51, 53,
62, 66, 79, 80]
Financial (15 of the 49 included
study) Profit Total marginal profitMedical benefit–cost–per FTE [19, 81, 82]
Revenue Operating revenue per adjusted patient
days
Non-operating revenue
Current ratio, n (%) = the ratio of net
income (revenues/expenses) to total revenues
Revenue per physician FTE
[19, 47, 51, 62]
Table 2 (continued)
Theme Sub-theme Indicators References
Cost Operating costs per adjusted patient
days
Unit Cost Performance,
N (%) Cost of outpatient visits (primary vs. secondary cases)
Cost of salaries and overtime (clinical vs. non-clinical staff )
Emergency services expenses Personnel expenses Goods and services expenses Medicine expenses
Average cost per day of hospitalization Pharmacy cost
[19, 62, 84]
Investment Return on investment [27]
Asset Total asset turnover
Tangible assets Return on assets
[27, 70, 82]
Debt Total debt/total assets
Long-term debt to capitalization Debt ratio
[27, 47, 70]
Liquidity Current ratio
Days revenue in net accounts receiv-able
Days cash on hand Average payment period Replacement viability Acid test ratio Quick ratio
Budget flow compared to approved budget
[27, 70]
Effectiveness (20 of the 49 included
study) Accessibility (equity) Waiting time in emergency roomWaiting time for initial clinical
examina-tion at the ER after arrival
Waiting time for admission after arrival at the ER
Waiting time for selective surgical treatment
Patients leaving without being exam-ined
Outpatient appointment waiting lists Overall satisfaction rate of patient with
nursing care
Adherence rate to the patient satisfac-tion survey
Outcome and satisfaction of complaints Communication/information
Caring/compassion Ease of access
Parking/food/other services Control of pain or other symptoms Expected results achieved Coordination of care
Involvement of family and friends Respect for values and preferences Amenities
Comprehensiveness Continuity
Table 2 (continued)
Theme Sub-theme Indicators References
Safety Rate of nosocomial infections
Rate of accidents Rate of complications Failure to rescue Incidents/near misses Accidents/adverse events Needle stick events Hospital-acquired infections Medical errors per sector Staff injury
Staff needle puncture incidents Ventilator pneumonia
Technical difficulty with procedure Medical equipment-related adverse
event Patient falls
Wrong surgery rate (wrong side, wrong body part, or wrong person) Hand hygiene compliance rate Postoperative respiratory failure Postoperative sepsis
Prevalence of sentinel events
[19, 22, 30, 47, 48, 52, 53, 64, 66–68]
Quality Unplanned readmissions
30-day mortality Perioperative mortality
Cancer patients successfully surviving surgery/chemotherapy/transplant The pure rate of hospital mortality, Success to hospitals in obtaining
certifi-cates of management quality Appropriateness of care (caesarean
section rate)
Surgery postponed or canceled Management team participation in
Quality Improvement (QI) programs (Board activity in QI, CEO participa-tion in QI activities, Board monitoring of QI, Clinic audit meetings held, Perceived barriers to QI) Diffusion of QI across hospital units Proportion of FTEs on QI teams Proportion of physicians on QI teams Management of hospital waste Number of guidelines developed Proportion of physicians using
guide-lines
Staffing level and training hours (for staff with direct patient contact) A patient safety committee A system for reviewing patient deaths Policies for handling dangerous
chemicals
A credentialing committee
Quality of life used to assess organiza-tional performance
Technical quality of care Appearance of facilities
[19, 20, 26, 29, 47, 48, 52, 53, 64, 65,
Table 2 (continued)
Theme Sub-theme Indicators References
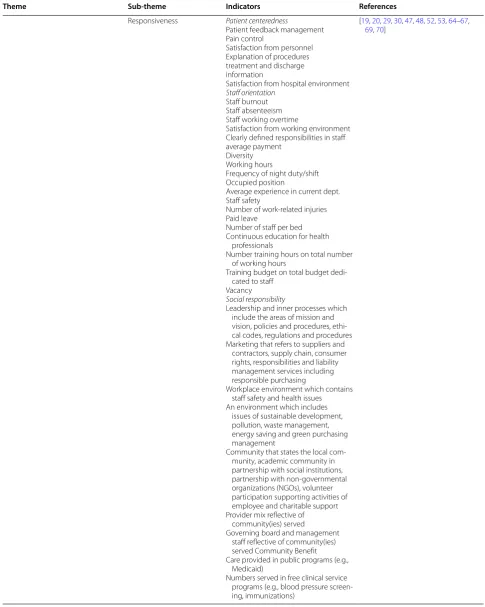
Responsiveness Patient centeredness
Patient feedback management Pain control
Satisfaction from personnel Explanation of procedures treatment and discharge information
Satisfaction from hospital environment Staff orientation
Staff burnout Staff absenteeism Staff working overtime
Satisfaction from working environment Clearly defined responsibilities in staff average payment
Diversity Working hours
Frequency of night duty/shift Occupied position
Average experience in current dept. Staff safety
Number of work-related injuries Paid leave
Number of staff per bed Continuous education for health
professionals
Number training hours on total number of working hours
Training budget on total budget dedi-cated to staff
Vacancy Social responsibility
Leadership and inner processes which include the areas of mission and vision, policies and procedures, ethi-cal codes, regulations and procedures Marketing that refers to suppliers and
contractors, supply chain, consumer rights, responsibilities and liability management services including responsible purchasing
Workplace environment which contains staff safety and health issues An environment which includes
issues of sustainable development, pollution, waste management, energy saving and green purchasing management
Community that states the local com-munity, academic community in partnership with social institutions, partnership with non-governmental organizations (NGOs), volunteer participation supporting activities of employee and charitable support Provider mix reflective of
community(ies) served
Governing board and management staff reflective of community(ies) served Community Benefit Care provided in public programs (e.g.,
Medicaid)
Numbers served in free clinical service programs (e.g., blood pressure screen-ing, immunizations)
[19, 20, 29, 30, 47, 48, 52, 53, 64–67,
Discussion
As demonstrated by this and other studies, there exist various objectives, fields of inquiry and methodological approaches when it comes to evaluating hospital perfor-mance; with each study having its specific objective and approach (Appendix 2: Table 4). In any study, perfor-mance evaluation frameworks and indicators are selected and evaluated according to the objective of the study. The resulting differences may be due in part to national policies and plans or to technical differences in the health systems of countries [26]. However, the experience of dif-ferent countries in selecting and using the indicators can be useful to policymakers, health managers and research-ers in other countries [43]. The present study seeks to present the indicators used to evaluate hospital perfor-mance in the form of a comprehensive package. The indi-cators concerned have been classified under three main headings (efficiency/utilization, finance and effective-ness), as discussed below.
Analysis of the selected studies shows that the model adopted in this study differs from the original model (Figs. 1, 3). In the original (Fig. 1), equity (access) was considered a major dimension of hospital performance as well as one of the subsets of effectiveness. Given that most studies assigned indicators of equity in access to the effectiveness dimension, and that this dimension was in practice often used in macro-decisions of the Minis-try and was less likely to come within the scope of the authority of hospital managers [1–7], access (equity) in the proposed model was considered one of the subsets of the effectiveness of hospital services, along with other indicators such as safety, quality and responsiveness. In the proposed model, safety and responsiveness were included among the main subsets of effectiveness in view of their importance in hospitals.
Another dimension of the original model was effi-ciency, which was developed in the proposed model in view of the variety and diversity of the indicators used in previous studies. The indicators of efficiency were organ-ized into ten sub-categories, most of which emphasorgan-ized utilization of resources and equipment in different parts of the hospital, such as the operating room (OR), emer-gency room (ER), ICU and laboratory.
The results of this review showed that financial issues were of great importance in hospital performance evalu-ation studies. Limited financial resources and increased hospital expenses could explain why directors and researchers tend to focus on financial areas. However, new models and frameworks in the field of performance evaluation emphasize the multidimensional aspects of hospital performance and underline that other dimen-sions, in addition to finance, need to be taken into account [8]. In the proposed model, the effectiveness
dimension, including the aspects of quality, safety, access, suitability and responsiveness, also has its place. Ser-vice effectiveness and improvement are not only factors of customer satisfaction (including patients, staff and the wider community) but also help to reduce costs and increase hospital income. In what follows, we discuss the dimensions of the proposed model in more detail.
Efficiency/utilization
One of the challenges faced by health managers through-out the world is hospital efficiency [26] given that hos-pitals represent a large proportion of national health expenditures. In 2012, hospitals accounted for about 30% of total health expenditures in the OECD countries and 37% in the EU countries [28]. In their study, Lotfi et al. described hospitals as “organizations with inefficient resource management, low profitability, and low-quality services” (especially in developing countries). They stated that this poor management entailed a waste of resources and was a barrier to the efficiency of hospitals. Efficiency is therefore one of the most important factors in perfor-mance management systems in health-care organizations [23, 24, 44].
In the present study, several indicators were employed to evaluate efficiency as an major dimension of hospi-tal performance. In the framework provided by WHO, efficiency is one of the six main dimensions of hospital performance evaluation [17]. Based on the findings, 17 studies used efficiency indicators in evaluating the per-formance of hospitals [20, 22–24, 26–29, 45–53]. These indicators were categorized under the sub-themes of human resources, hospital beds, costs, operating room productivity, emergency rooms, ICU, radiology, labora-tory, technology and facilities productivity. Some of the most important indicators of efficiency are the number of human resources, bed occupancy rate, length of stay, uti-lization rate of the existing technologies, and the rate of drug prescription [47, 48].
Human resources, are considered important aspects of hospital efficiency evaluation [46, 54]. For instance, the number of hospital staff per bed is a key indicator in eval-uating hospital performance and efficiency. The lower this ratio, the more productive and efficient the hospital will be [50]. The quality of care is another major indica-tor that must be taken into consideration. Additionally, a very low rate of bed occupancy, which represents the rate of hospital bed use, indicates a low level of hospital efficiency, which is highly correlated with the patients’ length of stay and bed turnover [46].
hospital financial performance. They measured efficiency indicators in terms of the ability to provide services at the level of predicted costs and to minimize management costs. They further selected the cost performance index of departments (units) and the percentage of corporate services as measures for evaluating hospital efficiency [27].
Operating rooms (ORs) are among the most vital and expensive parts of hospitals since 60% to 80% of hospi-tal admissions involve surgical interventions. This sector accounts for more than 40% of the total hospital costs and a large proportion of hospital income [55, 56]. Utili-zation of OR affects the outcomes of surgical patients in hospitals so that even a small problem in the OR process can impact on the overall quality and performance of the hospital. Inefficiency of OR lead to delays in service deliv-ery to patients, which can result in dissatisfaction on the part of patients and health care providers [55]. Hence, with the increase in financial pressures, most hospitals are looking for ways to enhance their income and reduce avoidable costs through the evaluation of OR processes. Given the impact of OR performance on hospital pro-ductivity, assets and personnel, many hospitals are devot-ing substantial resources to improvdevot-ing efficiency in this regard [55, 56].
Emergency departments play a major role in
hospi-tal performance since they deal with the most numer-ous, diverse, troubled and sensitive groups of patients, requiring prompt care and service [57, 58]. The number of patients treated and the duration of treatment in the emergency department were identified in the present research as indicators of efficiency and utilization of emergency departments. In the study by Kang et al., the most important emergency performance criteria were the timing of the various stages of emergency processes and the number of patients (admitted, in the waiting queue, and cancelled appointments) [58]. Horwitz et al. introduced the waiting time and length of visit as impor-tant indicators of the efficiency, timeliness, safety and patient-centeredness of emergency care [59].
The DEA and Pabon Lasso approaches are two of the most widely used methods for evaluating hospital effi-ciency. Using hospital indicators, both methods consider hospital inputs and outputs to measure efficiency. DEA is a linear programming approach that examines the rela-tionship between hospital inputs and outputs, comparing them with the ideal (optimum) process [9, 23, 28, 45, 48]. Although there are limitations in linking inputs to out-puts or health care outcomes (such as the lack of activity-based costs), there are also opportunities in measuring efficiency via the optimal use of available and accessible technologies, productivity rate, staff ratios and financial management [17].
Finances
One of the common dimensions of performance evalu-ation is the financial aspect [20, 60]. In this regard, hospital financial models are unique in terms of their design and application and are affected by a hospital’s mission, goals, financing and accounting methods; the needs of population covered; the form of insurance reimbursement and the type of ownership. Hospital managers can overcome the hospital’s economic prob-lems, make the right decisions, clarify the unit cost of services and create a competitive situation to provide goods and services applying a suitable financial evalua-tion model [61].
The results of this study indicated that 15 studies used financial indicators in evaluating hospital perfor-mance [19, 22, 27, 29, 30, 45, 50, 62, 63]. Based on the literature review, the different indicators used to evalu-ate financial performance are cevalu-ategorized into 8 sub-themes including Profit: total marginal profit, medical benefit–cost–per FTE); Revenue: operating revenue per adjusted patient days, non-operating revenue, cur-rent ratio, revenue per physician FTE; Cash flow: cash to total debt; Cost: operating costs per adjusted patient days, unit cost performance, cost of outpatient vis-its, cost of salaries and overtime, emergency services expenses, personnel expenses, goods and services expenses, medicine expenses, average cost per day of hospitalization, pharmacy costs; Investment: return on investment; Asset: total asset turnover, tangible assets, return on assets; Debt: total debt/total assets, long-term debt to capitalization, debt ratio; and Liquidity: current ratio, days revenue in net accounts receivable, days cash in hand, average payment period, replace-ment viability, acid test ratio, quick ratio, budget flow compared to approved budget) [61–66].
Classification of financial indicators focuses on the financial status of a hospital. Since the evaluation of each dimension of financial performance by itself may lead to a wrong decisions and plans, it is necessary to review them simultaneously. For instance, the evalua-tion of profitability indicators demonstrate the financial gain of a hospital, but liquidity indicators may suggest the inability of the hospital to pay off debts (bills) [27, 61]. Indicators of net profit or loss and operating profit or loss only represent and analyze the balance between income and expenses [60].
index in this regard is the cost/revenue ratio in public governmental hospitals [19, 59, 84].
Effectiveness
Failure to provide effective health services reduces the quality of life, increases the burden of disease and disabil-ity and finally prevents the promotion of productivdisabil-ity in other economic, social and political areas [49]. The need to provide effective services has therefore always been a major issue. Performance measurement is a tool for evaluating the effectiveness of any organizational activity [47]. Thus the studies of Braithwaite et al. on eleven iden-tified frameworks found that the effectiveness dimension had the most frequent replication in the performance evaluation frameworks [43].
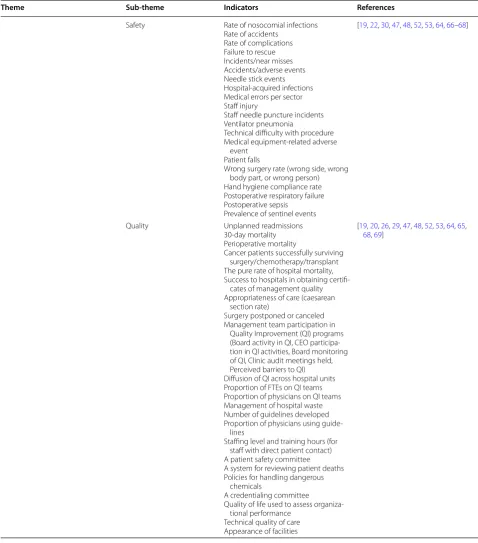
Based on data extracted from the literature, 20 stud-ies used indicators related to the effectiveness of hospital services [19, 20, 22, 26, 29, 30, 47, 48, 52, 53, 60, 63–71], categorized in the four sub-themes of access (equity), safety, quality and responsiveness. Although hospitals have tended to concentrate on improving efficiency (until the 1990s), recent efforts have addressed the issues of safety, quality, responsiveness and equity [26, 71].
First of all, the effectiveness of health services depends on the fair access of people to health services [26].
Access to medical care is a relatively complex multidi-mensional issue. From the perspective of a behavioral model, access includes six dimensions: potential access, achieved access, fair access, unfair access, efficient access and effective access [72]. In the Australian health perfor-mance framework, access to services was mentioned as part of the hospital performance evaluation. For instance, waiting times for elective surgeries and waiting times in emergency rooms were indicators of access to hospi-tal services. The waiting time for surgery is indicative of the timeliness of the provision of services based on need [73]. In the study of Khalifa et al., patient access indica-tors included the number of referred patients, admitted patients and those waiting in line for admission [30]. Nerenz et al. considered easy access and waiting time as factors affecting patient satisfaction [60]. Ioan et al. also considered access and equity as aspects of hospital responsiveness [63]. In their study, Davis et al. used eth-nic, social, and economic diversities to evaluate equity [26].
Another factor influencing the effectiveness of hospi-tal activities is the quality of the services provided [74]. Quality of care refers to the clinical content of the care provided for a specific group of patients. However, it also includes certain quality indicators such as hospi-tal infection or satisfaction of all patients admitted to the hospital [60]. Quality influences the effectiveness of activities as well as financial performance through
its impact on profitability, cost, customer loyalty, and customer attraction [75]. Thus, quality is a key deter-minant of market share, return on investment, and cost reduction [76]. So, the need for evidence-based decision-making, measurable improvement, and use-ful information for comparison has led to an increasing emphasis on quality assessment in the health system [48]. However, the existence of unrestricted indica-tors related to the quality of services has rendered this dimension of performance evaluation heterogeneous. In the presented frameworks, quality indicators were categorized in different ways. For example, in the Don-abedian model, quality was represented by the three concepts of structure, process, and output [60]. The SERVQUAL model also classified service quality into five categories: tangibles, reliability, accountability, ser-vice assurance, and empathy [77, 78]. Thus, the vital position of performance quality for all health benefi-ciaries (specialists, policymakers, service providers and service recipients) has led several studies to focus on the quality of hospital services and various indicators to be used in relation to their objectives.
Another factor influencing the effectiveness of hospital activities is the safety of the services provided. Although safety is one of the basic principles and elements of qual-ity, it has recently been studied separately in certain cases [68]. Patient safety is focused on treatment effectiveness, and its indicators directly reflect treatment effectiveness [30, 68]. In various studies, safety has been considered a dimension of hospital performance evaluation, includ-ing the safety of patients, personnel and environment [17, 63]. The framework presented in the study by Veillard et al. highlighted the central role of safety in the govern-ance of health systems and hospital management. Patient safety includes issues such as the development and use of standard guidelines, quality monitoring, issuance of prescriptions and drug delivery, infection control mecha-nisms, continuing care and professional qualifications [17]. McLoughlin et al. selected 21 indicators for coun-tries and classified them into five categories: hospital infections, operation and postoperative complications, sentinel events, midwifery, and other care-related inci-dents [68].
Responsiveness indicators, based on patient feedback, are of great importance in evaluating hospital perfor-mance. In certain studies, responsiveness has been regarded as a separate dimension of hospital perfor-mance [30, 48]. Based on the analyses conducted in this study, responsiveness encompasses three fields:
treatment by the patient), dignity of patients, confidenti-ality, prompt attention, basic amenities and a social sup-port network;
Staff orientation covering staff burnout, absenteeism, overtime worked, satisfaction with working environ-ment, clearly defined responsibilities, average remu-neration, diversity, working hours, frequency of night duty/shift work, position occupied, average experi-ence in current department, personnel safety, number of work-related injuries, paid leave, number of staff per bed, continuous education for health professionals, number of training hours against total number of work-ing hours, trainwork-ing budget against total budget dedi-cated to staff and vacancy;
Social responsibility is described by leadership and inner processes (including mission and vision), policies and procedures, ethical codes, regulations and proce-dures, marketing in terms of suppliers and contractors, supply chain, consumer rights, responsibilities and liability management services (including responsible purchasing) and the workplace environment (including staff safety and health and issues of sustainable devel-opment, pollution and waste) [75–78].
This approach is in accordance with Simou et al. who classified responsiveness indicators under the two cate-gories of patient centeredness and staff orientation [48]. These various indicators show the wide compass of this dimension and the importance of this aspect in hospital performance evaluation.
The foregoing indicators in the field of hospital man-agement are extracted from the entire range of exist-ing literature and derived from various countries with a diversity of policies, cultures and rules. It is claimed that careful and comprehensive consideration and cate-gorization of these indicators yield a conceptual frame-work that can be used as a basic theory and model synthesis worldwide, while remaining subject to adjust-ment and customization according to each country`s culture, rules and policies and the structure of the health system concerned.
Conclusion
Hospital performance management is a multi-dimen-sional issue, with each dimension having its own signifi-cance. One-dimensional performance evaluation can lead to incorrect policy-making and decisions. On the other hand, several indicators of diversity in the literature high-light the scope and complexity of hospital performance. Based on the evidence, indicators are dependent on the evaluation model employed, the evaluation objective and the views of executive managers and participants in the study. It follows that a comprehensive and complete
performance evaluation system is conditional upon the selection of the most appropriate indicators as a first step.
Practical implications Background
Key performance indicators (KPIs) are considered essential decision-making tools for policymakers and managers at national and local hospitals.
Purpose
Developing a comprehensive framework to provide the indicators used to evaluate hospital performance.
Methodology
The synthesis of evidence on hospital performance indicators was carried out through a scoping review and the indicators were analyzed using the Best Fit Method.
Results
Based on the Best Fit Method, the final model included the topics of efficiency/productivity, the effectiveness of the original model and the financial aspects as identified from the literature review.
Conclusion
Through a comprehensive review and summarization of all studies related to the same research question, knowl-edge synthesis interprets the results of those studies within a general framework of evidence, ultimately help-ing policymakers and managers with plannhelp-ing and deci-sion making.
Practical implications
Hospital performance management is a multi-dimen-sional issue, with each dimension having its own signifi-cance. One-dimensional performance evaluation leads to incorrect policy making and decisions. On the other hand, several indicators of diversity in the literature high-light the scope and complexity of hospital performance. Based on the evidence, indicators are dependent on the evaluation model employed, the evaluation objective, the views of executive managers, and the study participants. It follows that a comprehensive and complete perfor-mance evaluation system is conditional upon the selec-tion of the most appropriate indicators as a first step.
Authors’ contributions
Author details
1 Health Services Management, Student Research Committee, Shiraz Univer-sity of Medical Sciences, Shiraz, Iran. 2 Health Services Management, Health Human Resources Research Center, School of Management and Medical Informatics, Shiraz University of Medical Sciences, Shiraz, Iran. 3 Department of Management, Shiraz University, Shiraz, Iran.
Acknowledgements
This research, derived from Proposal No. 95-01-07-13769, was conducted by Mrs. Kimia Pourmohammadi as part of the activities required for a Ph.D. degree in health care management at the Shiraz University of Medical Sci-ences. The authors wish to express their sincere gratitude to the research administration of Shiraz University of Medical Sciences for its administrative support and to the English Editor Mr. Kamyar Pourmohammadi and improving native English Mr. John David Corbett as the United Naions and UNESCO reviser/editor.
Competing interests
The author declares that they have no competing interests.
Availability of data and materials
Data is available in an endnote library.
Consent for publication
There was no difficulty in publishing the results. All the included databases and materials are available for public use.
Ethics approval and consent to participate
This study is approved by Shiraz University of Medical Sciences ethics commit-tee with the ID Number of IR.SUMS.REC.1396.S274.
Funding
There is no funding.
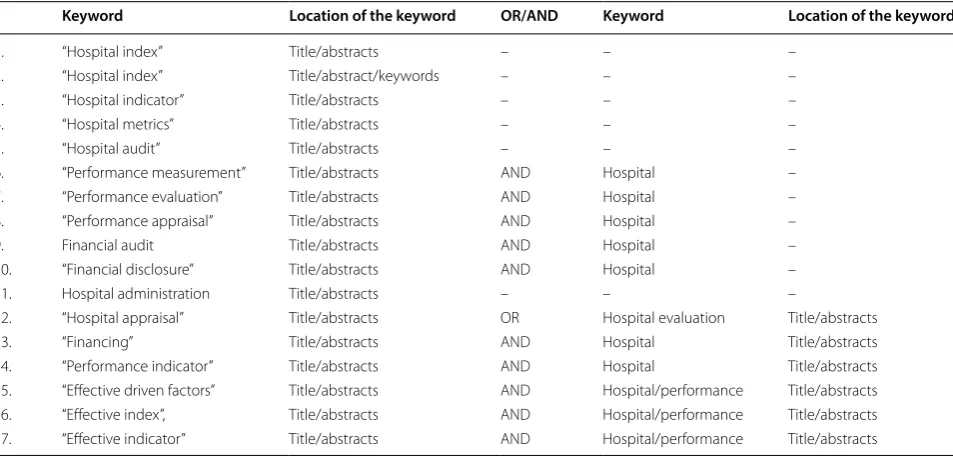
Appendix 1 See Table 3.
Table 3 The search strategy
Keyword Location of the keyword OR/AND Keyword Location of the keyword
1. “Hospital index” Title/abstracts – – –
2. “Hospital index” Title/abstract/keywords – – –
3. “Hospital indicator” Title/abstracts – – –
4. “Hospital metrics” Title/abstracts – – –
5. “Hospital audit” Title/abstracts – – –
6. “Performance measurement” Title/abstracts AND Hospital –
7. “Performance evaluation” Title/abstracts AND Hospital –
8. “Performance appraisal” Title/abstracts AND Hospital –
9. Financial audit Title/abstracts AND Hospital –
10. “Financial disclosure” Title/abstracts AND Hospital –
11. Hospital administration Title/abstracts – – –
12. “Hospital appraisal” Title/abstracts OR Hospital evaluation Title/abstracts
13. “Financing” Title/abstracts AND Hospital Title/abstracts
14. “Performance indicator” Title/abstracts AND Hospital Title/abstracts
15. “Effective driven factors” Title/abstracts AND Hospital/performance Title/abstracts
16. “Effective index”, Title/abstracts AND Hospital/performance Title/abstracts
Table
4
Summar
y of char
ac
teristics of included studies
First author (y
ear) Coun tr y Study desig n A im of study Setting 1. Vera Ant
onia Büchner (2000–2011)
G er man y Quantitativ e, cr oss-sec tional In vestigat es pot
ential changes in hospital
per
for
mance af
ter health syst
em entr y 833 hospitals 2. M ar celo Cr
istiano de A
ze vedo , (2012) Sao P aulo , Brazil Quantitativ e, cr oss-sec tional If siz e, administrativ e le vel
, legal status
,
type of unit and educational ac
tivit
y
influence the hospital net
w or k per for -mance 533 hospitals 3. Duy gu K irg in Toprak (2010) Tu rk ey Quantitativ e, cr oss-sec tional Explor
e the eff
ec
t of ha
ving ISO 9000 cer
-tification on the per
for
mance of public
hospitals 146 hospitals 4. Neidamar P edr ini Ar ias F ugaça (2014–2015) Brazil Qualitativ
e field study
To de
velop a pr
oposal f
or a nursing panel
of indicat
ors
200 medical r
ecor
ds of patients
5. Jack Z wanziger (1990–1999) USA Quantitativ e, cr oss-sec tional
Study the impac
t of saf
et
y net ac
tivities
on t
otal pr
ofit mar
gins and operating
expenditur es 16,680 Hospital*y ear obser vations . 6.
Joel Kupersmith (1989–2004)
Lit eratur e r evie w To compar
e the qualit
y of car
e in t
each
-ing hospitals with that in nont
eaching
hospitals
7.
Josue P
atien Epane (2007–2014)
USA
Quantitativ
e, long
itudinal
Explor
es the impac
t of hospitalists staff
-ing int
ensit
y on hospitals_ financial
per
for
mance
4354 hospitals per y
ear
8.
A
sgar A
ghaei Hashjin (2002–2008)
Iran
M
ix
ed method long
itudinal
To descr
ibe the de
velopment and pr
ocess
of implementation of the HP
MP
, and t
o
explor
e the impac
t
On hospital per
for mance 696 hospitals 9. Natalie T aylor (2000–2014) A ustralia Syst ematic r evie w Under tak
e a syst
ematic r
evie
w of qualita
-tiv
e lit
eratur
e t
o identify methods used
to identify high per
for
ming hospitals
, the
fac
tors associat
ed with high per
for mers , and prac tical strat eg ies f or impr ov ement 19 studies 10. P. X enos (2009–2012) Gr eece Cr oss-sec tional
To examine the dynamics of efficienc
y and
pr
oduc
tivit
y in Gr
eek public hospitals
117 public hospital
11. Am y K . R osen (2005–2006) USA Quantit y
Find the r
elationship bet w een saf et y cli -mat
e and saf
et
y out
comes in hospitals
30 hospital 12. D enise F or nazar
i de Oliv
eira (2003)
Brazil
Quantitativ
e and qualitativ
e cr
oss-sec
tional
Obtaining subsidies f
or standar
dization of
a qualit
y assessment pr
og ram 1129 patients 13. Anam P arand (1983–2010) UK Syst ematic r evie w To r evie
w the empir
ical lit
eratur
e t
o
identify the ac
tivities
, time spent and
engagement of hospital managers in qualit
y of car
Table
4
(c
on
tinued)
First author (y
ear) Coun tr y Study desig n A im of study Setting 14. Renu A gar wal (2016) A ustralia M ix ed cr oss-sec tional To in vestigat
e the qualit
y of management
prac
tices of public hospitals in A
ustralian
healthcar
e syst
em
Benchmar
k in 7 countr
ies (Sw eden, USA, UK , G er man y, F rance , I taly and Canada) 15.
Abhijit Basu (2006–2007)
UK
Quantit
y, cr
oss-sec
tional
Analysis the data r
egar
ding the diff
er ent clinical qualit y per for mance indicat ors mentioned in The I nt elligent Boar d
(2006) and t
o det
er
mine whether the
results could be r
eliably used t
o int er pr et a hospital ’s per for mance One hospital 16. Pet er Da vis (2001–2009) Ne w Z ealand Quantitativ e, Cr oss-national
Focus on e
valuating hospital per
for
mance
,
using the Ne
w Z
ealand public hospital
as a prag
matic application. P
resent
descr
iptiv
e r
esults f
or the efficienc
y and eff ec tiv eness measur es . I
n each case
values f
or hospitals ar
e rank
ed
. Using the
coefficient of var
iation
35 hospitals
17.
Xiuzhu Gu (2016)
Japan
Quantitativ
e
Pilot study on hospital management pis
To captur
e fac
tors behind pr
of
essional
vie
ws of indicat
or usefulness as a com
-mon struc
tur
e f
or assessing healthcar
e
per
for
mance and their impor
tant charac ter istics t o desig n limit ed k ey per for mance indicat
ors (pis) f
or holistic
hospital management
228 manager and 894 staff r
esponses 18. M ohammad M ehr tak (2014) Iran Quantitativ e, cr oss-sec
tional and r
etr o-spec tiv e To measur
e the efficienc
y of hospitals
Emplo
ying t
w
o distinc
t methods
18 general hospital
19.
G
eor
ge H. P
ink (2000–2005) Canada M ix ed D escr iptiv e statistics , hist og rams and scatt er plots w er
e used t
o v er ify pr og ramming accurac y This ar ticle descr
ibes the method used t
o
selec
t k
ey financial indicat
ors f or inclu -sion in hospital r epor t
. And descr
ibe the
lit
eratur
e, panel and sur
ve
y appr
oach
that was used
, and w
e pr
esent the r
esults
for fiv
e y
ears of r
ecent data f
or Ontar
io
hospitals
12 hos
20.
Vivian G (2004)
USA Quantitativ e cr oss-sec tional Analysis t
o assess the trade
-off
s bet
w
een
qualit
y and efficienc
y in U
.S. hospitals
1,377 ur
ban hospital
21.
Effie Simou (1980–2010)
Gr eece M ix ed A lit eratur e r evie
w and a consensus panel
D
escr
ibes the de
velopment of a pr
elimi
-nar
y set of qualit
y indicat
ors
, which w
er
e
used in the
“health monit or ing indicat ors syst em pr ojec
t, with the pur
pose of
assessment the qualit
y of all the aspec
ts
rele
vant t
o public hospital healthcar
e
w
or
kf
or
ce and ser
vices pr
Table
4
(c
on
tinued)
First author (y
ear) Coun tr y Study desig n A im of study Setting 22. Dan C ulica (2003–2005) USA Quantitativ e To estimat
e the association bet
w
een
dimensions of boar
d infrastruc
tur
e and
dynamics t
o their hospital financial out
-comes
. I
n addition, the ex
tent t
o which
financial per
for
mance was influenced
by the boar
d ac
tivities and infrastruc
tur
e
was explor
ed
75% of hospitals
23.
Bahram Nabilou (2009–2014)
Iran Quantit y, cr oss-sec tional D et er
mine the t
otal fac
tor pr
oduc
tivit
y
and its components o
ver the per
iod
under the study
.
17 hospital
24.
Ner
min Ozgulbas (2004)
Tu rk ey Quantitativ e Pr
esents an application of the data min
-ing method t
o det
er
mine the financial
pr
ofiles
O
f the public hospitals
645 public hospitals
25.
John E. S
chneider (1997–2004)
USA
Focuses on one impor
tant economic
question: does the pr
esence of specialt
y
hospitals in a mar
ket aff
ec
t general
hospitals
’ financial per
for
mance?
26.
Kr
istin L. R
eit
er (1999 and 2006)
Canada Quantit y, cr oss-sec tional 92 hospital 27. Jeffr
ey A. Alexander (2006)
USA
Quantit
y
The objec
tiv
e of this study was t
o examine
the association bet
w
een the scope and
int
ensit
y of Qualit
y impr
ov
ement (
QI)
implementation in hospitals and or
gani -zational per for mance 1784 communit y hospitals 28. Hamed R ahimi (2017) Iran M ix ed method Or ganiz
e suitable k
ey per for mance indica -tors f or hospitals ’ per for mance e valuation
based on the balanced scor
ecar d 17 exper t panel 29. G
oshtasebi, A (2005–2006)
Iran
Cr
oss-sec
tional
The P
abon Lasso model was applied t
o
assess the per
for
mance of six Stat
e-run
hospitals
6 hospital
30.
Jack Needleman, Ellen
T. Kur tzman, K en -neth W . K iz er -Re vie w Re vie ws eff or
ts and issues in
volv
ed in
identifying a set of nursing-sensitiv
e per for mance measur es -31. Car
men Silvia G
abr
iel (2009 t
o Januar y 2010) Sao P aulo , Brazil Quantitativ e
To identify per
for
mance indicat
ors
adopt
ed b
y the Nursing S
er
vice of a pub
-lic hospital and t
o analyz
e the opinions
of the nurses r
egar
ding the use of these
indicat
ors t
o e
valuat
e the qualit
y of the
nursing car
Table
4
(c
on
tinued)
First author (y
ear) Coun tr y Study desig n A im of study Setting 32.
Thomas N. Chir
ik os (1982–1993) USA Quantitativ e To compar
e the r
esults of scor
ing hospital
efficienc
y b
y means of t
w o ne w t ypes of fr ontier models
, Data En
velopment
Analysis (DEA) and st
ochastic fr ontier reg ression (SFR) 186 hospital 33. M ahmoud K ey vanara (2013) Iran Cr oss-sec tional
Suggesting a ne
w paradig
m in hospital
go
ver
nance
, the aim of this study was
to measur
e the social r
esponsibilit
y in
hospitals
21 hospital
34.
Raana Gholamzadeh N
ikjoo (2010)
Iran
Quantitativ
e-qualitativ
e study Lit
eratur
e
re
vie
w & AHP
The aim of the pr
esent study is t
o identify
and t
o selec
t k
ey hospitals per
for mance indicat ors . 8 exper t panel 35. Vivienne M cLaughlin (2005) OECD countr ies Qualitativ
e and quantitativ
e struc tur ed re vie wand panel Qualit y I ndicat or P rojec
t, which aimed at
de
veloping an initial set of patient saf
et y indicat ors 36. John o vr et v eit (2001) Nor dic countr ies W or k shop -lit eratur e r evie w Pr
ovide an o
ver
vie
w f
or non-specialist
of the diff
er
ent qualit
y e
valuation and
indicat
or scheme f
or inspec tion and impr ov ement 37. Phil H ider (2001–2009) Ne w Z ealand Quantit y The r
isk adjustment account
ed f or age , gender , ethnicit y, ruralit y, depr ivation and comor
bidities and was under
tak
en
with
SAS
20 sof
twar e 91 hospital 38. Far had L otfi (2007–2011) Iran Quantit y Cr oss-sec tional
To obtain an o
ver
vie
w of hospitals
’ per
-for
mance status b
y applying
, hospital
per
for
mance ratios
, Data En
velopment
Analysis (DEA), st
ochastic fr
ontier analysis
(SF
A), P
abon lasso t
o compar e similar ities and diff er ences bet w
een these methods
and suggest the most compr
ehensiv
e
and prac
tical method of appraisal f
or
managers and polic
y mak ers . B y W ind
-eap 2.1 sof
twar e 16 hospital 39. Conf er ence (2014) M inistr
y of health
& HIMSS M
iddle East 40. M ohamed K halifa (2014) Saudi A rabia Qualitativ e D ecided t o de
velop and utiliz
e a g
roup of strat eg ic k pis t o monit or , measur e and impr ov
e the per
for
mance of the hospital
including diff er ent depar tments and ser vices All pr of
essionals who belong t
o this
gr
oup of ex
ecutiv
e and leading
func
Table
4
(c
on
tinued)
First author (y
ear) Coun tr y Study desig n A im of study Setting 41.
Peivand Bastani (2008)
Iran
Quantit
y cr
oss-sec
tional
This study was desig
ned t
o pr
esent and
compar
e I
ranian hospitals` per
for
mance
applying ratio analysis t
echnique
.
139 hospital
42.
Bar
liba loan (2008)
Romania
Quantitativ
e cr
oss-sec
tional
Focus on a specific stage of the r
esear
ch,
namely
: t
esting the manager
ial r
ele
vance
of k
pis
, as a main element f
or validating
applicabilit
y of the suggest
ed model 5 hospital 43. Repor t C anadian institut e f
or health inf
or -mation (2013) Canada Repor t To inf or
m the de
velopment of the hospital
per for mance frame w or k – 44. Da
vid R. (2001)
–
–
Br
iefly summar
iz
e the hist
or
y of per
for -mance measur es f or hospitals , health plans
, and health car
e syst ems – 45. Olimpio J . (1996) Sao P aolo , Brazil 46. Jér ém y V eillar d (2003) Spain M ix ed Tw elv e r
esponses came fr
om the 11
countr
ies
. One questionnair
e was sent t
o
each one of the countr
ies . Sur ve ys w er e
filled in either b
y individuals or b
y lar ge multi-pr of essional w or king g roups 200 hospital 47.
Beth Engel Br
echt (2000)
–
–
It pr
ovides a frame
w
or
k t
owar
ds a w
ell-managed Distr ic t Hospital – 48. Jenn y Har gr ea ves (2008–2009) A ustralia 49. Kha yat M
oghadam Saeed (2014)
Iran D escr iptiv e-analyz ed Albr
echt model was used because it
was able t
o measur
e or
ganizational
int
elligence and f
or the per
for
mance
measur
![Fig. 1 Initial themes reflecting the dimensions of public hospital performance evaluation, derived from literature [39]](https://thumb-us.123doks.com/thumbv2/123dok_us/583528.1553753/4.595.58.541.537.708/initial-reflecting-dimensions-hospital-performance-evaluation-derived-literature.webp)