[Aldulaimy * et al., 5(12): December, 2018]
ISSN: 2349-5197
Impact Factor: 3.765
I
NTERNATIONAL
J
OURNAL OF
R
ESEARCH
S
CIENCE &
M
ANAGEMENT
STUDY THE EFFECT OF DIFFERENT DIELECTRIC ON MATERIAL REMOVAL
RATE, ELECTRODE WEAR RATE AND SURFACE ROUGHNESS IN EDM
PROCESS
S.H.
Aghdeab
1& H.L.
Aldulaimy
11
Production Engineering and Metallurgy Department, University of Technology
,
Baghdad, Iraq.
DOI: 10.5281/zenodo.2528760
Abstract
Electrical Discharge Machining (EDM) is one of the earliest non -traditional machining methods for making high precision and difficult shaped part. EDM process is based on thermo-electric energy between the workpiece and an electrode. Dielectrics and electrical parameters were considered as the main factors for EDM performance. In this paper, the influence of current (A) and pulse-on-time (μs) were evaluated for performance measures using petroleum and vegetable oil as dielectric. A comparison was performed for both dielectrics in terms of material removal rate (MRR), electrode wear rate (EWR) and surface roughness (SR) of stainless steel 316L alloy with copper electrode. The results show that the performance of the newly suggested vegetable oil is better than petroleum, for material removal rate, electrode wear and surface roughness. Results indicated that current is the most important influencing parameter for MRR, EWR and SR. Under the effect of increased current on vegetable oil and petroleum, there was higher MRR and lower EWR, SR; however, same effect has been observed with higher values of pulse-on-time. The MRR in petroleum was 87% lower than that in vegetable oil, whereas the EWR was approximately 58% higher than that in vegetable oil. In addition petroleum produced 49% higher SR than vegetable oil.
Keywords: Electrical Discharge Machining, Material Removal Rate, Electrode Wear Rate, Surface Roughness, pulse-on-time.
Introduction
Electrical Discharge Machining (EDM) is a widespread mechanism used in industry for high-precision machining of all types of conductive materials like metallic alloys, or even some ceramic materials, of any hardness. It is also used for finishing parts in aerospace, automotive and medical industry in addition to variety of applications [1]. EDM is a thermo-electric process that erodes workpiece material by a series of discrete electrical sparks between the workpiece and electrode immersed in or flushed by a dielectric fluid. The thermal energy of the spark leads to intense heat generations on workpiece causing melting and vaporizing of workpiece material. Each of the tool and workpiece materials should be electrically conductive. In EDM, dielectric fluid undergoes partial ionization due to rapid rise and fall of the intense temperature and pressure during short spark cycles [2,3]. Experimental investigations have been performed of the proposed oil with vegetable oil to analyze material removal rate, electrode wear rate and surface roughness.
Literature review
Following are the researchers, who have worked on the use of different dielectric fluids and also their effects in EDM characteristics.
Fabio N. Leão and lanR.pashby (2004) [4] studied the importance of the dielectric fluids, which affects factors such as health, quality, productivity and environment. Researchers have studied the feasibility of adding organic compounds to deionized water and obtained a performance of higher MRR and more environmentally than that of oil-based fluids.
[Aldulaimy * et al., 5(12): December, 2018]
ISSN: 2349-5197
Impact Factor: 3.765
I
NTERNATIONAL
J
OURNAL OF
R
ESEARCH
S
CIENCE &
M
ANAGEMENT
G. Kibria et al. (2010) [5] studied the operating properties of Titanium alloy EDM in kerosene, boron carbide powder-suspended kerosene and distilled water as dielectrics. The study reverted that the MRR in compound dielectric is 60% higher than that in distilled water.Yonghong Liu et al. (2014) [6] investigated the material removal properties of the EDM process using five dielectric such as air, oxygen, deionized water, kerosene and water-in-oil. The results showed that the removal efficiency was higher in liquid dielectrics than that in gaseous dielectrics.
Xiangzhi Wang et al. (2014) [7] described the influence of dielectric characteristics, namely, electrical conductivity, oxidability and viscosity on the EDM of titanium alloy. The results show that the compound dielectric solves the problems of low MRR In kerosene and poor surface quality in distilled water.
MisbahNiamat et al. (2017) [8] investigated the effects of parameterson material removal rate (mm3/min), electrode wear rate (mm3/min), and micro-structure were evaluated- comparisons were made for the achievement of dielectrics (distilled water and kerosene). The results show that the kerosene as dielectric has higher MRR and low EWR than distilled water.
Sadagapan and mauliprasanth (2017) [9] made a study on biodiesel, transformer oil and kerosene as dielectric and investigated their influence on MRR, EWR and surface finish of aluminum alloy with a copper electrode. The results show that the biodiesel as dielectric in EDM gives high MRR, less EWR and better surface finish when compared to the widely used kerosene and transformer oil.
Experimentation
3.1 Materials and Electrode
For this study, the workpiece material selected is stainless steel 316L sheet. All specimens were cut of equal size (40×30×2)mm. The mechanical properties of stainless steel 316L sheet used in this work are shown in Table 1.
Table1: The mechanical properties of 316L stainless steel 316L.
Mechanical Properties Values Tensile Strength (MPa) 485
Elongation (%) 49
Yield strength (MPa) 519
Hardness (RB) 84
The electrode material used is copper. These electrodes are rectangle in shape with (40×90×9) mm and mechanical properties of electrode material are shown in Table 2 [10].
Table2: Mechanical properties of the copper electrode [10].
Mechanical Properties Description Tensile Strength (MPa) 620
Elongation (%) 7
Yield strength (MPa) 579
Hardness Brinell 80
3.2 Dielectrics
[Aldulaimy * et al., 5(12): December, 2018]
ISSN: 2349-5197
Impact Factor: 3.765
I
NTERNATIONAL
J
OURNAL OF
R
ESEARCH
S
CIENCE &
M
ANAGEMENT
Table3: Properties of petroleum and vegetable oil
Dielectric Constant Flash point (_C) Specific heat (KJ=kg.K) Thermal conductivity (W=m.K) Viscosity at (40_C) Density
at 15 C (g/cm3) Dielectric No. 4.7 40 2.01 0.13 2.71 0.801 Petroleum 1 2.53 158 2.17 0.16 28.7 0.916 Vegetable oil 2
3.3 Design of Experiment
An experimental study was carried out to find the influence of different process variables of input factors and their interactions, and constant factors for the dielectrics were chosen for the experiment. Since this is an initiation of a trial experiment using vegetable oil as dielectric, only limited parameters are used. Also, machine conditions should support the experiments and therefore the basic conditions of input factors were selected. The machining conditions for stainless steel 316L and the number of levels of parameters that were selected are given in Table 4.
Table4:Parameter with selected level
No. Parameter Level 1 Level 2 Level 3 No. Parameter Lev el 1 1 Current(A) 10 24 50 1 Current(A) 10 2 Pulse-on-time(µs) 50 100 200 2 Pulse-on-time(µs) 50
Experimental procedure
Based on the range of values that can be used for testing, factorial-based designs of experiments were performed using commercial software with an L9 orthogonal array (OA) for two factors and three levels. In the experiment 18 specimens were machined of equal size (39×30×2) mm by EDM process under various cutting condition and for both dielectric. Nine experimental runs were performed individually for petroleum and vegetable oil.Table 5 indicates the effect of parameters current and pulse-on time on MRR, EWR and SR, where it was determined for petroleum and vegetable oil separately. Furthermore, comparison of both dielectrics was performed against MRR, EWR and SR.
Table5: Experimental design with observed MRR, EWR and SR values for petroleum and vegetable oil.
Run Current (A)
Pon (µs)
MRR (mm3/min) EWR (%) SR (µm)
Petroleum Vegetable oil
Petroleum Vegetable oil
Petroleum Vegetable oil
1 10 50 1.51553 12.0067 0.00805 0.00339 6.3 3.2
2 10 100 2.49632 15.8798 0.00563 0.00247 7.1 3.7
3 10 200 5.79057 19.5581 0.00372 0.01344 7.8 4.2
4 24 50 12.4572 21.0426 0.06245 0.05224 9.5 5.3
5 24 100 9.70136 32.9239 0.02739 0.04870 9.9 5.5
6 24 200 10.8385 41.2251 0.02595 0.04654 10.4 5.6
7 50 50 18.1708 41.6234 0.06890 0.05410 11.3 6.9
8 50 100 27.5030 81.1088 0.04536 0.04952 12.6 7.2
[Aldulaimy * et al., 5(12): December, 2018]
ISSN: 2349-5197
Impact Factor: 3.765
I
NTERNATIONAL
J
OURNAL OF
R
ESEARCH
S
CIENCE &
M
ANAGEMENT
Following procedure was adopted to calculate the performance measure (MRR and EWR). Electrode and workpiece were weighed using weight balance before and after performing each experimental runs. Stopwatch was used to note the machining time for runs. MRR was calculated using equation (1) [11].MRR=𝒘𝒆𝒊𝒈𝒉𝒕 𝒐𝒇 𝒎𝒂𝒕𝒆𝒓𝒊𝒂𝒍 𝒓𝒆𝒎𝒐𝒗𝒆𝒅 𝒇𝒓𝒐𝒎 𝒘𝒐𝒓𝒌𝒑𝒊𝒆𝒄𝒆
𝒎𝒂𝒄𝒉𝒊𝒏𝒊𝒏𝒈 𝒕𝒊𝒎𝒆 =
𝑾𝒃−𝑾𝒂
𝝆×𝑻𝒎 (1)
Where
MRR= Material removal rate (mm3/min) Wb= Weight of workpiece before machining (g) Wa= Weight of workpiece after machining (g) ρ= Density of workpiece (g/mm3)
Tm= Machining time (minutes)
EWR was calculated using following formula shown in equation (2) [11].
EWR= 𝒘𝒆𝒊𝒈𝒉𝒕𝒐𝒇𝒕𝒉𝒆𝒕𝒐𝒐𝒍𝒎𝒂𝒕𝒆𝒓𝒊𝒂𝒍𝒓𝒆𝒎𝒐𝒗𝒆𝒅
𝑴𝒂𝒄𝒉𝒊𝒏𝒊𝒏𝒈𝒕𝒊𝒎𝒆 =
𝑬𝒃−𝑬𝒂
𝝆×𝑻𝒎 (2)
Where
Eb= the weights of electrodes before machining (g) Ea= the weights of electrodes after machining (g) ρ= Density of electrode (g/mm3)
The surface roughness (SR) of each sample was measured by using type Pocket surface, the probe scans the surface, compare between peaks and valise to indicate the SR. The probe movement during the trace was digitally displayed and was taken at three different regions. The mean of these three measurements were taken as the final value for the surface finish.
Results and discussion
Performance analysis is the main objective, that is, to study and analyze the relative performance of petroleum vegetable oil. Influence of control parameters such as current and pulse-on-time on MRR, EWR and SR has been stated as below. MRR is termed as machining time per unit volume of material removed, which is related to the production cost. Higher MRR is desirable for achieving more economical production. EWR is related to the amount of erosion electrode material during the experiment. Hence, lower EWR is desirable to justify the economic feasibility of the suggested vegetable oil.
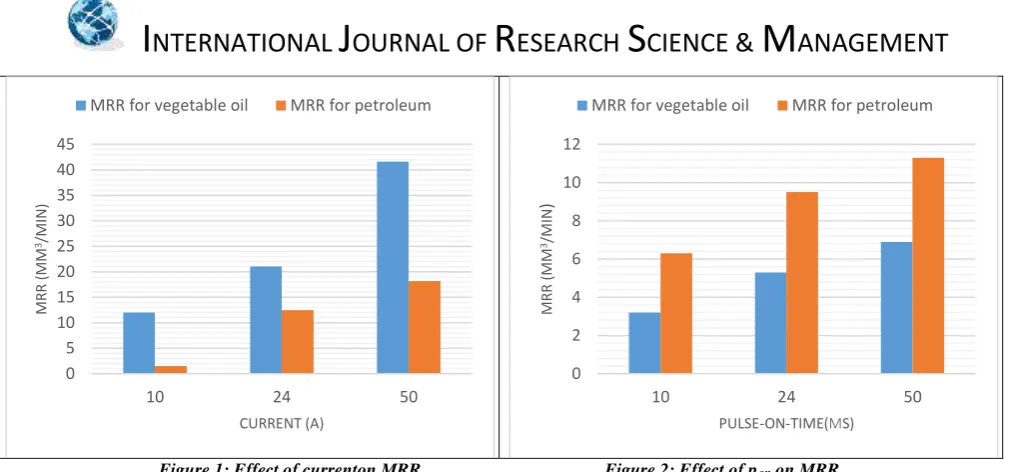
Figure 1 shows the performance of MRR at the various levels of current. Increase in the MRR was noted for the two fluids with increase in current values, more number of electrons strike the workpiece and raise the surface temperature. Therefore, extra volume of work material is eroded. While, higher current density increases the pressure and temperature inside the plasma channel, which finally increases the erosion of the work material. For the same current values, vegetable oil resulted in the highest MRR than petroleum.
[Aldulaimy * et al., 5(12): December, 2018]
ISSN: 2349-5197
Impact Factor: 3.765
I
NTERNATIONAL
J
OURNAL OF
R
ESEARCH
S
CIENCE &
M
ANAGEMENT
Figure 1: Effect of currenton MRR. Figure 2: Effect of pon on MRR.
Figure 3 and Figure 4 represents the surface plot of MRR for petroleum and vegetable oil, respectively. It demonstrates that MRR increases with an increase in current (10 to 50) A. Similarly, Pon exhibited same influence, MRR is increased with increases of P from (50 to 200) µs.
Figure 3: Surface plot of MRR for petroleum. Figure 4: Surface plot of MRR for vegetable oil.
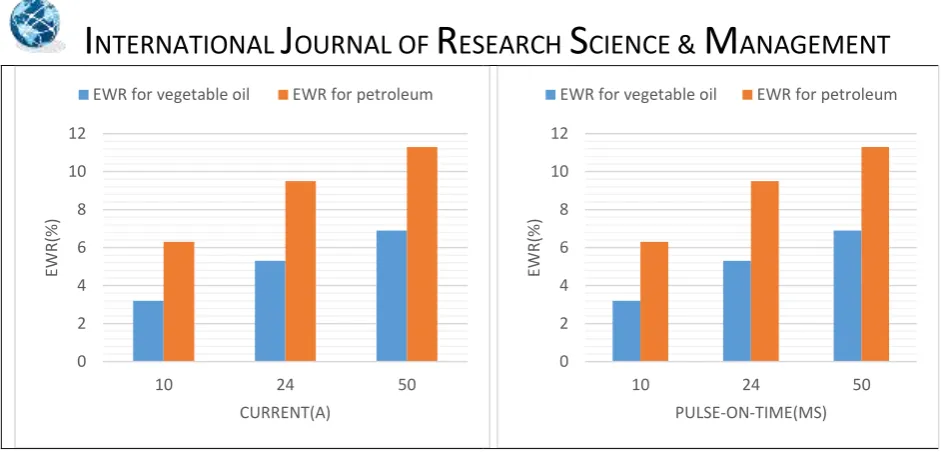
Figure 5 represents the comparative performance of EWR under the effect of current. It has been seen observed that EWR increases with increase in current. This behavior is attributed to striking of more number of positive ions on electrode surface, which eventually in a higher thermal state of electrodes contributed to erosion of low melting point electrode material. Average EWR for petroleum is higher than vegetable oil.
Figure 6 shows the influence of pulse-on-time on EWR. It can be seen that with an increase in Pon value, EWR decreases. However, with further increase in Pon, wider discharge channel weakens the discharge energy density and plasma flushing efficiency to reduce EWR. It has been noticed that the EWR is higher for petroleum compared to vegetable oil. It is due to the reason that vegetable oil have less number of carbon atoms than petroleum.
0 5 10 15 20 25 30 35 40 45
10 24 50
M
R
R
(
M
M
3/MIN
)
CURRENT (A)
MRR for vegetable oil MRR for petroleum
0 2 4 6 8 10 12
10 24 50
MR
R
(
M
M
3/MIN
)
PULSE-ON-TIME(ΜS)
[Aldulaimy * et al., 5(12): December, 2018]
ISSN: 2349-5197
Impact Factor: 3.765
I
NTERNATIONAL
J
OURNAL OF
R
ESEARCH
S
CIENCE &
M
ANAGEMENT
Figure 5: Effect of currenton EWR. Figure 6: Effect of Pon on EWR.
The surface plot of EWR for petroleum and vegetable oil, it can be identified that EWR increases with increasing current while a varying effect was observed with increase in Pon value. Surface plot of EWR, for petroleum and vegetable oil, are shown in Figure 7 and Figure.8, respectively.
Figure 7: Surface plot of EWR for petroleum. Figure 8: Surface plot of EWR for vegetable oil.
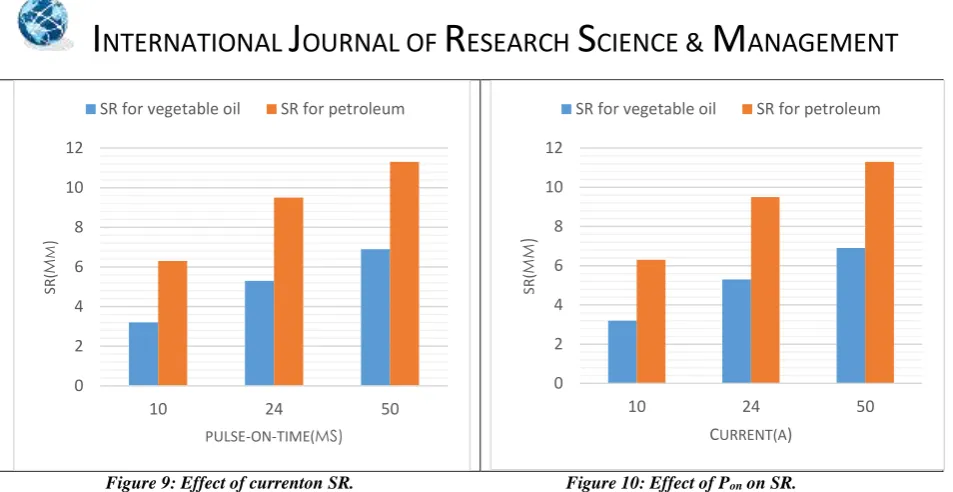
Figure 9 shows the relative performance for surface roughness (SR) of various current values for both petroleum and vegetable oil. It can be seen that higher SR was obtained at high current. The vegetable oil experiments resulted in lower SR values and shinier surfaces compared to the petroleum experiment. Increasing the current increased the discharge energy and the impulsive force, removing more melted material and generating deeper and larger discharge carters thus increasing the roughness of the surface. The surface roughness in the vegetable oil was lower than that in petroleum.
Figure 10 indicates the influence of Pon on surface roughness. It can be seen that material dissolution from the workpiece surface was observed to be reduced when the Pon was decreased. The number of pits along the surface was significantly reduced for petroleum and vegetable oil. The surface roughness in the petroleum was higher than that in vegetable oil.
0 2 4 6 8 10 12
10 24 50
EW
R
(%
)
CURRENT(A)
EWR for vegetable oil EWR for petroleum
0 2 4 6 8 10 12
10 24 50
EW
R
(%
)
PULSE-ON-TIME(ΜS)
[Aldulaimy * et al., 5(12): December, 2018]
ISSN: 2349-5197
Impact Factor: 3.765
I
NTERNATIONAL
J
OURNAL OF
R
ESEARCH
S
CIENCE &
M
ANAGEMENT
Figure 9: Effect of currenton SR. Figure 10: Effect of Pon on SR.
Figure 11 and Figure 12 represents the surface plot of SR for petroleum and vegetable oil, respectively. At higher current, more cracks are imminent that make the surface roughness. Similarly, Pon exhibited same effect, SR is increased with increasing Pon.
Figure11: Surface plot of SR for petroleum. Figure 12: Surface plot of SR for vegetable oil.
Conclusion
Vegetable oil in this study resulted in higher MRR for EDM than petroleum as dielectric. Vegetable oil removed more material volume per unit time. At higher values of current and pulse-on-time, maximum MRR is obtained. Vegetable oil showed lower EWR than petroleum due to the reason that vegetable oil have less number of carbon atoms. Higher pulse-on-time exhibited lower EWR. However, reverse effect has been observed with higher value of current. Surface roughness is obtained with petroleum dielectric in comparison with vegetable oil as illustrated, at higher value of current and pulse-on-time maximum surface roughness.
Under the effect of increased current, vegetable oil showed higher MRR and lower EWR, SR is better than petroleum. However, same effect has been observed with higher values of pulse-on-time.
0 2 4 6 8 10 12
10 24 50
SR
(
Μ
M
)
PULSE-ON-TIME(ΜS) SR for vegetable oil SR for petroleum
0 2 4 6 8 10 12
10 24 50
SR
(
ΜM
)
CURRENT(A)
[Aldulaimy * et al., 5(12): December, 2018]
ISSN: 2349-5197
Impact Factor: 3.765
I
NTERNATIONAL
J
OURNAL OF
R
ESEARCH
S
CIENCE &
M
ANAGEMENT
References
[1] D. Nanu, A. Nanu, “Perspectives of the dimensional processing through electric erosion processing”. Nonconventional Technologies, vol. 3, pp. 61-64, 2008.
[2] M. Kunieda, B. Lauwers and K.P. Rajurkar, Schumacher BM (2005)Advancing EDM through fundamental insight into the process.CIRP Annals-Manufacturing Technology 54(2):64–87.
[3] S.H. Aghdeab and L.A. Mohammed, “Prediction on material removal rate for steel 304 in hole EDM using NN modeling”. Thesis submitted to Department of Production Engineering and Metallurgy, University of Technology, 2014.
[4] F.N. Leao, I.R. Pashby, “A review on the use of environmentally-friendly dielectric fluids in electrical discharge machining”. Journal of Materials Processing Technology, vol. 149, pp. 341-346, 2004. [5] G. Kibria, B.R. Sarkar, B.B. Pradhan, B. hattacharyya (2010) Comparative study of different dielectrics
for micro-EDM perfor-mance during mircohole machining of Ti-6A1-4 V alloy. Int J AdvmanufTechnol 48(5-8):557-570 .y 149.1-3 (2004): 341-346.
[6] Y. liu, et al. "Investigation on the influence of the dielectrics on the material removal characteristics of EDM." Journal of Materials Processing Technology,vol. 214.5, pp. 1052-1061 2014.
[7] Wang, Xiangzhi, et al. "Research on the influence of dielectric characteristics on the EDM of titanium alloy." The International Journal of Advanced Manufacturing Technology, vol. 72.5, no. 8 , pp. 979-987 , 2014.
[8] M. Niamat, S. Sarfraz, H. Aziz, M. Jahanzaib, E. Shehab, W. Ahmad and S. Hussain, “Effect of Different Dielectrics on Material Removal Rate, Electrode Wear Rate and Microstructures in EDM”. Procedia CIRP, 60, 2-7,2017.
[9] P. Sadagopan and B. Mouliprasanth. "Investigation on the influence of different types of dielectrics in electrical discharge machining." The International Journal of Advanced Manufacturing Technology, vol. 92.1, no.4 , pp. 277-291, 2017.
[10]J. R. Davis, "Handbook: Copper and Copper Alloys", pp.117, 2001.