N. A. J. Hosni1 M. A. Lajis2 , and M. R. Idris3
Modelling and Optimization of Chromium Powder Mixed EDM Parameter
Effect Over the Surface Characteristics by Response Surface Methodology
Approach
Nor Ain binti Jamil Hosni, Mohd Amri bin Lajis and Muhammad Ridzuan bin Idris
Received: 18 April 2018 Accepted: 18 May 2018 Published: 30 June 2018 Publisher: Deer Hill Publications © 2018 The Author(s)
Creative Commons: CC BY 4.0
ABSTRACT
In this paper, an optimization of chromium powder mixed parameters effect, i.e. discharge current, pulse on time and Cr powder concentration of AISI D2 steels in Powder Mixed EDM (PMEDM) has been made. RSM has been employed to plan and analyzed the experiment. Central composite design (CCD) was chosen as the RSM design that is useful for investigating the quadratic effects. The version 8.0 of the Design Expert software was used to develop the experimental plan for RSM. A mathematical model in the form of the multiple regression equation for second order response surface with the best fittings was developed. The results identify that discharge current and pulse on time the most important parameters effect to minimize recast layer. With the topmost desirability solution, the suggested optimum parameter of discharge current is 20.12 A, pulse-on time 50.14 µs and 3.96 g/L powder concentration to minimize recast layer.
Keywords: PMEDM, Process optimization, Response surface methodology, Recast layer
1 INTRODUCTION
PMEDM is an incredible inventive technique which is utilized to machine the material with high MRR and surface complete and furthermore adjusts the surface properties of workpiece as per the request of properties. From the work revealed above, it is presumed that a less number of the work is done till these days on surface integrity. Tan and Yeo (2013) [3] considers the surface uprightness for nano powder-blended dielectric in micro-scale EDM and demonstrates that the nearness of powder particles causes a simultaneous bigger plasma direct extension and decrease in division of warmth transition to the workpiece. In this work, recast layers delivered utilizing different powder concentrations. Pecas et al. (2008) [4] exhibited an examination work that expects to think about the improvement in the polishing performance of conventional EDM when used with a powder- mixed into dielectric. The examination was completed by varying the silicon powder concentrations and flushing flow rate over a set of different processing areas and the impacts in the final surface were assessed. The outcomes demonstrate the positive impact of the silicon powder in the reduction of crater dimensions, white-layer thickness and surface roughness. Wu et al. (2005) [5] investigated the improvement of surface finish on SKD61 steel using EDM with three different dielectrics pure kerosene; Aluminum powder added kerosene and kerosene with Aluminum powder and surfactant added dielectric. It was concluded that insulation is lowered and the gap distance between electrodes is increased with Al powder added dielectric and the surfactant added in dielectric. The thin optimized recast layer can be accomplished when the dielectric is mixed with both Aluminum powder and surfactant due to well dispersed Aluminum powder and uniform distribution of discharge energy during the EDM process.
This paper expects to recognize the elements which impact the recast layer. This will permit the surface properties of EDM'd materials to be all the more unequivocally controlled and more unsurprising. Furthermore, these connections will be evaluated utilizing numerical demonstrating.
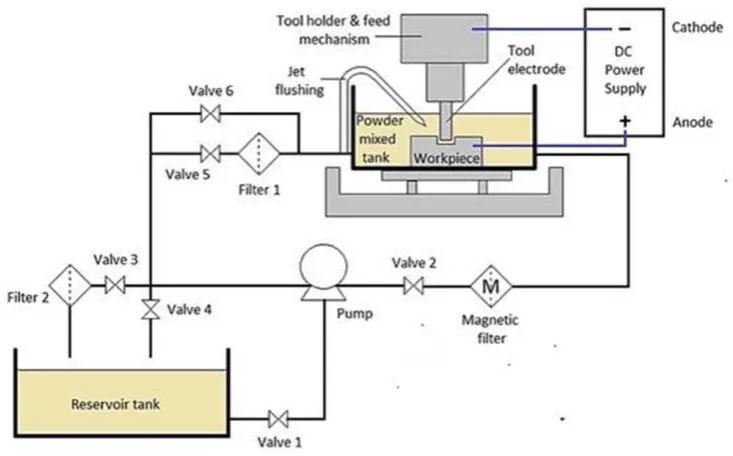
2 METHODLOGY
Figure 2: Chromium powder was suspended in the dielectric fluid
Figure 3: Overview research procedures
Table 1: Chemical composition of AISI D2
Table 2: PMEDM machining parameter.
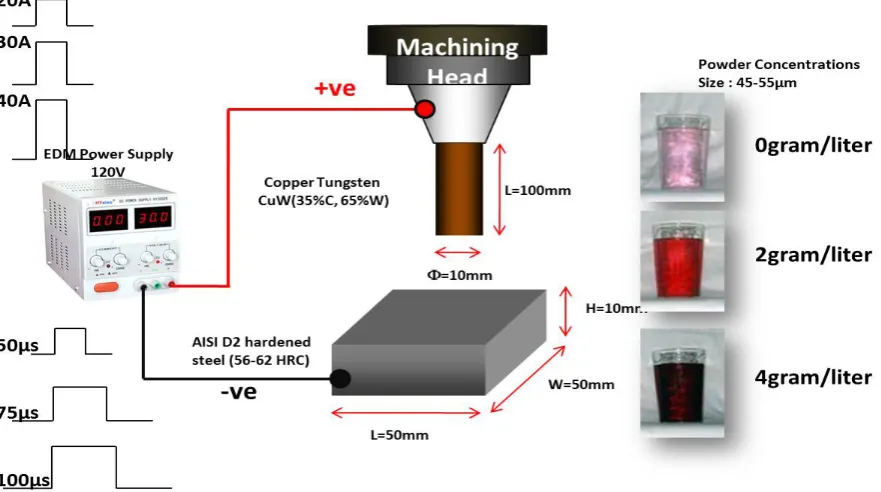
Working Parameters Description
Workpiece AISI D2
Electrode CuW (Ø 10mm)
Dielectric Kerosene and Cr powder
Cr powder size 45-55µm
Concentration, C 0, 2, 4g/l
Polarity, P Reverse Polarity
Peak Current, Ip 20, 30, 40A
Pulse-on, Pon 50, 75, 100µs
Duty Cycle 80%
Voltage 120V
Depth of Cut 3mm
Flushing rate 3.5lmm3/hour
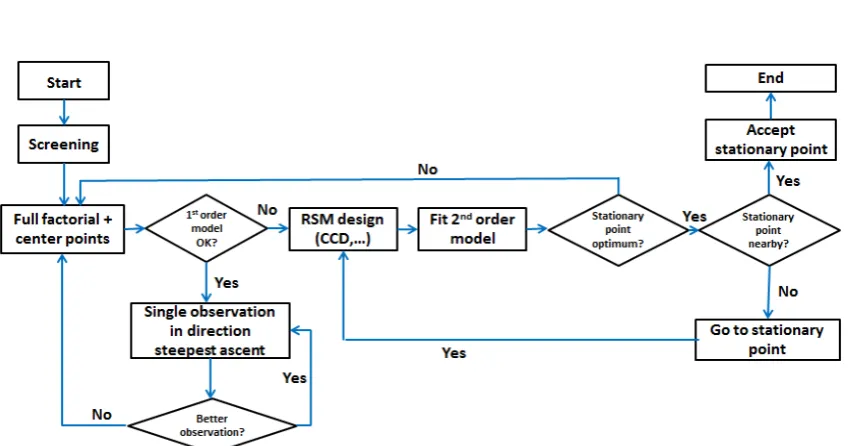
Figure 4: Basic optimization scheme of response surface methodology
3 RESPONSE SURFACE METHODOLOGY
Response surface methodology (RSM) utilizing a sequence of designing experiments was employed to obtain optimal responses. RSM is a method of optimization using statistical and mathematic techniques useful for developing, improving and optimization process [6]. RSM also quantifies relationships among one or more measured responses and the vital input factors [7] and used to find optimal operating conditions within a system. A linear regression model is used to decide whether a movement of the centre point or a reduction of the search space should be performed next. Figure 4 below shows a basic optimization scheme.
3.1 Machining Setup and Experimental Design
Table 3: PMEDM parameters effect and levels for CCD
Parameters Factor
symbol Unit Level
-1 0 +1
Discharge current, Ip A A 20 30 40
Pulse on time, Ton B µs 50 75 100
Powder concentration, Cp C g/L 0 2 4
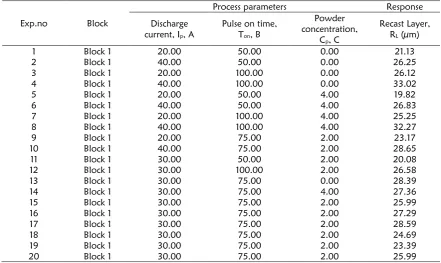
Table 4: Design layout and experimental response for the PMEDM
Exp.no Block
Process parameters Response Discharge
current, Ip, A
Pulse on time, Ton, B
Powder concentration,
Cp, C
Recast Layer, RL (µm)
1 Block 1 20.00 50.00 0.00 21.13 2 Block 1 40.00 50.00 0.00 26.25 3 Block 1 20.00 100.00 0.00 26.12 4 Block 1 40.00 100.00 0.00 33.02 5 Block 1 20.00 50.00 4.00 19.82 6 Block 1 40.00 50.00 4.00 26.83 7 Block 1 20.00 100.00 4.00 25.25 8 Block 1 40.00 100.00 4.00 32.27 9 Block 1 20.00 75.00 2.00 23.17 10 Block 1 40.00 75.00 2.00 28.65 11 Block 1 30.00 50.00 2.00 20.08 12 Block 1 30.00 100.00 2.00 26.58 13 Block 1 30.00 75.00 0.00 28.39 14 Block 1 30.00 75.00 4.00 27.36 15 Block 1 30.00 75.00 2.00 25.99 16 Block 1 30.00 75.00 2.00 27.29 17 Block 1 30.00 75.00 2.00 28.59 18 Block 1 30.00 75.00 2.00 24.69 19 Block 1 30.00 75.00 2.00 23.39 20 Block 1 30.00 75.00 2.00 25.99
4 RESULTS AND DISCUSSIONS
The layout of the design and results of the experiment for the PMEDM performance characteristics were tabulated in Table 4. For the data analysis, it is necessary to test the goodness of fit of the model. The model accuracy checking included test for significance on model coefficients, test of lack of fits, and tests of significance of regression model. Therefore, analysis of variance (ANOVA) is done towards response surface quadratic model for recast layer.
The estimations of “Prob. > F” in Table 5 for model is fewer than 0.05 which designates the significance of the model and it is desirable as it specifies that the terms in the model have a substantial influence on the response. In the same manner, the main effect of discharge current (A), pulse on time (B), the second-order effect of pulse on time (B2) and the second-order effect of powder concentration (C2) are significant model terms. Other model terms can
be said to be insignificant. These inconsequential model terms (not including those required to help hierarchy) can be evacuated and may bring about an enhanced model. The lack-of-fit can likewise be said to be irrelevant. This is attractive as we need a model that fits.
By choosing the retrogressive end methodology to naturally lessen the terms that are not huge, the subsequent ANOVA table for the diminished quadratic model for surface unpleasantness is appeared in Table 6. Results from Table 6 demonstrate that the model is as yet critical. Notwithstanding, the primary impact of discharge current (A), pulse on time (B), the second-order effect of pulse on time (B2) and the second-order effect of powder concentration
(C2) are the significant model terms. The main effect of powder concentration (C) was added to support hierarchy.
Table 5: ANOVA for recast layer (before eliminating)
Source Sum of
squares Degrees of freedom Mean square F-value Prob>F
Model 207.96 9 23.11 12.35 0.0003 Significant A 99.41 1 99.41 53.13 <0.0001
B 84.86 1 84.86 45.35 <0.0001
C 1.14 1 1.14 0.61 0.4527
AB 0.40 1 0.40 0.21 0.6535
AC 0.51 1 0.51 0.27 0.6147
BC 0.099 1 0.0996 0.053 0.8227
A2 0.35 1 0.35 0.19 0.6745
B2 13.59 1 13.59 7.26 0.0225
C2 14.82 1 14.82 7.92 0.0183
Residual 18.71 10 1.82
Lack of fit 1.81 5 1.87 0.11 0.9858 Not significant Pure error 16.90 5 0.36
Cor. Total 226.67 19 3.38
Standard
deviation = 1.37 R
2 = 0.9175
Mean = 26.04 R2
adjusted = 0.8919 Coefficient of
variation = 5.25 Predicted R2
= 0.5759
Predicted residual error of sum squares (PRESS)
= 39.64 Adequate
precision = 15.172
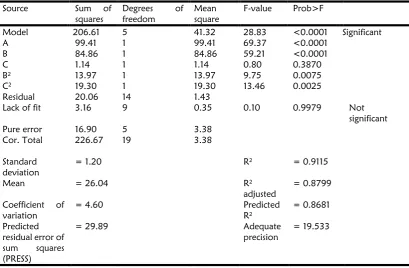
Table 6: ANOVA for recast layer (after elimination)
Source Sum of squares
Degrees of freedom
Mean square
F-value Prob>F
Model 206.61 5 41.32 28.83 <0.0001 Significant A 99.41 1 99.41 69.37 <0.0001
B 84.86 1 84.86 59.21 <0.0001
C 1.14 1 1.14 0.80 0.3870
B2 13.97 1 13.97 9.75 0.0075
C2 19.30 1 19.30 13.46 0.0025
Residual 20.06 14 1.43
Lack of fit 3.16 9 0.35 0.10 0.9979 Not significant Pure error 16.90 5 3.38
Cor. Total 226.67 19 3.38
Standard deviation
= 1.20 R2 = 0.9115
Mean = 26.04 R2
This is normal since it is notable that discharge current gives a critical effect on recast layer and lower discharge current can deliver the more slender recast (white) layer. Furthermore, the outcomes demonstrate that the pulse on time likewise is the one of the huge elements that can influence the recast layer. Fundamentally recast layer is framed when the current from the EDM procedure dissolves the material and the liquid material not flushed away by the dielectric. The period that release vitality liquefy and vaporized workpiece relies upon pulse on setting. The outcome demonstrates that expanding the pulse on will build the recast layer. This is most likely because of long pulse on causes the plasma channel to grow and this development causes less vitality thickness on the workpiece, which is lacking to liquefy and vaporize the workpiece material, which eventually brings about a thick white layer [9]. The lack-of-fit is still allegedly be inconsequential. The R2 value is exalted , close to 1, which is coveted . The forecasted
R2 is in rational agreement with the adjusted R2. The adjusted R2 value is particularly beneficial in comparing models
with varied number of terms. However, this comparison is done in the background while model reduction is progressing. Sufficient accuracy assesses predicted values range at the design points to the average prediction error. Ratios that are more than 4 signifies the sufficient discrimination of the model. Particularly, this study resulted in the value well above 4. After excluding the insignificant terms, the ultimate response equation for MRR is given as follows:
Recast layer = 25.86+3.15*A+2.91*B-0.34*C-2.09*B2+2.46*C2 (In coded terms) (1) Recast layer =-8.35+0.32Ip+0.62Ton, -2.63Cp-3.343E-003Ton2+0.614Cp2 (In actual factors) (2)
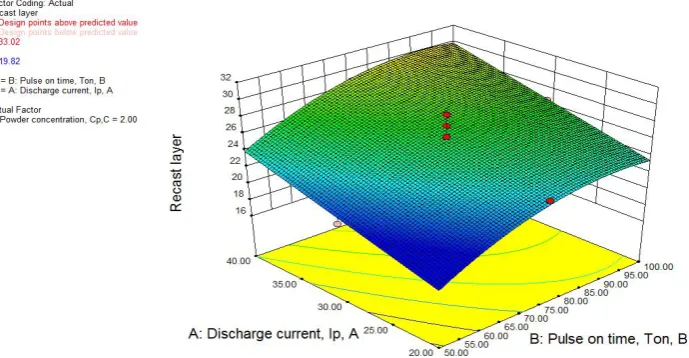
The 3D surface graphs for recast layer at different interaction process parameters are presented in Figure 5 and Figure 6. Both have curvilinear profile in accordance to the quadratic model fitted. It is clear from Figure 5 that at powder concentration of 2 g/L, the best recast layer is obtainable when the discharge current 20 A and pulse on time 50 µs. This is consistent with the fact that the discharge current and pulse on time term are significant. Also at lower discharge current and pulse on time, better surface roughness is obtainable. It is also obviously from Figure 5 that the recast layer increasing with ascending discharge current and pulse on time.
Figure 5: Three dimensional surface graph for recast layer between discharge current and pulse on time
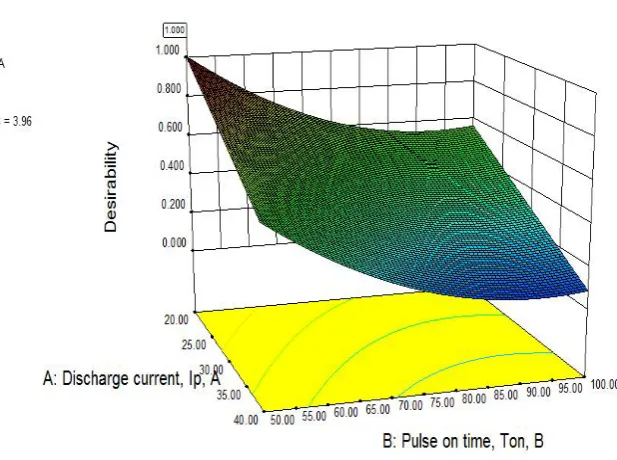
5 Optimization of Desirability
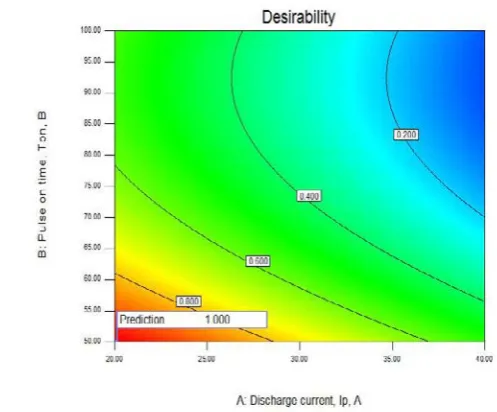
The greatest and utmost efficient parameters will be revealed in the optimization. The elucidation implied for aptness is indicated in Table 7. The topmost desirability solution number 1 ought to be selected as the desirability (99%) is extremely near to 100%. Optimization graph and contour plot for solution desirability is shown in Figure 7 and Figure 8, respectively.
Table 7: Solution for desirability
Figure 6: Three dimensional surface graph for recast layer between discharge current and powder concentration
Figure 8: Contours for solution desirability function
6 CONCLUSIONS
The outcomes of an experimental reconnaissance on the influence of discharge current, powder concentration and pulse on time on the recast layer while machining AISI D2 hardened steel within PMEDM was presented in this study. It was found that the discharge current and pulse on time are the most significant factor influencing the response variables studied through ANOVA tests. The reduced quadratic models obtained through RSM were relatively precise and usable in prediction concerning the constrains of the investigated factors.
ACKNOWLEDGEMENT
The authors would like to show their utmost gratitude towards the Ministry of Higher Education (MOHE), Malaysia, for subsidizing this research project via the Exploratory Research Grant Schemes (ERGS-Vote numbers 0886). Additional supports in terms of facilities were also provided by Universiti Tun Hussein Onn Malaysia (UTHM).
REFERENCES
1. Hosni, N.A.J. and M.A. Lajis, The influence of Span-20 surfactant and micro-/nano-Chromium (Cr) Powder Mixed Electrical Discharge Machining (PMEDM) on the surface characteristics of AISI D2 hardened steel. IOP Conference Series: Materials Science and Engineering, 2018. 342(1): p. 012095.
2. Lajis, M. and N. Hosni, The influences of various mixed dielectric fluids on the performance electrical discharge machining of AISI D2 hardened steel. Materialwissenschaft und Werkstofftechnik, 2018. 49(4): p. 413-419. 3. Tan, P. and S. Yeo, Simulation of surface integrity for nanopowder-mixed dielectric in micro electrical discharge
machining. Metallurgical and Materials Transactions B, 2013. 44(3): p. 711-721.
4. Peças, P. and E. Henriques, Effect of the powder concentration and dielectric flow in the surface morphology in electrical discharge machining with powder-mixed dielectric (PMD-EDM). The International Journal of Advanced Manufacturing Technology, 2008. 37(11-12): 1120-1132.
5. Wu, K.L., et al., Improvement of surface finish on SKD steel using electro-discharge machining with aluminum and surfactant added dielectric. International Journal of Machine Tools and Manufacture, 2005. 45(10): p. 1195-1201.
6. Montgomery, D.C., Design and analysis of experiments. 2008: John Wiley & Sons.
7. Myers, R.H., D.C. Montgomery, and C.M. Anderson-Cook, Response surface methodology: process and product optimization using designed experiments. 2016: John Wiley & Sons.