University of New Hampshire
University of New Hampshire Scholars' Repository
Physics Scholarship
Physics
2-2014
Quantifying hiss-driven energetic electron
precipitation: A detailed conjunction event analysis
W. Li
University of California - Los Angeles
B. Ni
University of California - Los Angeles
R. M. Thorne
University of California - Los Angeles
J. Bortnik
University of California - Los Angeles
Y. Nishimura
University of California - Los Angeles
See next page for additional authors
Follow this and additional works at:
https://scholars.unh.edu/physics_facpub
Part of the
Physics Commons
This Article is brought to you for free and open access by the Physics at University of New Hampshire Scholars' Repository. It has been accepted for inclusion in Physics Scholarship by an authorized administrator of University of New Hampshire Scholars' Repository. For more information, please [email protected].
Recommended Citation
Authors
W. Li, B. Ni, R. M. Thorne, J. Bortnik, Y. Nishimura, J. C. Green, C A. Kletzing, W. S. Kurth, G. B.
Hospodarsky, Harlan E. Spence, Geoffrey Reeves, J. B. Blake, Joseph F. Fennell, S. Claudepierre, and X. Gu
Quantifying hiss-driven energetic electron
precipitation: A detailed conjunction
event analysis
W. Li1, B. Ni1, R. M. Thorne1, J. Bortnik1, Y. Nishimura1, J. C. Green2, C. A. Kletzing3, W. S. Kurth3, G. B. Hospodarsky3, H. E. Spence4, G. D. Reeves5, J. B. Blake6, J. F. Fennell6, S. G. Claudepierre6, and X. Gu7
1
Department of Atmospheric and Oceanic Sciences, UCLA, Los Angeles, California, USA,2National Geophysical Data Center, National Oceanic and Atmospheric Administration, Boulder, Colorado, USA,3Department of Physics and Astronomy, University of Iowa, Iowa City, Iowa, USA,4Institute for the Study of Earth, Oceans, and Space, University of New Hampshire, Durham, New Hampshire, USA,5Space Science and Applications Group, Los Alamos National Laboratory, Los Alamos, New Mexico, USA,6The Aerospace Corporation, Los Angeles, California, USA,7Department of Space Physics, Wuhan University, Hubei, China
Abstract
We analyze a conjunction event between the Van Allen Probes and the low-altitude Polar Orbiting Environmental Satellite (POES) to quantify hiss-driven energetic electron precipitation. A physics-based technique based on quasi-linear diffusion theory is used to estimate the ratio of precipitated and trapped electronfluxes (R), which could be measured by the two-directional POES particle detectors, using wave and plasma parameters observed by the Van Allen Probes. The remarkable agreement between modeling and observations suggests that this technique is applicable for quantifying hiss-driven electron scattering near the bounce loss cone. More importantly,Rin the 100–300 keV energy channel measured by multiple POES satellites over a broadLmagnetic local time region can potentially provide the spatiotemporal evolution of global hiss wave intensity, which is essential in evaluating radiation belt electron dynamics, but cannot be obtained by in situ equatorial satellites alone.1. Introduction
Resonant electron interactions with plasmaspheric hiss play an important role in electron precipitation over a broad range of energies. Electron precipitation loss driven by plasmaspheric hiss is energy-dependent with longer lifetimes of 1–100 days for higher energy electrons (>~2 MeV) and shorter lifetimes less than a day for lower energy electrons (<~200 keV) [Meredith et al., 2007;Thorne et al., 2013a;Ni et al., 2013]. Hiss-driven relativistic electron precipitation loss is known to create the slot region between the inner and outer radiation belts [Lyons and Thorne, 1973;Abel and Thorne, 1998] and is also responsible for the decay of the“electron storage ring”between the inner and outer radiation belts, as recently observed by the Van Allen Probes [Baker et al., 2013;Thorne et al., 2013a].
Since plasmaspheric hiss plays an important role in the loss process of energetic electrons in the inner magnetosphere, it is critical to understand the global spatiotemporal evolution of hiss wave intensity during geomagnetic storms. However, in situ satellite measurements of hiss wave intensity in the equatorial magnetosphere are limited to certainLand magnetic local time (MLT) ranges. Recently, by taking advantage of the extensive coverage of multiple NOAA Polar Orbiting Environmental Satellites (POES),Li et al. [2013] adopted a physics-based technique to infer the chorus wave intensity from the low-altitude electron observations (30–100 keV). In the present paper, we apply this technique to a conjunction event between the Van Allen Probes near the equatorial plane and the NOAA 17 satellite at the conjugate low altitudes to quantitatively evaluate the effect of hiss-driven energetic electron scattering near the bounce loss cone.
2. Methodology
To quantify hiss-driven electron precipitation, we use quasi-linear diffusion theory [Kennel and Petschek, 1966] to treat the particle scattering due to resonant wave-particle interactions and the University of California, Los Angeles (UCLA) full diffusion code [Ni et al., 2008;Shprits and Ni, 2009] to calculate electron pitch angle diffusion coefficients.
LI ET AL. ©2014. American Geophysical Union. All Rights Reserved. 1085
PUBLICATIONS
Geophysical Research Letters
RESEARCH LETTER
10.1002/2013GL059132Key Points:
•Measured and calculated hiss Bw from POES electron measurements agree well
•Electron ratio measured by POES is able to estimate hiss wave intensity
•This technique can be used to provide global hiss wave distribution
Correspondence to: W. Li,
Citation:
Li, W., B. Ni, R. M. Thorne, J. Bortnik, Y. Nishimura, J. C. Green, C. A. Kletzing, W. S. Kurth, G. B. Hospodarsky, H. E. Spence, G. D. Reeves, J. B. Blake, J. F. Fennell, S. G. Claudepierre, and X. Gu (2014), Quantifying hiss-driven energetic electron precipitation: A detailed con-junction event analysis,Geophys. Res. Lett.,41, 1085–1092, doi:10.1002/ 2013GL059132.
Received 23 DEC 2013 Accepted 28 JAN 2014
2.1. POES Electron Observations
NOAA POES are polar orbiting, Sun-synchronous satellites at altitudes of ~800–850 km with an orbital period of ~100 min. The space environment monitor 2 instrument package onboard POES includes the medium energy proton and electron detector, which has two electron solid-state detector telescopes measuring electronfluxes in three energy bands (>30 keV,>100 keV, and>300 keV) [Evans and Greer, 2004;Green, 2013]. Thefield of view of the 0° telescope is approximately outward along the local zenith, whereas the 90° telescope is mounted perpendicular to the 0° telescope. Both of the telescopes havefields of view that are ±15° wide. The 0° telescope measures precipitatedflux inside the bounce loss cone forL>1.4 [Rodger et al., 2010a], while the 90° telescope measures mixed particles which may be in the bounce or drift loss cone or stably trapped over the invariant latitude range 55°–68° [Rodger et al., 2010b]. Hereafter we refer to electron
fluxes measured by the 0° (90°) telescopes asJ0(J90), respectively. We removed the proton contamination
using the correction procedure described byLam et al. [2010] and also excluded the data within the region of the South Atlantic anomaly to eliminate the drift loss cone effect.
2.2. Wave and Electron Measurements From Van Allen Probes
Wave measurements are provided by the Van Allen Probes with a perigee of ~1.1REand apogee of 5.8REin the
near-equatorial magnetosphere [Mauk et al., 2012]. The Electric and Magnetic Field Instrument Suite and Integrated Science (EMFISIS) includes a magnetometer instrument which provides measurements of DC magneticfields and the wave instrument which provides a comprehensive set of wave electric and magnetic
fields [Kletzing et al., 2013]. The waveform receiver (WFR) of the waves on the EMFISIS instrument measures wave power spectral density from 10 Hz up to 12 kHz every 6 s and the wave high-frequency receiver (HFR) can measure the upper hybrid frequency, from which the plasma density can be calculated [Kletzing et al., 2013]. Electronfluxes with energy ranging from ~30 keV to ~1000 keV, measured at every 11 s of the spin period by the Magnetic Electron Ion Spectrometer (MagEIS) [Blake et al., 2013], are used in this study to evaluate the electron energy spectrum in the equatorial magnetosphere.
2.3. Physics-Based Technique to Link Wave Amplitudes and Electron Precipitation
We evaluate the wave-driven electron pitch angle scattering using quasi-linear diffusion theory [Kennel and Petschek, 1966] and link the estimated electron pitch angle distribution to the two-directional POES electron measurements using a newly developed physics-based technique, which has been successfully applied to chorus waves [Li et al., 2013;Thorne et al., 2013b]. The key equation that connects the ratio (R) of electron count rates (C.R.) measured by the 0° and 90° telescopes to wave scattering rates is
R¼ C:R:ðE>EthÞj0° C:R:ðE>EthÞj90°¼
∫E2 E1∫
2π
0 ∫β0
J Eð Þ Dααð ÞE jα¼α0cosα0
I0 ααeq;0inz0
z0I1ð Þz0 sinηdηdψdE
∫E2 E1∫
2π
0 ∫β0
J Eð Þ Dααð ÞE jα¼α0cosα0
I0ð Þz0 z0I1ð Þz0 þln
sinαeq;out sinα0
sinηdηdψdE
; (1)
whereαandEare the local electron pitch angle and energy,E1andE2are the lower and upper electron
energy for integration, andβis the half angle of the detector acceptance (15° for the POES particle detector). Hereαeq,inandαeq,outare the equatorial pitch angles corresponding to the local pitch angleαfor the 0° and
90° telescopes.J(E) is the electron energy spectrum,Dααð ÞE jα ¼ α0 is the bounce-averaged electron pitch
angle diffusion coefficient at the equatorial loss coneα0, andI0andI1are the modified Bessel functions. z0¼
ffiffiffiffiffiffiffiffiffiffiffiffiffiffiffiffiffiffiffiffiffiffiffiffiffiffiffiffiffiffiffi
α0Dααð ÞE
j
α¼α0cosð Þα0 τp
, whereτis a quarter of the electron bounce period andψandηare defined in Figure 1b in the study ofLi et al. [2013]. Details of the derivation of equation (1) are shown in the study ofLi et al. [2013], and we reproduce the key equation here only for completeness.
Using equation (1), we can estimate the ratio (R) ofJ0/J90, which could be measured by the two-directional POES particle detectors, based on the calculated values ofDααð ÞE jα¼α0for given wave spectral properties. In turn, for a
given value ofR,Dααð ÞE jα¼α0can be calculated numerically, sinceDααð ÞE jα¼α0is the only unknown parameter in
equation (1).Dααð ÞE jα¼α0 is dependent on wave amplitude, electron cyclotron frequency, plasma frequency,
wave normal distribution, and wave frequency spectrum [Summers, 2005;Glauert and Horne, 2005]. Therefore, for given wave frequency spectrum and plasma parameters, we can also calculate wave amplitudes from
Dααð ÞE jα¼α0. Note that in order to calculate wave amplitudes, we need to make assumptions on several parameters
including the electron eneygy spectrum, plasma density, wave normal distribution, wave frequency spectrum, and the latitudinal dependence of the wave normal angle distribution and plasma density etc. In the present paper, we obtained most of these required parameters from the Van Allen Probe observations near the equator and only made assumptions on the latitudinal dependence of the wave normal distributions and plasma density.
3. Results of the Conjunction Event
We conduct a quantitative analysis for hiss-driven electron precipitation for an event, which occurred on 8 November 2012. During this time period, the geomagnetic activity was quiet overall, withKpless than 2 (not
Van Allen Probes A Observation
-300 -200 -100 0 100 AU-AL [nT] Frequency [Hz] 104 105 10-18 10-16 10-14 10-12 (V/m) 2/Hz Frequency [Hz] 102 103 104 10-14 10-12 10-10 (V/m) 2/Hz Frequency [Hz] 102 103 104 10-10 10-8 10-6 10-4 nT 2/Hz Energy [keV]
1.9 6.1 23.5 5.8 7.9 -9.7 0000 0400 Nov 08
2.0 5.8 11.9 5.6 -10.4 0.4 0800 1200
3.8 5.4 8.7 3.9 -2.2 -15.9 1600 2000
5.6 6.9 -19.7 0000 Nov 09 102 103 101 103 105 Eflux [cm -2s -1sr -1keV -1] L MLT LAT hhmm 2012 (a) (b) (c) (d) (e) >30 keV J90 L-shell
POES Observation (06-09 MLT)
3 4 5 6 102 104 106 >30 keV J0 L-shell 3 4 5 6 102 104 106 >100 keV J90 L-shell 3 4 5 6 102 104 106 >100 keV J0 L-shell 3 4 5 6 102 104 106 [cm -2s -1sr -1] >300 keV J90 L-shell 3 4 5 6 102 104 106 >300 keV J0 L-shell 0000 Nov 08
0800 1600 0000
Nov 09 3 4 5 6 102 104 106 hhmm 2012 (f) (g) (h) (i) (j) (k)
Orbit 186 Orbit 187 Orbit 188
Plasmapause Inside
Plasmasphere
Plasmapause
fce
0.1 fce
0.5 fce
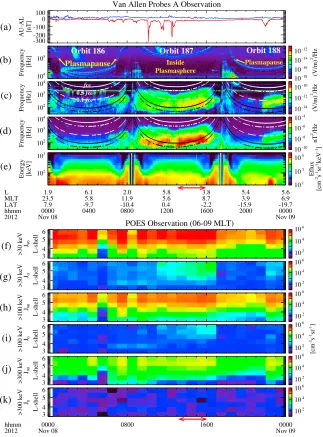
Figure 1.Observations of plasmaspheric hiss by Van Allen Probe A and energetic electron precipitation by POES satellites
near the postdawn sector on 8 November 2012. (a)AU(blue) andAL(red) index. (b) Frequency-time spectrogram of electric
field spectral density in the HFR channel. (c) Frequency-time spectrogram of electricfield and (d) magneticfield spectral
density in the WFR channel. In Figures 1c and 1d, the white lines indicatefce(solid), 0.5fce(dot-dashed), and 0.1fce(dashed),
and the black lines indicatefLHR(solid) and 0.5fLHR(dot-dashed), wherefceandfLHRrepresent electron cyclotron
fre-quency and lower hybrid resonance frefre-quency, respectively. (e) Energy spectrogram of electron differentialflux observed by
MagEIS. (f and g)J90andJ0observed by POES satellites over 6–9 MLT for>30 keV. (h and i) The same as Figures 1f and 1g but
for electron energy of>100 keV. (j and k) The same as Figures 1f and 1g but for electron energy of>300 keV.
Geophysical Research Letters
10.1002/2013GL059132
shown), but there was a modest disturbance inAL(Figure 1a) down to300 nT between 10 and 13 UT, followed by a quiet period during the rest of the day (except for a small disturbance inALat around 22 UT). Figure 1 shows Van Allen Probe A observations of waves and electronflux near the dawn sector in the equatorial magnetosphere and POES observations ofJ90andJ0at various energies (>30 keV,>100 keV, and
>300 keV) in a similar range of MLT (6–9). Here the electronfluxes measured by POES satellites, which passed over 6–9 MLT, were averaged into 0.5 L × 1 h (in UT) bins. During Orbit 186, as shown from the upper hybrid line in Figure 1b, the plasmapause was located at ~4REnear the dawn sector, and weak chorus waves were observed outside the plasmapause (Figures 1c and 1d).J0was very weak during the time interval of Orbit 186,
as shown at various energies in Figures 1g, 1i, and 1k associated with these weak chorus waves, although the measuredJ90was sufficiently above the noise level. During Orbit 187, the plasmapause location moved
outside the apogee of Probe A (>~5.8RE), and strong hiss waves were observed throughout the outer
plasmasphere in association with the modest disturbance inAL. Interestingly, a pronounced electron precipitation at>30 keV (Figure 1g) and>100 keV (Figure 1i) was also observed during the period (11–17 UT) when Van Allen Probe A observed strong hiss. Note thatJ0at>300 keV (Figure 1k) was close to the noise level
and thus is excluded from further quantitative analysis. During Orbit 188, no waves were observed outbound (18–21 UT) in the postmidnight sector, followed by modest whistler mode waves observed during 22–24 UT near the dawn sector. These modest whistler mode waves were associated with modest electron
precipitation at>30 keV and>100 keV observed by POES during the same time interval (22–24 UT). Note that Van Allen Probe B observed very similar features, since the two satellites were very close to each other on this day. Overall, low-altitude electron precipitation at>30 keV and>100 keV exhibited remarkable correlation with whistler mode wave intensity observed near the magnetic equator.
In the present paper, we focus on the period of 13–16 UT (indicated by the red horizontal arrow in Figure 1), when Van Allen Probe A traveled from the apogee (~5.8RE) to lowerLshells down to 3.8,
and perform a quantitative analysis of electron scattering driven by plasmaspheric hiss. As shown in equation (1), calculation ofRrequires the electron energy spectrum (J(E)), which can be obtained from the in situ MagEIS measurements in the equatorial magnetosphere. Based on the MagEIS electronflux observed during the analyzed period (13–16 UT), wefit the energy eneygy spectrum using a relativistic Kappa-type distribution [Xiao et al., 2008] at eachLshell as shown in Figure 2a (color coded for various
Lshells). Note that this Kappa-type distribution obeys a power law distribution at the relativistic energies [e.g.,Lu et al., 2011]. The energy spectrum was softer at lowerLshells and became harder at larger
Lshells. Although the wave spectrum (Figures 1c and 1d) did not show significant variation during 13–16 UT, the wave frequency corresponding to the peak wave power became slightly lower at higherLshells (Figure 2b). The total plasma density calculated from the upper hybrid line measured on EMFISIS and a dipole magneticfield model are used to calculate the ratio of the plasma to electron cyclotron frequency (fpe/fce) and the electron minimum cyclotron resonant energy (Emin) at the
geomagnetic equator, as shown in Figures 2c and 2d. We confirmed that a dipole magneticfield model agrees well with the observed local magneticfield measurements during this time interval associated with modest geomagnetic activity near the dawn sector.fpe/fceincreases with increasingLshells over 3.8–5.8
inside the plasmasphere.Emindecreases with increasingLshells and frequencies (Figure 2d) and quickly
increases with increasing magnetic latitudes [Bortnik et al., 2011]. Hiss with wave frequencies over 100–200 Hz, corresponding to the peak wave power, resonates with electrons withE>~30 keV atL~5 and E>~100 keV at L~4.
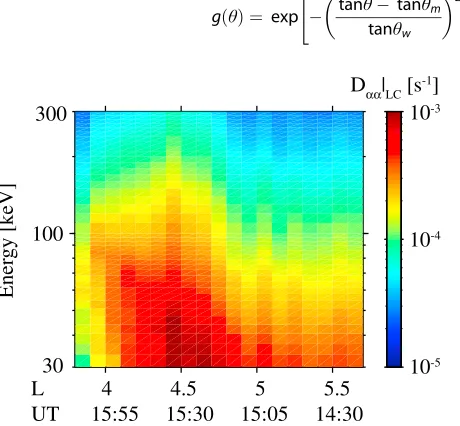
We use the measured wave frequency spectrum and plasma density by Van Allen Probe A to calculate bounce-averaged electron pitch angle diffusion coefficients at the loss cone at variousLshells and energies (Figure 3). Since hiss was observed continuously over 13–16 UT (Figures 1c and 1d), we assume that hiss was always present during the interval of the conjunction event in a region with theLshell of 3.8–5.8 over 6–8.5 MLT. We also assume a constant hiss spectrum distributed up to 45° of the magnetic latitude (λ) following the ray-tracing results [e.g.,Bortnik et al., 2011]. Total plasma density along the magneticfield line is assumed to vary following
neð Þ ¼λ ne0=cosð Þλ2a; (2)
whereneis the local plasma density at magnetic latitudeλandne0is the equatorial value. The parameterais
set to 1 according to the statistical value obtained inside the plasmapshere [e.g.,Denton et al., 2006]. The wave normal distribution of hiss is assumed to be Gaussian and given by
gð Þ ¼θ exp tanθtanθm
tanθw
2
" #
θlc≤θ≤θuc
ð Þ; (3)
whereθis the wave normal angle,θmis the
peak,θwis the angular width, andθlcandθuc
are the lower and upper cutoffs to the wave normal distribution, outside which the wave power is zero. The adopted wave normal angle distribution is shown in Table 1, which varies with magnetic latitudes, consistent with ray-tracing results [Bortnik et al., 2011] and statistical Cluster observations [Agapitov et al., 2013]. Figure 3 shows bounce-averaged pitch angle diffusion coefficients at the loss cone, which is strongly energy-dependent with larger values at lower energies at mostLshells except atL<~4.2.Dααð ÞE jα¼α0reaches its
maximum atL~4.4 for all electron energies corresponding to where hiss amplitudes are observed to be strongest up to 115 pT (blue dashed line in Figure 4b).
Figure 2.Parameters used to calculate electron pitch angle diffusion coefficients at variousLshells. (a) Electron energy spectrum
obtained byfitting a relativistic Kappa-type function based on MagEIS electronflux measurements during 13–16 UT on 8
November 2012, when Van Allen Probe A traveled throughLshells from 5.8 to 3.8, color coded for variousLshells. (b) Magneticfield
spectral density observed by the EMFISIS instrument on Van Allen Probe A, color coded for variousLshells. (c) Total plasma density
(blue) calculated from the upper hybrid line, background magneticfield (black), and the ratio of plasma frequency to electron
cyclotron frequency (fpe/fce) (red) as a function ofLshell. (d) Electron minimum cyclotron resonant energy at the geomagnetic
equator as a function ofLshell and wave frequency, where the white and black lines represent theEmincontours of 30 and 100 keV.
Ener
gy [keV]
100
30
300
L 4 4.5 5 5.5
UT 15:55 15:30 15:05 14:30
10
-310
-410
-5D
αα|
LC[s
-1]
Figure 3.Bounce-averaged electron pitch angle diffusion coeffi
-cients at the bounce loss cone as a function ofLshell (and UT
on 8 November 2012 when Van Allen Probe A traveled through
the correspondingLshell) and electron energy.
Geophysical Research Letters
10.1002/2013GL059132
As discussed above, the wave frequency spectrum showed insignificant variation between 13 and 16 UT, when Van Allen Probe A traveled from 5.8 to 3.8REand from
6 to 8.5 MLT. Between 15:03 and 15:05 UT, the NOAA 17 satellite traveled through the region withLshells from ~3.8 to ~6 near 7.5–8 MLT at the low altitude of ~800–850 km. Therefore, it is reasonable to assume that the precipitated electronfluxes measured by NOAA 17 atLshells over 3.8–5.8 in the postdawn sector are predominantly due to pitch angle scattering by hiss in the conjugate equatorial magnetosphere.
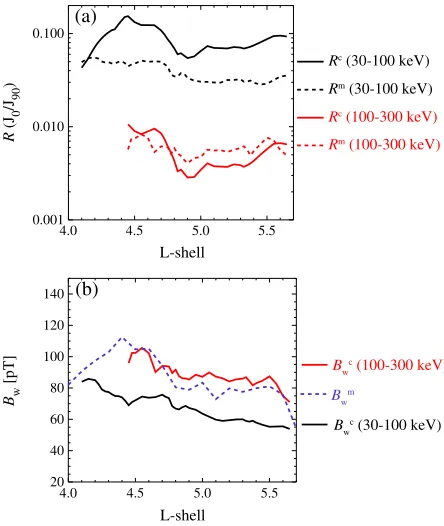
We calculated the ratio (Rc) in the energy channel of 30–100 keV and 100–300 keV using equation (1) based on the parameters shown in Figure 2 and pitch angle diffusion coefficients shown in Figure 3. We also obtained measured ratio (Rm) ofJ0/J90for the energy range of 30–100 keV and 100–300 keV by NOAA 17. Note that the
electronfluxes measured over 30–100 keV (100–300 keV) were obtained by subtracting>100 keV (>300 keV) electronfluxes from the values of>30 keV (>100 keV). Comparison of the calculated and directly measured
R(Figure 4a) exhibits fairly good agreement particularly for 100–300 keV. Note thatR(Figure 4a) andBwc
(Figure 4b) values are only shown for theLshells, where electron counts measured by 0° and 90° telescopes are sufficiently above the background level (>5 s1). This is why no values are shown atL<4.4 in the 100–300 keV
channel in Figures 4a and 4b.Rcat 30– 100 keV is larger thanRm, but the difference is generally within a factor of about 2.Ris generally larger atLshells of 4.3–4.7 compared to that at largerLshells for both measured and calculated values.
Figure 4b shows calculated hiss wave amplitudes from the measuredRfor two energy channels of 30–100 keV and 100–300 keV separately, using the method described in section 2.3. The calculated hiss wave amplitudes (Bwcin solid red line) fromRc(100–300 keV) show remarkable agreement with the directly measured hiss wave amplitudes from EMFISIS (Bwmin dashed blue line). Note that although the measuredBwm(>80 pT) is larger than the
hiss wave amplitudes of 10 pT, which was used to represent the long-term averaged value in the study ofAbel and Thorne[1998], it is comparable to the hiss wave amplitudes observed by the CRRES during active times [Meredith et al., 2007]. Hiss wave amplitudes (Bwcin solid black line) calculated fromRc
(30–100 keV) are slightly lower than the measured values atL>4.7, while the consistency becomes worse over theLshells of 4.0–4.7. Nevertheless, the difference in measured and calculated wave amplitudes was within a factor of 2, which suggests that measured values ofRcan be used to provide a realistic estimate of the hiss wave
Table 1. Wave Normal Distributions of Plasmaspheric Hiss at Various Magnetic Latitudes
|λ| θm θlc θuc θw
0°5° 0° 0° 10° 5°
5°10° 10° 0° 20° 10°
10°15° 20° 0° 30° 15°
15°20° 25° 10° 40° 20°
20°25° 30° 20° 50° 25°
25°30° 35° 30° 60° 30°
30°35° 45° 40° 65° 35°
35°40° 55° 50° 70° 40°
40°45° 65° 60° 75° 50°
(a)
(b)
4.0 4.5 5.0 5.5
L-shell 20
40 60 80 100 120 140
Bw
[pT]
4.0 4.5 5.0 5.5
L-shell 0.001
0.010 0.100
R
(J
0
/J90
)
Figure 4.Comparison of measured and calculatedRand hiss wave
amplitude (Bw). (a)R(J0/J90) calculated using measured wave
spectral intensity and plasma parameters (Rc: solid black line) and
directly measured from two-directional POES measurements
(Rm: dashed black line) for 30–100 keV electrons. Red lines represent
similar quantities to black lines but for electron energies of
100–300 keV. (b) Directly measured hiss wave amplitudes on EMFISIS
integrated over 40–4000 Hz (Bwm: blue dashed line) and calculated
hiss wave amplitudes usingRmof 30–100 keV (Bwc: black line).
Red line is similar to the black line but for electron energy of
100–300 keV.
amplitudes at variousLshells. Note that since ~30 keV is very close to the electron minimum resonant energy, any change in real parameters (such as the latitudinal dependence of the wave normal angle distribution and plasma density) observed in space compared to our assumptions could bring a substantial portion of the ~30 keV electron populations out of resonance. This will cause larger changes in precipitated electronfluxes andRin the 30–100 keV energy channel, and thus,R(30–100 keV) provides a larger uncertainty in estimating hiss wave amplitudes compared to the 100–300 keV channel.Rm(100–300 keV) is likely to be more robust compared toRm(30–100 keV) to calculate hiss wave amplitudes, since 100–300 keV electrons almost always resonate with plasmaspheric hiss over its typical frequency range.
Note that in this conjunction event analysis, parameters near the equator were taken based on the in situ Van Allen Probe A observation. However, in the off-equatorial region, we assume the latitudinal dependence of the wave normal angle distribution and plasma density based on the statistical observations [Agapitov et al., 2013;Denton et al., 2006]. We also tested different wave normal distributions (e.g., quasi-parallel wave normal angle distributions along thefield line) and different values ofa(in equation (2)) over 0–1 to model different density distributions along thefield line, and the results (not shown) are very similar to those shown in Figure 4. This also indicates that this technique is relatively insensitive to these assumed parameter changes and provides robust and reliable estimates of hiss wave amplitudes.
4. Summary and Discussion
Using a physics-based technique, we quantify hiss-driven electron precipitation during a conjunction event, when Van Allen Probe A observed plasmaspheric hiss in the equatorial magnetosphere and NOAA 17 measured electron precipitation at the conjugate low altitudes. We calculated the ratio of electronfluxes (R), which could be measured by two-directional POES particle detectors, based on observed wave and plasma parameters. Comparison between the measured and calculatedRover the energy of 30–100 keV and 100–300 keV showed fairly good agreement at variousLshells. The measuredR, in turn, was used to calculate the hiss wave amplitudes, which showed remarkable agreement with the directly measured hiss wave intensity particularly at 100–300 keV. Note that the 100–300 keV energy channel is more robust and reliable to infer hiss wave amplitudes compared to the energy channel of 30–100 keV. This suggests that this technique, based on quasi-linear diffusion theory, can be used to estimate hiss wave amplitudes from the low-altitude energetic electron measurements and thereby construct the spatiotemporal evolution of hiss wave intensity on a global scale using observations from multiple POES satellites. Such a data-driven dynamic hiss wave distribution could be critically important for the evaluation of electron loss from the inner magnetosphere over a broad energy range (tens of keV to several MeV).
This technique will only be reliable in regions where measured electronfluxes by POES satellites are sufficiently above the noise level, which limits its use to a certain range ofLshells, i.e., at>~4REin the event
studied here. However, ray-tracing simulations of the propagation of hiss [Bortnik et al., 2011;Chen et al., 2012] provide insightful information on how hiss wave power scales over variousLshell ranges. The combination of available hiss wave amplitudes inferred from low-altitude electron precipitation, together with in situ equatorial wave observations and ray-tracing simulations, has the potential to provide more complete information on the spatiotemporal evolution of hiss in the entire plasmasphere during various geomagnetic activities, but this will require further development.
References
Abel, R. W., and R. M. Thorne (1998), Electron scattering loss in Earth’s inner magnetosphere,1: Dominant physical processes,J. Geophys. Res.,
103, 2385–2396.
Agapitov, O., A. Artemyev, V. Krasnoselskikh, Y. V. Khotyaintsev, D. Mourenas, H. Breuillard, M. Balikhin, and G. Rolland (2013), Statistics of whistler-mode waves in the outer radiation belt: Cluster STAFF-SA measurements,J. Geophys. Res. Space Physics,118, 3407–3420, doi:10.1002/jgra.50312.
Baker, D. N., et al. (2013), A long-lived relativistic electron storage ring embedded in Earth’s outer Van Allen belt,Science,340(6129), 186–190, doi:10.1126/science.1233518.
Blake, J. B., et al. (2013), The Magnetic Electron Ion Spectrometer (MagEIS) Instruments Aboard the Radiation Belt Storm Probes (RBSP) spacecraft,Space Sci. Rev.,179, 383–421, doi:10.1007/s11214-013-9991-8.
Bortnik, J., L. Chen, W. Li, R. M. Thorne, N. P. Meredith, and R. B. Horne (2011), Modeling the wave power distribution and characteristics of plasmaspheric hiss,J. Geophys. Res.,116, A12209, doi:10.1029/2011JA016862.
Acknowledgments
This work was supported by JHU/APL contracts 967399 and 921647 under NASA’s prime contract NAS5-01072. The analysis at UCLA was supported by the EMFISIS subaward 1001057397:01, ECT subaward 13-041, NASA grants NNX11AD75G, NNX11AR64G, and NNX13AI61G. We also thank the World Data Center for Geomagnetism, Kyoto for providingAUandALindex used in this study.
The Editor thanks two anonymous reviewers for their assistance in evaluat-ing this paper.
Geophysical Research Letters
10.1002/2013GL059132
Chen, L., J. Bortnik, W. Li, R. M. Thorne, and R. B. Horne (2012), Modeling the properties of plasmaspheric hiss: 1. Dependence on chorus wave emission,J. Geophys. Res.,117, A05201, doi:10.1029/2011JA017201.
Denton, R. E., K. Takahashi, I. A. Galkin, P. A. Nsumei, X. Huang, B. W. Reinisch, R. R. Anderson, M. K. Sleeper, and W. J. Hughes (2006), Distribution of density along magnetosphericfield lines,J. Geophys. Res.,111, A04213, doi:10.1029/2005JA011414.
Evans, D. S., and M. S. Greer (2004), Polar Orbiting Environmental Satellite Space Environment Monitor-2: Instrument descriptions and archive data documentation,NOAA Tech.Mem.93, version 1.4, Space Weather Predict. Cent., Boulder, Colo.
Glauert, S. A., and R. B. Horne (2005), Calculation of pitch angle and energy diffusion coefficients with the PADIE code,J. Geophys. Res.,110, A04206, doi:10.1029/2004JA010851.
Green, J. C. (2013),MEPED Telescope Data Processing Algorithm Theoretical Basis Document, Natl. Oceanic and Atmos. Admin. Space Environ. Cent, Boulder, Colo.
Kennel, C. F., and H. E. Petschek (1966), Limit on stably trapped particlefluxes,J. Geophys. Res.,71, 1–28, doi:10.1029/JZ071i001p00001. Kletzing, C. A., et al. (2013), The Electric and Magnetic Field Instrument Suite and Integrated Science (EMFISIS) on RBSP,Space Sci. Rev.,179,
127–181, doi:10.1007/s11214-013-9993-6.
Lam, M. M., R. B. Horne, N. P. Meredith, S. A. Glauert, T. Moffat-Griffin, and J. C. Green (2010), Origin of energetic electron precipitation>30 keV into the atmosphere,J. Geophys. Res.,115, A00F08, doi:10.1029/2009JA014619.
Li, W., B. Ni, R. M. Thorne, J. Bortnik, J. C. Green, C. A. Kletzing, W. S. Kurth, and G. B. Hospodarsky (2013), Constructing the global distribution of chorus wave intensity using measurements of electrons by the POES satellites and waves by the Van Allen Probes,Geophys. Res. Lett.,40, 4526–4532, doi:10.1002/grl.50920.
Lu, Q., L. Shan, C. Shen, T. Zhang, Y. Li, and S. Wang (2011), Velocity distributions of superthermal electronsfitted with a power law function in the magnetosheath: Cluster observations,J. Geophys. Res.,116, A03224, doi:10.1029/2010JA016118.
Lyons, L. R., and R. M. Thorne (1973), Equilibrium structure of radiation belt electrons,J. Geophys. Res.,78, 2142–2149, doi:10.1029/ JA078i013p02142.
Mauk, B. H., N. J. Fox, S. G. Kanekal, R. L. Kessel, D. G. Sibeck, and A. Ukhorskiy (2012), Science Objectives and Rationale for the Radiation Belt Storm Probes Mission,Space Sci. Rev., 1–15, doi:10.1007/s11214-012-9908-y.
Meredith, N. P., R. B. Horne, S. A. Glauert, and R. R. Anderson (2007), Slot region electron loss timescales due to plasmaspheric hiss and lightning-generated whistlers,J. Geophys. Res.,112, A08214, doi:10.1029/2007JA012413.
Ni, B., R. M. Thorne, Y. Y. Shprits, and J. Bortnik (2008), Resonant scattering of plasma sheet electrons by whistler-mode chorus: Contribution to diffuse auroral precipitation,Geophys. Res. Lett.,35, L11106, doi:10.1029/2008GL034032.
Ni, B., J. Bortnik, R. M. Thorne, Q. Ma, and L. Chen (2013), Resonant scattering and resultant pitch angle evolution of relativistic electrons by plasmaspheric hiss,J. Geophys. Res. Space Physics,118, 7740–7751, doi:10.1002/2013JA019260.
Rodger, C. J., M. A. Clilverd, J. C. Green, and M. M. Lam (2010a), Use of POES SEM-2 observations to examine radiation belt dynamics and energetic electron precipitation into the atmosphere,J. Geophys. Res.,115, A04202, doi:10.1029/2008JA014023.
Rodger, C. J., B. R. Carson, S. A. Cummer, R. J. Gamble, M. A. Clilverd, J. C. Green, J.-A. Sauvaud, M. Parrot, and J.-J. Berthelier (2010b), Contrasting the efficiency of radiation belt losses caused by ducted and nonducted whistler-mode waves from ground-based transmitters,J. Geophys. Res.,115, A12208, doi:10.1029/2010JA015880.
Shprits, Y. Y., and B. Ni (2009), Dependence of the quasi-linear scattering rates on the wave-normal distribution for chorus waves in the radiation belt,J. Geophys. Res.,114, A11205, doi:10.1029/2009JA014223.
Summers, D. (2005), Quasi-linear diffusion coefficients forfield-aligned electromagnetic waves with applications to the magnetosphere,
J. Geophys. Res.,110, A08213, doi:10.1029/2005JA011159.
Thorne, R. M., et al. (2013a), Evolution and slow decay of an unusual narrow ring of relativistic electrons near L~3.2 following the September 2012 magnetic storm,Geophys. Res. Lett.,40, 3507–3511, doi:10.1002/grl.50627.
Thorne, R. M., et al. (2013b), Rapid local acceleration of relativistic radiation belt electrons by magnetospheric chorus,Nature,504, 411–414, doi:10.1038/nature12889.
Xiao, F., C. Shen, Y. Wang, H. Zheng, and S. Wang (2008), Energetic electron distributionsfitted with a relativistic kappa-type function at geosynchronous orbit,J. Geophys. Res.,113, A05203, doi:10.1029/2007JA012903.