Dr. SACHIN L. BORSE
Professor, Department of Mechanical Engineering, Rajarshi Shahu College of Engineering,
Tathawade, Pune-411033, Maharashtra, INDIA. [email protected]
Abstract :
Experiments were conducted to study forced convection in three different engine blocks. Current study uses three engine blocks machined from plain Aluminium. Plain Cylinder Block, Cylinder Block with fins & Square Block with fins is used. Inside the cylinder block fine heaters were fitted to mimic heating at different locations. Temperatures at various locations were measured. Few experimental data is compared with CFD results by Fluent.
Keywords: Engine heat transfer; Forced Convection.
1. Introduction
Heat transfer through the cylinder walls of internal combustion engines is recognized as one of the most important factors that influences both engine design and operation. Research efforts concerning heat transfer in internal combustion engines often target the investigation of thermal loading at critical combustion chamber components.
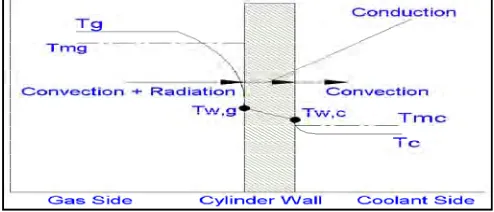
In-cylinder heat transfer is a significant feature of internal combustion engines (ICEs) which affects engine performance and emissions. Measurements of heat transfer have been performed and models have been produced by a large number of researchers. The accuracy of predicting the wall heat transfer is required not only to calculate the heat transfer rate from the gas pressure and temperature data, but also necessary for the internal combustion engines to improve the overall engine simulation. The heat transfer process from the gases to the coolant through the combustion chamber wall has in general the three heat transfer elements. From the gases to the combustion chamber wall the heat is transferred mainly by convection with a contribution from radiation. The heat flux is conducted through the combustion chamber walls and then convected from the walls to the coolant, figure 1.1.
Fig. 1.Schematic of temperature distribution and heat transfer modes across Combustion chamber wall.
1.2 Proble
1.2.1 Purpo To study u condition. 1.2.2 Aim The main o 1. To dev creating piston. Total heat splitting th 2. Create e 3. To comp
2. Experi
2.1 Experim Ex were manu Inside the c locations w CFD for th
em Definition
ose/Need unsteady heat
and Objectives objectives of th velop & impro unsteady heat
applied was 1 he heat into diff experimental da pare experimen
imental Work
mental Set-up xperiments we ufactured from cylinder block were measured he purpose of v
transfer in en
s of Project his project are: ove understand conduction in
127 Watts. Sam ferent patches. ata to use by C ntal data with C
k
of Engine Bloc ere conducted m Aluminium. P
fine heaters w d. In this way h validation.
Fig. 2. Plain
Graph 1. Heat Fl
ngine block w
ding in engine the engine blo
me heat was ap
CFD community CFD results.
cks
for forced con Plain Cylinder were fitted to m
heating & coo
n Cylinder, Cylind
lux versus Crank A
with different p
e heat transfer ock subjected to
pplied to cylin
y for validation
nvection of thr block, Cylind mimic heating a oling trend was
er with fins & Squ Angle
position of pi
r under forced o heat flow acc
nder block with
n purpose.
ee engine bloc der block with at different loca
s observed. Th
uare block with fin
iston under fo
d convection. cording to diff
h different pis
cks. These thre fins & Square ations. Temper his data can be
ns
rced convectio
Study aimed ferent position
ton positions b
ee engine block block with fin ratures at variou e further used b on
at of
by
F
(a)
Fig.4. (a) (
Fig.3. Block Diagr
(b) (c). Experimen
am of Experiment
(c)
ntal Setup of 3 type tal Setup
(b
2.2 Methodology
Test was conducted on plain cylinder, cylinder with fins and square block with fins. These three engine blocks were manufactured from Aluminum. Inside the cylinder block fine heaters were fitted to mimic heating at different locations as shown in figure.
Table: 2. Operating parameter & test conditions
1st
heater ON 2nd
heater ON 3rd
heater ON 4th
heater ON 5th
heater ON
Q 127 watt 63.5 watt 42.33 watt 31.75 watt 25.4 watt
Q 0 63.5 watt 42.33 watt 31.75 watt 25.4 watt
Q 0 0 42.33 watt 31.75 watt 25.4 watt
Q 0 0 0 31.75 watt 25.4 watt
Q 0 0 0 0 25.4 watt
2.2.1 Forced Convection
Then keeping input energy constant, variation in temperature recorded on data logger. In this 1 to 5 coils were operated sequentially up to respective steady state of temperatures were obtained. After steady state condition of first coil fan was started at the velocity of 10m/sec (30 km/h) till the end of experiment.
2.3 Various Instruments and Measuring Devices Used
Thermocouples, Data Logger, Potentiometer, Multimeter, Fan, Anemometer
3. Numerical Work
3.1 CFD Model Preparation & Specifications 1. Circular Engine without fins
Total Mesh: 622381 cells, Mesh size for Engine Block : 443866,
Mesh Size for Fluid Domain: 178515.
The air surrounding the engine is taken as Incompressible Ideal gas.
The air flow is laminar in forced convection.
Boundary condition:
Forced convection : Inlet -Velocity Inlet (30 km/hr),
Outlet- Pressure outlet (0)
2. Circular Engine with fins
Total Mesh: 8394296, Mesh size for Engine Block : 562237.
Mesh Size for Fluid Domain: 356943.
3. Square Engine Block
Total Mesh: 1510970 cells, Mesh size for Engine Block: 738291.
Mesh Size for Fluid Domain: 772679.
The air surrounding the engine is taken as Incompressible Ideal gas.
The air flow is laminar in forced convection.
Boundary condition:
Forced convection : Inlet -Velocity Inlet (30 km/hr),
Outlet- Pressure outlet (0)
Heater is modeled by solid ring and internal heat generation is applied to solid ring such that net heat
generated by ring is 127 Watts.
Fig. 6. Temperature Distribution stepwise - First, Second and Third, Fourth and Fifth Heater ON along with FAN ON. (Cylindrical block without fin)
Fig. 7. Velocity Diagram for Circular Block (without fin), Circular Block (with fin) and Square Block.
4. Results and Discussion
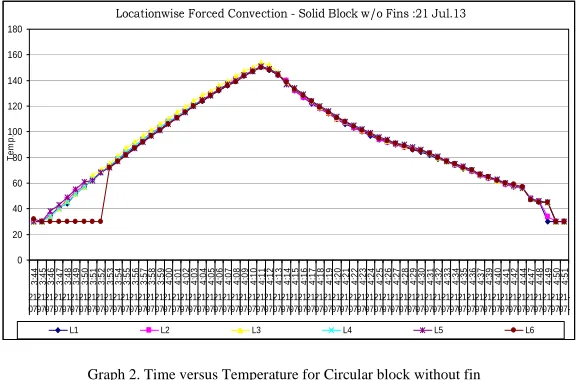
4.1 Measurements of temperature were taken at 6 locations (L1 to L6) and Time versus Temperature graphs is plotted. In this temperature is increased till the steady state is obtained. During this, initially moderate temperature differences observed at six locations. As time goes on, mall temperature differences observed at six locations. Very small temperature differences were observed at six locations during forced convection cooling.
Graph 2. Time versus Temperature for Circular block without fin
4.2 Measurements of temperature were taken at 12 locations (L1 to L12) and Time versus Temperature graphs is plotted. In this temperature is increased till the steady state is obtained and then cooling trend is observed. During this, initially moderate temperature differences observed at twelve locations. Temperature near the wall surface is higher. Very small temperature differences were observed near the cylinder wall. Moderate
Locationwise Forced Convection - Solid Block w/o Fins :21 Jul.13
0 20 40 60 80 100 120 140 160 180 3: 44 3: 45 3: 46 3: 47 3: 48 3: 49 3: 50 3: 51 3: 52 3: 53 3: 54 3: 55 3: 56 3: 57 3: 58 3: 59 4: 00 4: 01 4: 02 4: 03 4: 04 4: 05 4: 06 4: 07 4: 08 4: 09 4: 10 4: 11 4: 12 4: 13 4: 14 4: 15 4: 16 4: 17 4: 18 4: 19 4: 20 4: 21 4: 22 4: 23 4: 24 4: 25 4: 26 4: 27 4: 28 4: 29 4: 30 4: 31 4: 32 4: 33 4: 34 4: 35 4: 36 4: 37 4: 39 4: 40 4: 41 4: 42 4: 44 4: 47 4: 48 4: 49 4: 50 4: 51 21- 07- 21- 07- 21- 07- 21- 07- 21- 07- 21- 07- 21- 07- 21- 07- 21- 07- 21- 07- 21- 07- 21- 07- 21- 07- 21- 07- 21- 07- 21- 07- 21- 07- 21- 07- 21- 07- 21- 07- 21- 07- 21- 07- 21- 07- 21- 07- 21- 07- 21- 07- 21- 07- 21- 07- 21- 07- 21- 07- 21- 07- 21- 07- 21- 07- 21- 07- 21- 07- 21- 07- 21- 07- 21- 07- 21- 07- 21- 07- 21- 07- 21- 07- 21- 07- 21- 07- 21- 07- 21- 07- 21- 07- 21- 07- 21- 07- 21- 07- 21- 07- 21- 07- 21- 07- 21- 07- 21- 07- 21- 07- 21- 07- 21- 07- 21- 07- 21- 07- 21- 07- 21- 07- 21- 07- 21- 07-Time Te m p .
temperature differences observed at wall and finned locations. During forced convection cooling, very small temperature differences were observed at the wall and at the finned locations.
Graph 3. Time versus Temperature for Circular block with fin
4.3 Measurements of temperature were taken at 12 locations (L1 to L12) and Time versus Temperature graphs is plotted. In this temperature is increased till the steady state is obtained and then cooling trend is observed. During this, initially moderate temperature differences observed at respective locations that is at cylinder wall, finned area. Temperature near the wall surface and rest of the areas is moderate. Very small temperature differences were observed near the wall and finned areas. During forced convection cooling, very small temperature differences were observed at the wall and at the finned locations. Uniform tempeartaure gradient exits between the wall and the finned areas
Graph 4. Time versus Temperature for Square block with fin
4.4 In this, experimental data is compared with CFD (Fluent) data. Around 20 % variation is found in circular clock without fin and 15 % with fins, around 10% variation found in square block with fins. Trend followed by both the graphs is similar.
Locationwise Forced Convection - Cyl.Block With Fins :21 Jul.13
0 10 20 30 40 50 60 70
5:
16
5:
19
5:
22
5:
25
5:
28
5:
31
5:
34
5:
37
5:
40
5:
43
5:
46
5:
49
5:
52
5:
55
5:
58
6:
01
6:
04
6:
07
6:
10
6:
13
6:
16
6:
19
6:
22
6:
25
6:
28
6:
31
6:
34
6:
37
6:
40
6:
43
Time
Tem
p
.
L1 L2 L3 L4 L5 L6 L7 L8 L9 L10 L11 L12 L13 L14 L15
Locationwise Forced Convection - Square Block
Temp.76°C (max) :21 Jul.13
0 10 20 30 40 50 60 70 80 90
7:2 3
7:257:277:2 9
7:317:337:357:377:397:417:437:4 5
7:477:497:5 1
7:537:557:577:598:018:038:058:0 7
8:098:118:1 3
8:158:17
Time
Te
m
p
.
4.5 In this block with faster in S more unifo
Gr
G
, temperature h fin and square Square block w orm in square b
raph 5. Comparison
Graph 6. Comparis
Graph 7. Compari
measured at lo e block with fin with fins than
block.
n of experimental
son of experimenta
ison of experiment
ocation one of n) is compared circular withou
and CFD Data of
al and CFD Data o
tal and CFD Data
f all the three b d. From this gra ut fins and cir
Cylinder Block W
of Cylinder Block W
of Square Block W
blocks (Cylind aph we can con rcular with fin
Without fin
With fin
With fin
der block with nclude that hea ns. Temperatur
out fin, cylind at transfer rate re distribution der
5. Conclus
1. A subst 2. Maximu 3. Compar 4. Unstead compare 5. Tempera Heat tra with fin Reference [1] Yuh-Yi ignition
[2] A. Moh
Commu [3] Paulius transfer [4] Michael Based T [5] O.A.EZ Sympos [6] Kukwon Instanta Enginee [7] Octavio
on the h
[8] John B.
[9] Willard
[10] V. Gane
[11] R. Stone
[12] R. K. R
[13] J. P. Ho
Gra
sions
tantial differenc um heat transfe rison of the exp dy state heat tra
ed it using expe ature gradient f ansfer rate is m n.
es
h Wu, Bo-Chiuan n engines," Internat hammadi, M. Yagh unications in Heat V. Puzinauskas, G r," Applied Therma
l A. Marr, James Thermal Barrier Co ZEKOYE, 1996, " sium International n Cho, Ronald O aneous Temperatu ering for Gas Turb o Armas, Jose Rod heat transfer in the L Heywood, 1988 d W. Pulkrabek, 19 eshan, 2007, Intern e,1999, Introductio Rajput, 2006, Heat
olman, 2007, Expe
aph 8. Comparison
Circular Bl Square Blo
ce of heat flux fer rate in each
perimental data ansfer analysis
erimental data. for square bloc more in square b
n Chen, Cheng-Tin tional Journal of H houbi, M. Rashidi,
and Mass Transfe Gary Hutcherson, al Engineering,23: S. Wallace1, Larr oating in a Spark-I "Heat Transfer M Combustion, 5: pp . Grover, Jr., Den ure Measurements bines and Power, V driguez, Francisco compression cycl 8. Internal Combus 994, Engineering F nal Combustion En on to internal com & Mass Transfer, rimental Methods
n of Heating and co
lock without Fi ock with Fins
exists for vari part occurs wh a of heat condu of cylinder eng . The computed ck is more unif block with fin
ng Ke, Feng-Chi Heat and Mass Tra 2008, "Analysis o r, 35: pp. 215–224 Bryan D. Willson : pp. 1–16. ryPershin, Sanjeev Ignition Engine," J Modeling During K
p. 2661–2668. nnis Assanis, Zora
and CFD for An Vol. 132 / 072805-Payri, Jaime Mart le of a reciprocatin stion Engine, Mc-G Fundamentals of th
ngines, Tata Mc-G mbustion engines, P
S. Chand, 3rd
ed., for Engineers, Ta
ooling Trends of T
ins C
ous places in th hen temperatur
uction with num gine blocks wa d values corres form than circu as compared to
Hsieh, Hua-Chuan ansfer, 52: pp. 1875 of local convective 4.
n, 2003, "Ignition
v Chandra and Jav Journal of Enginee Knock and Flame
an Filipi, Gerald nalysis of Fuel Im
1.
tin,John R. Agude ng engine,” Journa
Graw Hill, 2 nd
ed. he Internal Combu
Graw Hill, 4th
ed., Palgrave, New Yo
pp. 495-527. ata Mc-Graw Hill,
Three Blocks (Exp
Circular Block
he cylinder of re in the cylind merical work d as done using 3 spond to the ex ular without fin o circular with
ng, 2009, "Heat tr 5–1886. e heat transfer in a
and boost effects
vad Mostaghimi, ering for Gas Turb e Quenching In A
Szekely, Paul Naj mpingement on the
elo, 2005, "Effect o al of Applied Therm
, pp. 235-488. ustion Engine, Pear
pp. 524-946
ork,3rd
ed.,pp-281
7th
ed., pp. 48-381 perimental)
k with Fins
an engine. der is maximum
data was perfor 3D CFD softwa xperimental dat n and circular b out fin and circ
ransfer model fo
a spark ignition eng
on large-bore eng
2010, "Preliminar bines and Power V An Engine Cham
jt and Rod Rask, e DISI Engine Pis
of the trapped mas mal Engineering 2
rson Prentice, 2nd
e 6. 1-293. 1. m. rmed. are and ta.
block with fin. cular block
or small-scale spar
gine," Internationa
gine in-cylinder he
ry Testing of Met Vol. 132 /072806-1 mber," Twenty Six
2010, "Combini ston Top, Journal
ss & its compositi 25: pp. 2842-2853