EXPERIMENTAL ANALYSIS AND
MODELLING OF A FOUR STROKE
SINGLE CYLINDER DI DIESEL
ENGINE UNDER VARIABLE
COMPRESSION RATIO
T.P.BALAJI VIGNESH*1, C.BALAMURUGAN1, N. VINAYAGAM1 AND T.GAVASKAR1
1
Dept. of Mechanical Engineering, St. Joseph’s College of Engineering, Chennai 600119, INDIA [email protected]
Abstract:
The study targets at finding the effects of Engine Design parameter (Compression ratio) on the Performance with regard to Brake Specific Fuel Consumption and brake thermal efficiency, Combustion parameter viz. Cylinder pressure, Hear Release rate (HRR), Rate of Pressure Rise (RPR) and emission of CO, CO2, HC , NOx with diesel as a fuel. The Study was carried out at different compression ratios (14-17) to find the optimum value at which lesser emissions and better performance and combustion characteristics are obtained. It was found that as the compression ratio is increased the Brake thermal efficiency and brake power increases and brake specific fuel consumption is slightly reduced. The combustion parameters CP, HRR, RPR all increase with increase with increase in compression ratio. The Emission of CO2 and NOx increases steeply at high compression ratio. A combustion Model of the engine is created in StarCD software and the experimental and the theoretical Cylinder pressure values are validated.
Keywords: DI Diesel Engine, Performance, Combustion, Emission, Compression Ratio, Modelling
1. Inroduction
Variable-stroke engines are gaining attention by researchers and automobile manufactures for their fuel-economy advantage. Many mechanisms are used for achieving the variable compression ratio. Dual piston mechanism [8], multi link mechanism [7], varying the stroke length of the connecting rod [17], Eccentric movement of crankshaft [17]. The most widely used method of varying the compression ratio is the Tilting Cylinder arrangement where the cylinder head is tilted to an angle thereby increasing the clearance volume. Different angle of tilt correspond to different compression ratios. It was found that performance parameters viz. BSFC, BTHE are better at higher compression ratios [1]. Performance and emission study done on the Diesel engine by varying the engine Design parameters such as the compression ratio and injection timing using Methyl esters of Jatopha [15], Mahua Oil [5], Waste cooking oil [10] shows that, as the compression ratio is increases the brake thermal efficiency and the brake power rises. Brake specific Fuel consumption is reduced at higher compression ratios. Emission study on the diesel engine by varying the compression ratio shows that NOx content increases sharply with increase in the compression ratio. When the compression ratio was decreased the CO and HC content in the emission was found to increase [13].
the unsteady flows and the planar wave motion inside the duct system. It allows a complete modelling of the entire engine configuration, giving sufficiently accurate predictions in short times and supporting the optimization and development work of any prototype.
Most studies on the Compression ratio variation on the different parameters on different fuels have been done extensively. The aim of all these studies was to find the optimum compression ratio for which better performance and combustion characteristics are obtained and the emission is minimum. In this study Diesel is used at different compression ratios 14:1-18:1 and the e following investigations are carried out
Performance characteristics at various compression ratios 18:1 to 14:1
The combustion parameters such as variation of cylinder pressure, maximum rate of pressure rise, heat release rate and mass fraction burnt are discussed with reference to the crank angle for different compression ratios.
Emission study of the exhaust gases using five gas analyser (CO, CO2, HC, NOx, O2) under variable compression ratios.
Combustion modelling of the combustion chamber and validation of Cylinder pressure.
The RANS equations are used to selection of the turbulence models. RNG t epsilon model is used with reference to literature survey.2. Experimental Setup
The setup shown in figure 1 consists of single cylinder, four stroke, Multi-fuel, research engine connected to eddy current type dynamometer for loading. The specification of the engine is given in table 1. The operation mode of the engine can be changed from diesel to Petrol or from Petrol to Diesel with some necessary changes. In both modes the compression ratio can be varied without stopping the engine and without altering the combustion chamber geometry by specially designed tilting cylinder blockarrangement.
The injection point and spark point can be changed for research tests. The pressure transmitter Type 6613CA contains a piezoelectric sensor and an integrated charge amplifier. The output shaft of the eddy current dynamometer is fixed to a strain gauge type load cell for measuring applied load to the engine. Type K–Chromel (Nickel–Chromium Alloy)/ Alumel (Nickel– Aluminum Alloy) thermocouples are used to measure gas temperature at the engine exhaust, calorimeter exhaust, water inlet of calorimeter and water outlet of calorimeter, engine cooling water outlet and ambient temperature. Mass air flow sensor is used to measure the airflow rate. A shell and tube gas to liquid heat exchanger is used as a calorimeter for conducting the heat balance. The fuel flow is measured by the use of 20 cc burette and stopwatch with level sensors. Setup is provided with necessary instruments for combustion pressure, Diesel line pressure and crank-angle measurements. These signals are interfaced with computer for pressure crank-angle diagrams. Instruments are provided to interface airflow, fuel flow, temperatures and load measurements. The set up has stand-alone panel box consisting of air box, two fuel tanks for duel fuel test, manometer, fuel measuring unit, transmitters for air and fuel flow measurements, process indicator and hardware interface. Rotameters are provided for cooling water and calorimeter water flow measurement. A battery, starter and battery charger is provided for engine electric start arrangement.
The setup enables study of VCR engine performance for brake power, indicated power, frictional power, BMEP, IMEP, brake thermal efficiency, indicated thermal efficiency, Mechanical efficiency, volumetric efficiency, specific fuel consumption, A/F ratio, heat balance and combustion analysis. Labview based Engine Performance Analysis software package “Engine soft” is provided for on line performance.
2.1Experimental methodology
obtained. Now load is slightly increased to 3 kg and the similar procedure of the performance and emission tests are carried out. Similar procedure is followed for 6 and 9 kg loads. Report of the performance and combustion characteristics is generated after the experiment is completed for the particular compression ratio. The cylinder block is called tilting cylinder block because the when the compression ratio is changed the cylinder block is tilted and clearance volume is changed. The variation of 12:1 to 18:1 could be achieved for diesel and from 6:1 to 10:1for petrol engine. The compression ratio could be changed while the engine is in operation itself.
The Experiment was carried out at compression ratio variation from 14:1 to 18:1. The Compression ratio can be changed during running condition with the help of the Tilting Cylinder Block arrangement. By tilting the cylinder head the clearance volume gets changed thereby changing the compression ratio. The performance and Combustion characteristics were poor at compression ratio lower than 16:1 and above compression ratio 18 were not possible due to structural limitations of the engine. For all experiments the emission value was taken thrice and the mean value of the emission was taken for comparison. The performance of the engine at different loads and settings was evaluated in terms of brake specific fuel consumption (BSFC), brake thermal efficiency ( BTHE) and emission of carbon monoxide, carbon dioxide, unburnt hydrocarbons, and oxides of nitrogen. The BSFC is evaluated by the software on the basis of fuel flow and brake power developed by the engine using the expression BSFC = (volumetric fuel flow in 1 h x fuel density/brake power). Similarly, BTHE is also evaluated by software using the expression BTHE = (brake power x 3600 x 100/volumetric fuel flow in 1 h x fuel density x calorific value of fuel).
3. Results and Discussions:
The relationships between Engine Deign parameter (Compression ratio) and the Dependent parameters (performance, Combustion and Emission) parameters are shown in the figure and the results are discussed in the following sections.
3.1 Performance Parameters:
3.1.1 Brake Specific Fuel Consumption
The BSFC decreases with load significantly for both the fuels as the power output per unit fuel consumption increases at higher loads. Similar findings are reported by other researches also [15, 10, and 5]. It is observed that, as the compression ratio of the engine is increased, BSFC decreases (improves). Out of the three compression ratios selected for the study, CR-18 gives lowest BSFC (Fig. 2). This is because at higher compression ratio, brake power increases. The brake Specific fuel efficiency at no load is nearly infinite as the load increases the BSFC decreases. The observation from the fuel consumption graph (fig 1) shows that BSFC value decreases as the load increases and the BSFC value reduces when the compression ratio is increased. The maximum fuel consumption is measured at CR 14 for 0.9 KW B.p is 8.2 Kg/ Kwhr. The minimum value of BSFC is obtained at compression ratio 18 at B.P of 2.68 kW is 0.3 Kg/Kwhr. Hence for the compression ratio of 14 the maximum BSFC is observed at all loads applied. Minimum BSFC is observed for 18.
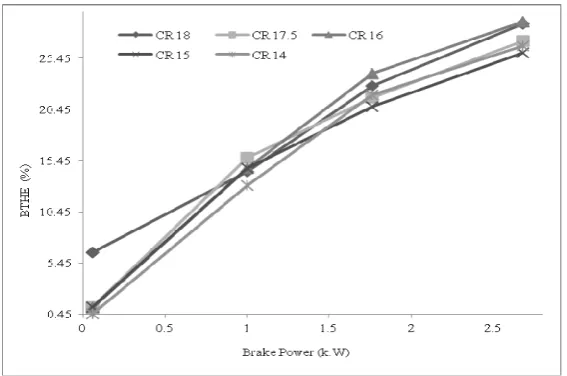
3.1.2 Brake Thermal Efficiency:
The brake thermal efficiency of an engine increases significantly with brake power up to the rated load as lesser losses are encountered at higher loads. On varying the compression ratio, the effect can be visualised on the BTHE indicating that at higher compression ratios, the engine efficiency improves (Fig. 3). At a compression ratio of 18, the BTHE improves by 5.5%. This can be attributed to better combustion of fuel at low clearance volume [15 and 10]. The BTHE value rises as the compression ratio is increased. The maximum brake thermal efficiency is observed at 18 CR ratios (28.9%) and even at low loads BTHE value is high. The lowest efficiency is obtained at 14 and 15. At compression Ratio 15 minimum efficiency of 26% is observed. At higher compression ratios clearance volume reduces this results in better combustion and more power output.
3.2 Combustion Parameters
3.2.1 Cylinder Pressure:
pressure is obtained at 18 compression ratio and with increase in compression ratio the maximum pressure value continuously decreases. The decrease in compression ratio increases the Clearance volume and hence reducing the peak pressure. Crank angle from 325-425 degrees is taken for study where the rise and fall of the pressure occurs. The maximum Pressure obtained is 70.98 bars at CR 18. The minimum obtained at CR 14 is 49.98 bars. Thus when compression ratio is increased the cylinder pressure increases.
3.2.2 Heat Release Rate (HRR):
Heat Release Rate is measure of how fast chemical energy of fuel is converted into the thermal energy by combustion. This directly affects rate of pressure rise and accordingly the power produced. When the fuel is injected into the cylinder, some of it vaporizes and mixes with air to form a combustible mixture which auto- ignites due to the high temperature. Because of the high temperature, the portion of the fuel, this vaporized and mixed with air burns very rapidly. This initial burning of the fuel–air mixture is called the premixed burning phase. The heat release rate is used to identify the start of combustion, the fraction of fuel burned in the premixed mode, and differences in combustion rates of fuels. One of the important parameter in the combustion phenomenon is the ignition delay. The definition of the ignition delay is the time lag between the start of fuel injection to the start of combustion. This can be easily seen in the figure 5 the peak for different compression ratios continuously moves to the right. As the compression ratio is reduced ignition lag also increases leading to late heat release. The amount of heat released changes for different compression ratios. Incomplete combustion at different compression ratio is main reason for the different values of HRR at different compression ratio. Maximum HRR obtained is 60.19 J/Deg at CR 18 while Minimum HRR is 54.32 J/Deg at CR 14.
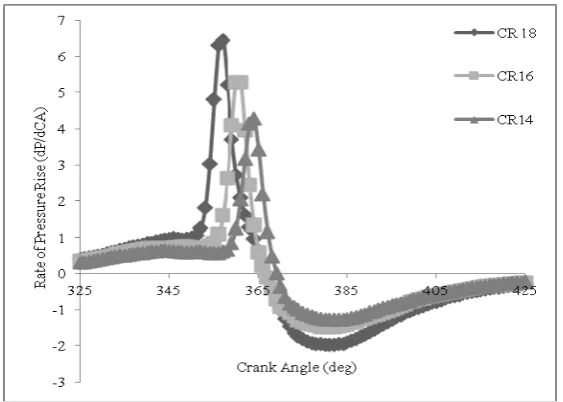
3.2.3 Rate of Pressure Rise:
The rate of pressure rise is the variation of the dP/dO with the crank angle. The rate of pressure rise is similar to that of the cylinder pressure and Heat release curve. The figure 6 shows the rate of pressure rise graph for compression ratios 18, 16, 14. . Here the ignition delay effect on the Pressure rise rate can be clearly seen. As the compression ratio is lowered the ‘start of combustion’ is delayed. This leads to incomplete combustion of charge hence leading to decrease in rate of pressure rise. It can be seen that at the maximum compression ratio the rate of pressure rise is found to be the highest 6.44 after the compression ratio is decreased the pressure rise reduces to a minimum of 4.28 at CR 14
3.3 Emission Study
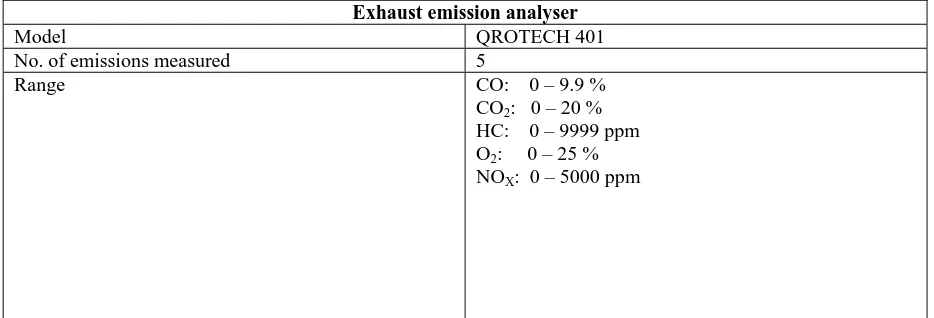
The QROTECH 401 is five gas measuring equipment (CO, CO2, O2, HC, NOX). It has a minute tube arrangement which is inserted at the exhaust pipe. The other end of the tube is inserted into the measuring equipment and different gases percentage is displayed in a digital screen. CO, CO2, O2 are given in % while HC and NOX are given in ppm. The output could be directly printed out or connected to a printer. The exhaust gas analysis is carried out by connecting the test rig with the engine. The table 2 shows the maximum rage of measurement. The exhaust gas test rig is used to analyze the amount of particulate matter present in exhaust gas. The exhaust gas analyzer shows the presence of:
Carbon Monoxide (CO in %)
Hydro Carbon (HC in ppm)
Carbon dioxide (CO2 in %)
Oxygen (O2 in %)
Nitrous Oxide (NOx in ppm)
The exhaust gas analysis is performed for each of the fuels and the values are tabulated and the various graphs are plotted for various fuel blends.
3.3.1 Carbon Monoxide:
3.3.2 Carbon Dioxide:
The fig 6 shows the variations of percentage of carbon dioxide in the exhaust with the loads at different compression ratios. The graph shows that the as the brake power is increased the carbon dioxide content in the exhaust also increases. It is observed that at no load Carbon dioxide content is maximum at compression ratio18 (2.3%) and when the compression ratio is reduced the carbon dioxide value also reduces and reaches a minimum value of (1.4%). Carbon Dioxide increases as the load is increased. It reaches a maximum value of 5.5% at maximum load.
3.3.3 Hydrocarbons:
The variation of the Load and the Hydrocarbon in ppm at various compression ratios is shown in fig 9. The variation of the graph is similar to that of the CO Vs load graph. The reason for the graph’s shape is same as for the carbon monoxide graph. The increase in Compression Ratio leads to increase in the combustion volume and leading to improper combustion of the fuel air mixture. The maximum HC produced in the experiment is in CR 14 at no load is 155 ppm. The minimum value of hydrocarbon emission produced is 23 ppm at compression ratio 18 and at no load. The HC percentage reduces as the load is increased. As the load is increased the temperature and pressure of the combustion chamber gets increased leading to better combustion of the charge. Hence reducing the un-burnt carbon content.
3.3.4 Nitrous Oxide:
Fig 10 shows the variations of the nitrous oxide levels Vs the loads at different compression ratios. The nitrous oxide emission mainly depends upon the temperature of the combustion chamber. Air contains high amount of nitrogen in the free form but it doesn’t react with oxygen until a particular temperature is reached. At high compression ratio the nitrous oxide content in the exhaust increases. When the load is increased to maximum value then the nitrous oxide content reaches a maximum value of 1482ppm. For low compression ratios the nitrous oxide level reduces to half its value (627ppm). The nitrous oxide level at low loads in all compression ratios. It is even lower when low loads are applied. Nitrous emissions are formed when the engine temperature reaches exceedingly high values.
4. Modelling and analysis:
4.1 Modelling and Meshing:
Computational Fluid Dynamics (CFD) is the analysis of systems involving fluid flow, heat transfer and associated phenomena such as chemical reactions by means of computer based simulation. The technique is very powerful and spans a wide range of industrial and non – industrial application areas. Some examples are
aerodynamics of aircraft and vehicles – lift and drag hydrodynamics of ships
power plant – combustion in internal combustion engines and gas turbines turbomachinery – flows inside rotating passages, diffusers etc.
electrical and electronic engineering – cooling of equipments including microcircuits chemical process engineering - mixing and separation, polymer moulding
external and internal environment of buildings – wind loading, heating / ventilating marine engineering – loads on off-shore structures
environmental engineering – distribution of pollutants and effluents hydrology and oceanography – flows in rivers, estuaries, oceans meteorology – weather prediction
biomedical engineering – blood flows through arteries and veins
4.2 Simulation:
StarCD software is used for the combustion simulation of the Engine. The software is widely for many industrial and research applications. STAR-CD is replete with physics models specifically developed for efficiently simulating combustion, multiphase sprays and liquid films, heat and mass transfer, transient and turbulence effects, and moving boundaries. The Turbulence model used here to indicate the fuel and air flow is RNG t-Epsillon model. This model is obtained from RANS equation. This model is widely used for Engine related application. For the Spray brak up of fuel Reitz-Diwakar model with 3D domain was used. The Shell auto ignition model was used to specify the combustion rate.After giving boundary conditions and all the input parameters the analysis could be started. There are many turbulence equations which is to be included in the software to solve the problem. Here since the flow is turbulent the entire time epsilon model is used. Initially the mesh motion of all the parts of the engine is checked and a cold flow simulation is carried out.
4.2.1 Cold Flow Simulation:
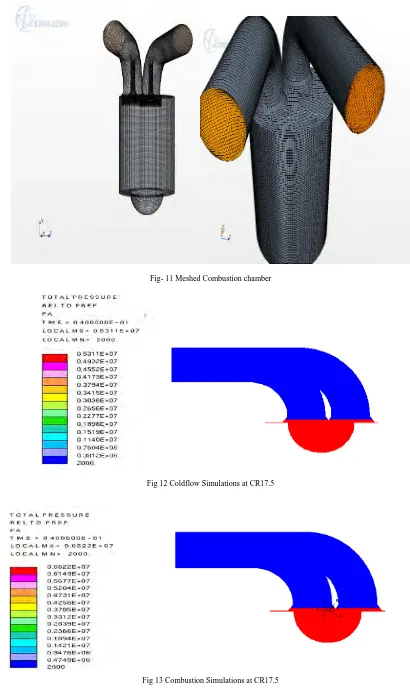
Cold flow simulation is a preliminary simulation process. It is mainly used for checking the mesh motion of the engine parts. In this simulation process the combustion process will not take place. Here the pressure and temperature rise in the cylinder during cranking can be measured. This is a technique for error proofing the engine model. The Clearance volume and the inlet and exhaust valves are clearly visible. The figure 12 above shows the cold flow simulation of temperature and pressure of the engine model the maximum pressure reached here is 53.13 bars it. The pressure variation corresponds to the colour variation. The red region being maximum and the blue region minimum. Both the inlet and the exhaust are assumed to be at atmospheric condition on 2 bars.
4.2.2 Combustion Simulation:
This is the actual simulation process. Here the start of ignition, end of the ignition, start of combustion, end of combustion and the injection pressure and velocity are specified. The following figure 13 below shows pressure distribution at 18 compression ratio. The maximum pressure reached here is 66.3 bar. Both the inlet and the exhaust are assumed to be at atmospheric condition on 2 bars. The combustion simulation here is done at 17.5 compression ratio
4.3 Cylinder Pressure Distribution:
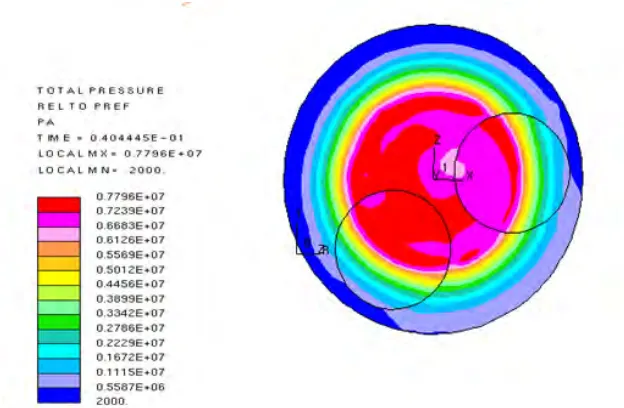
The Simulation shows the pressure distribution on the piston bowl at the power stroke at compression ratio of 18 and 17.5. In this software the piston movement can be stopped as and when it is required. To change the compression ratio the angle of piston movement is given the full 360 degrees. For 17.5 the piston movement is given as355.6 degrees. The figure (14, 15) below show the variations of the pressure on the cylinder head at 18, 17.5. Variations in pressure are shown with help of different colours. The STAR CD output shows that a maximum of 77. 9 bar at Compression ratio 18 and maximum pressure of 69.2 at 17.5 compression ratio. The maximum of the pressure points are centralized in the bowl of the piston head and the top surface of the cylinder has low pressure distribution.
4.4 Validation
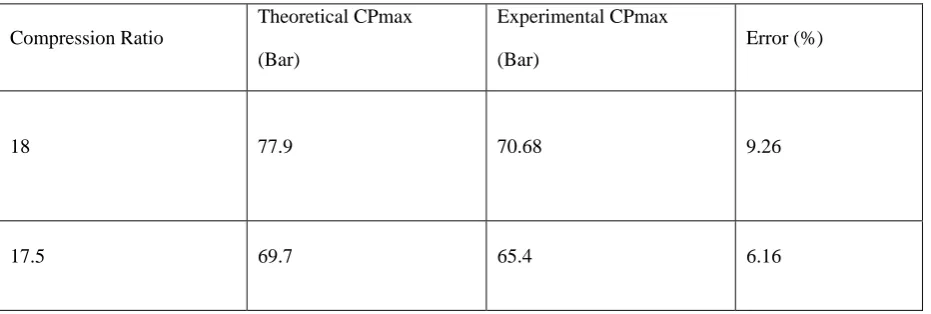
The maximum pressure obtained from the compression ratios 17.5 and 18 are taken from the from the combustion characteristics curves. The maximum pressure graph is obtained from the CP max curve. The maximum value is obtained from the peak pressure value for all the 720 degrees. This theoretical value is taken from the STARCD output file and compared.
5. Conclusion:
The performance combustion and emission study on the four strokes DI diesel engine under variable compression have revealed various conclusions. They are as follows
The brake power, brake thermal efficiency reduces as compression ratio is reduced The Specific Fuel consumption marginally reduces as the compression ratio reduces.
The maximum pressure , the rate of pressure rise and the net heat release values all reduces as the compression ratio is reduced
HC and CO emission gets reduced as the compression ratio is increased. CO2 emissions increase as the compression ratio is increased.
Maximum Brake power and brake thermal efficiency is obtained at 18 Compression ratios.
It can be concluded that at 17.5 to 16 compression ratios both high power (2.68-2.69K.W) and less emission NOx (719-1272 ppm), HC (38-40 ppm) CO2 (5.5-6%) is obtained hence optimum value of power and emission is reached
Table 1. Specifications of the Engine
Engine
Kirloskar TV1, single cylinder, 4 stroke, water cooled constant speed diesel engine
Rated Power 5.2 KW
Speed 1500 rpm
Bore 87.5 mm
Stroke 110 mm
Dynamometer Arm Length 185 mm
Compression ratio 12:1 – 18:1
Injection Timing 2.5 degrees Before and After TDC
Crank angle sensor Kubler, pulses per revolution : 360
Cylinder Volume 0.661 litre
Intake valve opens 4.5° BTDC
Inlet valve closes 35.5° ABDC
Exhaust valve opens 35.5° BBDC
Exhaust valve closes 4.5° ATDC
Original fuel injection 18° BTDC
Temperature sensor RTD, Digital PT 100
The Table 1 gives the specifications of Kirloskar TV1 Engine
Table 2 Exhaust Emission Analyser Specifications
Exhaust emission analyser
Model QROTECH 401
No. of emissions measured 5
Range CO: 0 – 9.9 %
CO2: 0 – 20 % HC: 0 – 9999 ppm O2: 0 – 25 % NOX: 0 – 5000 ppm
Nomenclature:
BP brake power CR15 Compression ratio 15:1
BTE brake thermal efficiency CR14 Compression ratio 14:1
CA crank angle HRR heat release rate
CO carbon monoxide HC hydro carbon
CO2 carbon dioxide NOx nitrogen oxides
CPmax cylinder pressure maximum O2 oxygen
CR compression ratio RPR Rate of Pressure Rise
CR18 Compression ratio 18:1 SFC specific fuel consumption
CR17.5 Compression ratio 17.5:1 VCR Variable compression ratio
CR16 Compression ratio 16:1
Table 3 – Comparison of Theoretical and Experimental Data
Compression Ratio
Theoretical CPmax
(Bar)
Experimental CPmax
(Bar)
Error (%)
18 77.9 70.68 9.26
17.5 69.7 65.4 6.16
The table shows the comparison of the theoretically obtained values of cylinder pressure and the Cylinder pressure values obtained experimentally values and the error between these two is calculated.
Fig 1 – Experimental Setup
This is a comparative graph showing the BSFC Vs brake power variations at various compression ratios
Fig 3 Comparative Graph BTHE Vs B.P at different Compression ratios
Fig – 4 Comparative Cylinder Pressure Graph at Different Compression Ratios (18, 16, 14)
Fig- 6 Comparative Rate Of Pressure Rise graph at various compression Ratios (18, 16, 14)
Fig-7 Comparative Carbon monoxide Graph
Fig -9 Comparative HC Graph
Fig- 11 Meshed Combustion chamber
Fig 12 Coldflow Simulations at CR17.5
Fig 15 Cylinder Pressure distribution at CR 17.5
References:
[1] Cao, Y., "Thermodynamic Cycles of Internal Combustion Engines for Increased Thermal Efficiency, Constant-Volume Combustion, Variable Compression Ratio, and Cold Start," SAE Technical Paper 2007-01-4115, 2007, doi:10.4271/2007-01-4115.
[2] Eric Tribbett, Ed Froehlich, Lex Bayer ”Effects of Ignition Timing, Equivalence Ratio and Copression Ratio on RDH Engine Performance”
[3] Ganeshan V. Computer Simulation of Internal-Combustion Engine Processes. Universities Press (India) Limited; 1996. [4] Ganeshan. V Advanced I.C. Engines 3rd ed, McGraw- Hill : 2008
[5] H. Raheman , S.V. Ghadge” Performance of diesel engine with biodiesel at varying compression ratio and ignition timing” Fuel 87 (2008) 2659–2666
[6] Heywood JB. Internal-combustion engine fundamentals. McGraw-Hill; 1988.
[7] Hiyoshi, R., Aoyama, S., Takemura, S., Ushijima, K. et al., "A Study of a Multiple-link Variable Compression Ratio System for Improving Engine Performance," SAE Technical Paper 2006-01-0616, 2006, doi:10.4271/2006-01-0616.
[8] Ishikawa, S., Kadota, M., Yoshida, K., Takahashi, K. et al., "Advanced Design of Variable Compression Ratio Engine with Dual Piston Mechanism," SAE Int. J. Engines 2(1):982-990, 2009, doi:10.4271/2009-01-1046.
[9] Jehad A.A. Yamin, Mohammad H. Dado “ Performance simulation of a four-stroke engine with variable stroke-length and compression ratio”, Applied Energy, 77 (2004) 447–463
[10] K. Muralidharan, D. Vasudevan “Performance, emission and combustion characteristics of a variable compression ratio engine using methyl esters of waste cooking oil and diesel blends” Applied Energy, 88 (2011) 3959–3968
[11] K.Manikanta, K.Anil, B.Manoj Prabhakar” Performance Analysis of Variable Compression Ratio Engine using Diesel” Proc. of. Int. Conf. on Advances in Mechanical Engineering 2010
[12] N.Seshiah,”Efficiency and exhaust gas analysis of variable compressionratio spark ignition engine fuelled with alternative fuels” Volume 1, Issue 5, 2010 pp.861-870
[13] O. Laguitton, C. Crua, T. Cowell, M.R. Heikal, M.R. Gold” The effect of compression ratio on exhaust emissions from a PCCI diesel engine” Energy Conversion and Management, Volume 48, Issue 11, November 2007, 2918-2924
[14] Olof Erlandsson, Gunnar Lundholm, Fredrik Söderberg and Bengt “Demonstrating the Performance and Emission Characteristics of a Variable Compression Ratio,Alvar- Cycle Engine”. SAE TECHNICAL PAPER SERIES 982682
[15] S. Jindal , B.P. Nandwana , N.S. Rathore , V. Vashistha “Experimental investigation of the effect of compression ratio and injection pressure in a direct injection diesel engine running on Jatropha methyl esters” Applied Thermal Engineering, 30 (2010) 442–448 [16] Rychter , Teodorczyk, Stone, Leonard, Ladommatos and Charlton (1992) “A Theoretical-study of a variable compression ratio
turbocharged diesel-engine”. P I MECH ENG A-J POW, 206 (4) 227 - 238.
[17] Schwaderlapp, M., Habermann, K., and Yapici, K., "Variable Compression Ratio - A Design Solution for Fuel Economy Concepts," SAE Technical Paper 2002-01-1103, 2002, doi:10.4271/2002-01-1103.
[18] Shivakumar , P. Srinivasa Pai , B.R. Shrinivasa Rao “Artificial Neural Network based prediction of performance and emission characteristics of a variable compression ratio CI engine using WCO as a biodiesel at different injection timings” Applied Energy, 88 (2011) 2344–2354
[19] Sivalakshmi, T.Balusamy, K.Ramamoorthy, and U.Udaykrishnan “Experimental Analysis of a Variable Compression Ratio Engine” Proc. of Int. Conf. on Recent Trends in Mechanical, Instrumentation and Thermal Engineering 2011