Exploring the Potential of Quality Tools in
Tire Retreading Industry: a Case Study
Bahmankhah Behnam1, Helena Alvelos1,2
1 Department of Economics, Management and Industrial Engineering, University of Aveiro, Portugal
2 Governance, Competitiveness and Public Politics (GOVCOPP), University of Aveiro, Portugal
[email protected], [email protected]
Abstract:
The general objective of this paper is to describe the application of quality tools in an uncommon industrial environment - tire retreading. The specific goals are to better understand the root causes of the main quality problems that result from the production process, to rank those causes taking into account the importance of their occurrence, to identify the critical step of the production process in view of the main problem identified, and to explore the potential causes of problems in that step.
The methodology used combined basic and new quality tools in order to identify, classify and analyse the main problems according to their priority (weight of importance. The tools used were Pareto Chart, Brainstorming, Fishbone Diagram and Matrix diagram.
The company where the study was carried out wasthe Ken Tire Industrial Complex, which is one of the biggest Tire Retreading Companies in Middle East. The data was collected during all the year of 2009 from quality and production records. The main problems were classified according the cost of defects that happen during the production process and the use of appropriate improvement quality tools is proposed in order to minimize the impact of defect causes in final products and semi-products.
Key Words: Pareto Chart, Brainstorming, Fishbone Diagram, Matrix Diagram, Retread Tire
1. INTRODUCTION
Retreading is the environmentally and cost effective process whereby selected and inspected worn tires, that called "casings,” receive a new tread. There are different processing techniques, which have the same ultimate objective - affixing a new tread through the application of heat, time and pressure. Basically, there are two types of technology used to retread a tire, Mould Cure (hot system) and Pre Cure (cold system). In this study the hot system [1] will be considered.
The retread industry has a close liaison with tire manufacturing industry and all the innovations/developments, especially in regard to materials and performance parameters get imparted automatically, into the retreading practices. The retreading process bonds new tread to the tire body using a process similar the manufacturing process of new tires [2, 1]. The quality control system and tools are world class but the actual implementation at the retread industry is often lacking, although there are some quality problems that could be minimized by the use of some well known quality tools.
Regardless the type of technology, production process of tire retreading is very sensitive due to many factors as the contact of buffed surface with oxygen, which cannot exceed some minutes, pollution, humidity, temperature, pressure (water, steam and air), among others. Although the process can be considered rather complex, it is believed that it can be improved through the use of some well known quality tools.
This paper begins with a literature review about the quality tools that are thought to be appropriate in the case of the company studied. Afterwards, the case study starts by shortly describing the company and its production system, followed by the identification of the main problems to be addressed (through the use of Pareto chart), their analysis (through the use of fishbone diagram) and their classification (through the use of matrix diagram). The analysis continues with the discussion of the results and the development of a second fishbone diagram, which can be the base for a future intervention in order to minimize the quality problems related to the repairing stage of the process. Finally, some conclusions and future work are described.
2. LITERATURE REVIEW
Quality tools can be used for problem identification, problem definition and problem solving or improvement. New quality tools were developed to complement the seven basic tools in order to achieve better results. Applying those tools requires that the responsible person for their use is aware about them. Subsequently, some information about Pareto Chart, Brainstorming, Fishbone Diagram and Matrix Diagram is presented, as these are the main quality tools applied in the case studied.
The Pareto chart is a very useful quality tool that aims at separating the important from the trivial. The chart is named after Italian economist/sociologist Vilfredo Pareto (1848-1923). It consists “a series of bars whose heights reflect the frequency or impact of problems. The bars are arranged in descending order of height from left to right. This means the categories represented by the tall bars on the left are relatively more significant than those on the right” [8, 9]. It states that about 80 percent of the problems come from 20 percent of the causes and it is extremely useful to identify the factors that have the greatest cumulative effect on the system, and will able to classify them according the weight of effect to focus on them. Pareto chart is an appropriate tool to use when the process under investigation produces data that are broken down into categories [8, 9], and to create a Pareto Chart, meaningful data have to be collected and categorized. When the list of defects contains a mixture of some that might have extremely serious consequences and others of much less importance, one of two methods can be used: (i) a weighting scheme to modify the frequency of counts or (ii) use the frequency Pareto chart analysis together with a cost or exposure Pareto chart [12]. Nevertheless, there are many types of the basic Pareto Chart which are widely used even in nonmanufacturing applications of quality improvement methods [12] in order to identify the majority of problems that may occur because of minority causes. “In general, the Pareto Chart is one of the most useful of the “magnificent seven” and its applications to quality improvement are limited only by the ingenuity of the analyst”.
Brainstorming is a method used in organizations as a group activity to generate a large number of creative and new ideas about a specific problem or topic [4, 5, 6]. Brainstorming is not a technique for evaluating ideas nor is it the only method available for generating ideas [7]; it is not a complete creative process but its results can be assumed to be the input of other quality tools such as fishbone diagram. This technique was developed in 1939 by Alex Osborn, executive vice-president of the advertising company Batten, Barton, Durstine and Osborn (BBDO). There are many ways both to conduct a brainstorming session and to compile the information from the session. The generation of ideas can take place formally or informally but flexibility should exist when choosing an approach and the basic rules should be followed [16].
In formal process for gathering the information by brainstorming method, a group of people with different perspective about the topic will assemble in a room around the table to start discussion about the specific problem or topic [16]. All of the ideas or questions will be written down in the appropriate way to be seen by everyone (for example on white board). To facilitate the brainstorming session it is better to follow the basic rules with explaining them to the members, also for a most effective meeting the role of leader is important in making friendly and appropriate environment for the group members. For example leader by following some guidelines who already prepared them before, will help them to feel free themselves also will help them to think widely even to modify other members’ suggestions. Problem selection, identifying cause and effect, group consensus efforts, and many others are good examples of the use of Brainstorming [9, 13].
The categorization of the causes depends on the case under study, but it is often appropriate to consider six areas or main causes that can contribute to an undesirable characteristic, response or effect. They are: materials, machine, personnel, measurement, method and environment. Each one of these items can then be investigated for sub-causes [16] by brainstorming with the group members that will identify them.
“Furthermore, the construction of a fishbone diagram as a team experience tends to get people involved in attacking a problem rather than in a fixing blame” [12] but it is easy to understand by everyone in work place as it is the only tool of basic seven tools that is not based on statistics and provides a graphic view of the entire process that is easily interpreted by the brain. This technique can be useful, for example, to establish the factors to consider within a regression analysis, Design Of Experiments [16] or Matrix Diagram.
In 1988, the seven tools developed by the Japanese Shigem Mizuno were introduced to the United States with a book entitled Management for Quality Improvement: The New Seven QC Tools [10]. Among them it can be found the Matrix Diagram, which turned to be an important tool in the manufacturing world.
The Matrix Diagram is a chart that can be used to organize large quantities of data relating to process problems [10] and classifies them according to their priority. A better understanding of the opportunities for improvement can then result from this exercise.
Matrix Diagrams are also used to present the results of multivariate analysis of data and is the most mathematically sophisticated quality tool, particularly for customer segmentation [14]. The diagram can be shaped in a few different ways such as: L shaped, T shaped, X-shaped, C-shaped, or three-dimensional, inverted Y-shaped. Each of them has its own purpose but the L-shaped matrix is the most commonly used one.
3. CASE STUDY
The case presented in this study was carried out in Ken Tire Industrial Complex (one of the biggest retread companies in Middle East), located in Tabriz-Iran. The company is working with both of Hot and Cold retreading technology to produce the several retread tires in passenger, light truck and truck tire size. The company employs 123 workers and produces more than 180,000 loops retread tires annually. In order to reduce the quality problems faced inside the company, it was decided to implement some appropriate quality tools in the organization. Next, there is a short description of the hot system production process, which is the object of the case study.
3.1 PRODUCTION PROCESS
According to the Tire Retread Information Bureau, the steps of the production process system in mould cure or hot system can be briefly described as follows [1, 2]:
• Primary Inspection: Each agency has established the own safety specifications. For example, the regulation standards for aircraft and school bus tires are different. Generally, the worn casing, cuts, punctures and overall damage are assessed before the tire is processed for retreading and there are lot of available inspection equipment and machine to help the inspector, depending on the company technology and investment.
• Buffing: After inspection, tires have the old tread mechanically removed on high speed buffers; buffing removes the unwanted or worn old tread and the technique of work depends on the design of the tire.
• Skiving: The area of the damage has to be completely removed before retreading the tire and the tire skiving process is what is use to remove any hidden defects (by different type of air tools) that the buffer could not remove.
• Repairing: Sometimes there are some injuries in the casing that should be repaired, if the damage is within acceptable limits (by different type of air tools, thermo press and other special equipment). The repair operation is a crucial step in the retread process which will guarantee the performance of retread tire as same as new tire.
it is forbidden to cement the casing because of some ingredients such as solvents that can lead to tread separation in curing or even under service and also because of environment protection.
• Filling: In this step some of the repaired places and skived area will fill (by mini extruder machines) with compound to prepare the casing in uniform shape to extruder step.
• Extruding: Uncured tread rubber is applied by extruder machine to the crown area of the buffed casing. The application of tread in the mould cure retread process or hot system is very similar to that of new tire manufacture.
• Curing or mould curing process: In this step the prepared casing, built up to the correct diameter with uncured rubber material is placed into a mould. When the mould is closed and the tire body inflated to the proper pressure, the swelling of the casing will help the uncured material to give the shape of the mould, forming the tread design.
In the next section, it is described the use of the Pareto chart in order to identify the main quality problems in what respects to cost of the defects.
3.2 IDENTIFYING THE MAIN QUALITY PROBLEMS THROUGH PARETO CHART
Road hazard is the most common cause of tire failure (38%), with debris and operational issues next (32%), then excessive heat (30%). The manufacture defects are still responsible for 16% of the tire failure. In order to reduce this number, the main causes of those defects have to be identified.
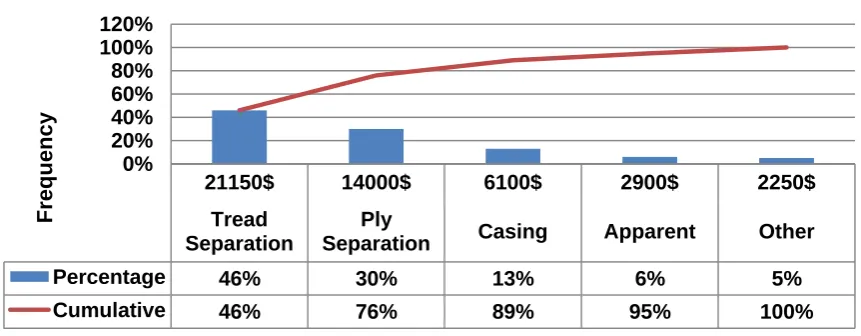
One of the ways to identify the existence problems and issues in work place is referring to recorded documents and explicit tables listing the causes and their frequency as a percentage for sorting them in possible categories of defects through Pareto Chart as a useful tool to separate the important from the trivial [9]. Pareto Chart, as a visual aid, clearly shows the relative magnitude of defects and can be used to identify opportunities for improvement [11]. The Pareto Chart presented in Figure 1 represents the cost of defects for final products and semi-products during the production process in Ken Tire Co. for the year of 2009.
Figure 1: Pareto Chart for Cost of Defect in Most Common Type.
According to the Pareto Chart, the majority of identified problems are Tread Separations and Ply separations, which together represent 76% of the identified problems. In the next section, it is performed an analysis of the causes of the first of those problems – Tread Separation - during the production process through Fishbone Diagram.
3.3 ANALYSING TREAD SEPARATION PROBLEM THROUGH FISHBONE DIAGRAM
As a first step to run a Fishbone Diagram session it is better to create a good and experienced team from several related field of work (i.e., experts, affected people, process owners, etc...) to be sure of well definition and identification of the various causes and sub-causes in each of the major categories [5, 12] by group members.
21150$ 14000$ 6100$ 2900$ 2250$
Tread Separation
Ply
Separation Casing Apparent Other
Percentage 46% 30% 13% 6% 5%
Cumulative 46% 76% 89% 95% 100%
0% 20% 40% 60% 80% 100% 120%
Frequency
The brainstorming group that analysed the causes of the problem was composed by eight people including production and planning manager, quality manager, storage manager, quality supervisor, production foreman, repairing & maintenance manager, sales manager and a representative of top management who at the same time, was team leader too.
The room was prepared including a U shape table and the session started in friendly environment, being everyone comfortable and in relaxed mood. The purpose of the session was outlined by the leader and then the session continued following the basic rules of procedure [16]. The work continued by the discussion about ideas and suggestions of the group members that wrote them down on papers. At the final stage, conclusion, the final review happened, some identified sub-causes were omitted whereas some new ones were added, creating a consensual result.
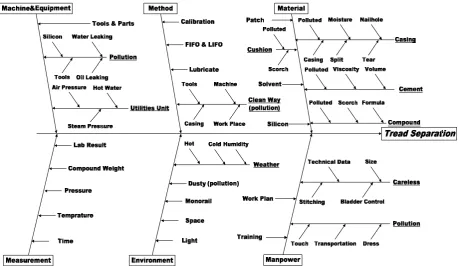
Figure 2 shows the Fishbone Diagram based on the six usual main causes, in Tire Retreading production line (hot system) for tread separation defects in Ken Tire Co. The structure that is imbedded in the explanation of fishbone diagram construction and analysed in the next few pages is based on Free-Throwing Cause-and-Effect Diagram (Timothy Clark, 1997)[11].
Figure 2: Fishbone Diagram based retread tire production defects in hot system.
After preparing the diagram the next step is focused on ranking the identified causes and sub-causes according to their priority in order to minimize the non desirable effect. The tool that was chosen for this purpose was the Matrix Diagram, which inputs are the causes identified in Fishbone Diagram and that was based on the voice of quality and engineering inside the company.
3.4 MATRIX DIAGRAM BASED ON FISHBONE DIAGRAM
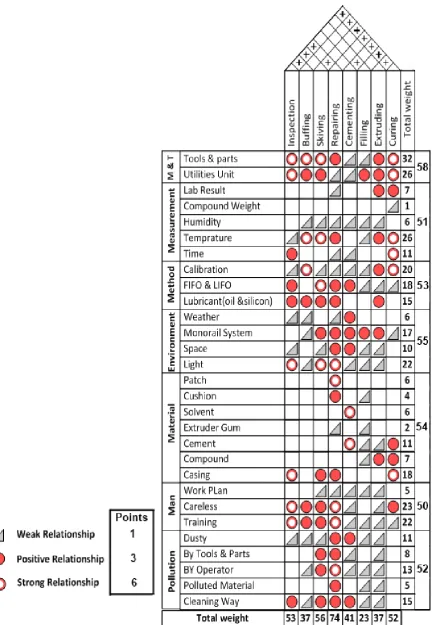
Matrix Diagram can be used to classify the fishbone diagram causes and sub-causes and rank them according their priority and importance [10]. In this case the L–matrix format was chose, based on the six main causes already mentioned, in order to show the relationship between the list of causes as a voice of quality and engineering requirement against the production process steps inside the company. The result of Matrix Diagram can help on performing a comparative evaluation on the causes and sub-causes based on Tread Separation problem, evidencing the weight of effects and ranking them according their value [10].
3.4.1 Special characterization of case study
The Matrix Diagram presented in Figure 3 was built taking into account the following additional information:
•
According to Fishbone Diagram (as shown in Figure 2) the Pollution as a sub-cause is common item in all of the main causes, what shows the importance role of this criterion. In tire and tire retreading industry the pollution is well known as one of the main enemies for productions during the process steps, and because of this, pollution which is a sub-cause in fishbone diagram separated as a main cause for Matrix Diagram.3.4.2 Discussing the result of Matrix Diagram
According the result of Matrix Diagram for tread separation problem in retread tire process, Machine and Equipment have the highest effect among the other main causes (also Tools & Parts have the highest effect among all of the sub-causes). In other side, comparative evaluation among the production process steps based on tread separation shows that repairing has the highest weight among others.
Matrix Diagram classified all the causes and production process steps according their effect in tread separation problem. Taking into account these results, the Brainstorming team members need to make an improvement decision to follow the result of the work. The main aim of this stage is to focus on repairing step with more details, as it is the procuction process step which has the highest score. The team members suggest two options in this way, first to analyse all of the possibilities which lead to this problem in Repairing station by Fishbone Diagram with all of the details, secondly trying to modify and improve the existence repairingprocedure and method of work by adding or omitting some regulations and limits. Figure 4 shows the Fishbone Diagram created by brainstorming group and focusing on details just in repairing step of process, as this was the alternative selected.
Figure 4: Fishbone Diagram based retread tire production defects just in Repairing Station.
Also about the Parts & Tools as a main sub-causes and equipment, company decided to make more control plan such as mechanical and technical checklist (daily, weekly and monthly) with new policy and view to assessment, analyse, record and improve.
4. CONCLUSIONS AND FUTURE WORK
This paper addressed the use of some quality tools in a tire retreading company. The quality tools applied to the company data allowed establishing a list of potential causes for the occurrence of the tread separation defects caused by during the repairing step. Those causes should be analysed in order to propose effective actions that will lead to quality improvement. The quality tools used – Pareto Chart, Fishbone Diagram and Matrix Diagram seamed to be appropriate to the type of data and study carried out.
As future work, the quality improvement plan based on the results obtained should be implemented and evaluated and a similar study should be done for the second main identified problem – ply separation. Note that ply separation and tread separation together, are responsible for 76% of the cost of defects in Ken Tire Industrial Complex.
REFERENCES
[1] Siegfried, G. (2000). An International View on Tyre Retreading, Vale bridge publications, United Kingdom
[2] Lindquist, K.; Wendt, M. (2009). Retreaded Tire Use and Safety: Synthesis, Proceeding of Washington State Department of Transportation, 2–16
[3] Dicander, D. (2004). Quality Function Deployment, Proceedings from the 2nd seminar on Development of Modular Products, Dalarna University, Sweden, 49–54
[4] Devine, D. J.; Clayton, L. D.; Philips, J. L.; Dunford, B. B.; Melner, S. B. (1999). Teams in organizations: Prevalence, characteristics, and effectiveness. Small Group Research,Vol. 30, 678–711
[5] Rietzschel, E. F.; Nijstad, B. A.; Stroebe, W. (2006). Productivity is not enough: A comparison of interactive and nominal brainstorming groups on idea generation and selection, Experimental Social Psychology, Vol. 42, 244–251
[6] Sutton, R. I.; Hargadon, A. (1996). Brainstorming groups in context. Administrative Science Quarterly, Vol 41, 685–718
[7] Osborn, A. F. (1963). Applied Imagination: principles and procedures of creative problem solving, Charles scribner’s & sons, New York
[8] Scholtes, P. R.; Joiner, B. L.; Streibel, B. J. (1988). The Team Handbook, Joiner Associates, Madison, 2–25
[9] Goetsch, D. L.; Davis, S. B. (1997). Introduction to Total Quality Management, Prentice Hall, Upper Saddle River, 381–390 [10] Gitlow, H. S. (1990) Planning for Quality, Productivity, and Competitive Position. Illinois: Business One Irwin, 102–111 [11] Evans, J. R.; Lindsay, W. M. (2008). The Management and Control of Quality, Thomson Higher Education, USA, 659–676 [12] Montgomery, D. C. (2000). Introduction to Statistical Quality Control, John Wiley & Sons, Inc, USA, 177–184
[13] Parry, I. J.; Tranfield, D.; Smith, S.; Foster, M.; Wilson, S. (1988). Reconfiguring your organisation: a teamwork approach, Team Performance Management, Vol. 4, No.4, doi: 10.1108/13527599810224633, 166–176
[14] Özgener, Z. (2003). Quality function deployment: A teamwork approach, Total Quality Management & Business Excellence, Vol. 14, No.9, doi: 10.1080/1478336032000090897, 967–979
[15] Tague, N. R. (2004). The Quality Toolbox, ASQ Quality Press, Milwaukee Wisconsin, 338–345
[16] Breyfogle, F. W. (2003). Implementing Six Sigma: Smarter Solution Using Statistical Methods, John Wiley & Sons, Inc, Austin, Texas, 52–64 and 111–140