R E S E A R C H
Open Access
Reference bias: presentation of extreme health
states prior to eq-vas improves health-related
quality of life scores. a randomised cross-over trial
Steven McPhail
1,2,3*, Elaine Beller
4, Terry Haines
2,5,6Abstract
Background:Clinical practice and clinical research has made a concerted effort to move beyond the use of clinical indicators alone and embrace patient focused care through the use of patient reported outcomes such as health-related quality of life. However, unless patients give consistent consideration to the health states that give meaning to measurement scales used to evaluate these constructs, longitudinal comparison of these measures may be invalid. This study aimed to investigate whether patients give consideration to a standard health state rating scale (EQ-VAS) and whether consideration of good and poor health state descriptors immediately changes their self-report.
Methods:A randomised crossover trial was implemented amongst hospitalised older adults (n = 151). Patients were asked to consider descriptions of extremely good (Description-A) and poor (Description-B) health states. The EQ-VAS was administered as a self-report at baseline, after the first descriptors (A or B), then again after the remaining descriptors (B or A respectively). At baseline patients were also asked if they had considered either EQ-VAS anchors.
Results:Overall 106/151 (70%) participants changed their self-evaluation by≥5 points on the 100 point VAS, with a mean (SD) change of +4.5 (12) points (p < 0.001). A total of 74/151 (49%) participants did not consider the best health VAS anchor, of the 77 who did 59 (77%) thought the good health descriptors were more extreme (better) then they had previously considered. Similarly 85/151 (66%) participants did not consider the worst health anchor of the 66 who did 63 (95%) thought the poor health descriptors were more extreme (worse) then they had previously considered.
Conclusions:Health state self-reports may not be well considered. An immediate significant shift in response can be elicited by exposure to a mere description of an extreme health state despite no actual change in underlying health state occurring. Caution should be exercised in research and clinical settings when interpreting subjective patient reported outcomes that are dependent on brief anchors for meaning.
Trial Registration:Australian and New Zealand Clinical Trials Registry (#ACTRN12607000606482) http://www.anzctr. org.au
Background
Over past decades, clinical practice and clinical research has made a concerted effort to move beyond the use of clinical indicators alone and embrace patient focused care[1]. Along this line, the evaluation of health-related
quality of life (HRQoL) has great benefit in revealing how each patient views their own health state. Subjec-tive HRQoL evaluation has particular importance amongst patient groups suffering from chronic, degen-erative or terminal conditions where the aim of health interventions are to improve quality of life rather than for a curative effect[2,3]. It is not surprising then, that the use of generic HRQoL evaluation instruments, such as the Euroqol-5D (EQ-5D), have become increasingly
* Correspondence: [email protected]
1
Centre for Functioning and Health Research, Ipswich Road, Woolloongabba, Queensland, Australia
Full list of author information is available at the end of the article
popular as a primary outcome measure in clinical trials and as a primary instrument for economic evaluation through cost-utility analysis[4].
Concerns have been raised about the validity of mak-ing comparisons between HRQoL evaluations taken at different time points as change in ones understanding or perception of the HRQoL construct may occur between assessments [5-8]. If a respondent were to change their understanding of what components are included in the construct of HRQoL (reconceptualisa-tion), or the relative importance of certain components of HRQoL in relation to the other components (reprior-itisation) or change their internal perception of the rela-tive value of certain health states in relation to others (recalibration), then each evaluation may not necessarily be measuring the same concept, with the same value system on the same scale despite consistent use of the same patient reported outcome [5-7]. This phenomenon has been given the term‘response shift.’
Response shift is generally considered to be part of naturally occurring adaptive processes and may help individuals adjust to living with poor health states and thus may be a desirable coping mechanism or even the goal of some treatments[6,7,9-11]. However, it also threatens to invalidate comparisons of pre and post intervention assessments or assessments taken over mul-tiple time points in the trajectory of a chronic disease, despite use of a standardised instrument[6,7,9,11-13]. For this reason a number of methods to detect response shift, such as the ‘then-test’(a retrospective report of a previous health state from the respondent’s current per-spective)[5,8,11,14,15] and ‘structural equation model-ling’ (mathematical modelling to detect changes in factor solutions and variance-covariance matrices over time)[12,15,16] have been developed to evaluate response shift between assessments. However, these methods can often be time consuming, complex or bur-densome on patients[5,7,11,15]. Detailed discussion of methods to detect response shift has previously been described[5,7,11,15,17].
It may not be possible (or desirable) to eliminate adap-tive processes that contribute to response shift[5,7,11]. However, a potentially preventable (and undesirable) response shift artefact may occur as a result of subjective HRQoL appraisal processes. This may occur when a respondent does not give consistent consideration to ques-tions used to evaluate their HRQoL at each assessment point. Subjective scales dependent on brief anchor descrip-tions to give meaning to the scale may be particularly prone to inconsistent consideration of the instrument, as a change in consideration of one or both anchors may lead to a substantial difference in response[11].
The EQ-VAS is the health state rating scale from the popular EQ-5D generic health-related quality of life
instrument. The EQ-VAS includes a 100 point visual analogue rating scale with a bottom anchor of ‘worst imaginable health’and a top anchor of‘best imaginable health’[18]. The EQ-VAS has favourable empirical evi-dence supporting its sensitivity to change, validity and reliability[19-27]. However, an investigation of EQ-VAS use in rating multiple hypothetical health states found that the rating given to common moderate health states were affected by the context in which they were pre-sented[28]. It was noted that moderate health states were assigned lower values when presented in the con-text of more mild (better) health states and assigned higher values when presented in the context of more severe (worse) health states [28]. This is not an isolated finding for rating scales[29].
There is also evidence from other fields that framing a question to focus on positive or negative attributes can yield different responses despite no difference in logical meaning[30-33]. Empirical investigations of the framing effect generally suggest respondents demonstrate prefer-ence for an option with a positive valprefer-ence rather than negative[31-33]. A simple example includes respondents reporting ground mince as ‘tastier’when labelled as 75% lean, rather than 25% fat[34]. Framing effects have been applied in a wide range of fields including politics, con-sumer behaviour and health[30-34].
Respondents completing health state rating scales (like the EQ-VAS) are generally not required to rate multiple hypothetical health states and intentional framing tech-niques are not routinely employed. However, a similar unintentional reference type bias may occur due to social comparisons or other life events[11].
Consider a 65 year old woman who is receiving treat-ment in hospital after suffering a stroke. She may rate her health at this time with reference to surrounding hospital patients who are very unwell. This patient may report her health as 60 out of 100 on the EQ-VAS immediately prior to discharge from an inpatient rehabi-litation facility; after considering how much better she is than other patients in very poor health states (near the bottom of the scale). However, immediately after dis-charge into the care of family, this patient may report her health as 45 out of 100 on the EQ-VAS after con-sidering how much worse her health is in comparison to healthy peers in the community (who may be near the top of the scale). An independent observer may infer that a decline in health state of 15 points has occurred (despite potentially no reduction in the patients’ actual health or HRQoL).
this type of artefact may have serious implications. In clinical practice this may complicate attempts to evalu-ate whether a health intervention or disease has resulted in meaningful change in a person’s HRQoL. Of no less importance would be the effect that an inaccurate repre-sentation of change would have during a randomised trial if all groups were not equally exposed to stimuli prompting a response shift[11]. For example, an inter-vention group may be required to attend a hospital, clinic or group intervention session resulting in expo-sure to individuals experiencing extremely poor health states, while a control or comparator group may not be given this same exposure[11].
Despite the previous work by Krabbe and colleagues on multi-item visual analogue scale ratings,[28] there is currently no empirical evidence indicating whether an acute shift in response to a health state scale such as the EQ-VAS may result from a reference type bias when individuals are rating their own health state. The pur-pose of this study is to illustrate that respondents may not give consistent consideration to the health states that give meaning to the EQ-VAS, and investigate whether merely asking respondents to consider a detailed descriptors of an extremely good health state (Description-A) and extremely bad health state (Descrip-tion-B) between assessments induces an acute shift in their own EQ-VAS rating. The set of descriptors used as Description A and B are presented in Additional file 1.
It was hypothesized that respondents frequently would not consider what the EQ-VAS scale anchors represent during initial completion of this scale. Furthermore, it was considered likely that many participants would change their overall HRQoL report after consideration of the extreme health descriptors (Additional file 1). It was hypothesized that consideration of extremely poor health descriptors would cause many respondents to increase their reported HRQoL score as they would con-sider their current health state to be further away from the lower end of the scale, while some would lower their reported HRQoL considering that their current health state was actually closer to lower end of the scale. In the same way after considering descriptors of an extremely good health state many would move their score lower, while some would move their score higher.
It was also considered possible that an order effect may occur whereby patients’responses may be depen-dent not only on the extreme health state descriptors themselves, but the order in which they were provided. Previous investigations dealing with HRQoL reporting and order effects have generally found no significant order effect[35-38]. However, given the novel nature of this investigation in providing extreme health state descriptors between assessments, this investigation also aimed to examine whether the order in which these
descriptors were provided affected the pattern of responses.
Methods
Design
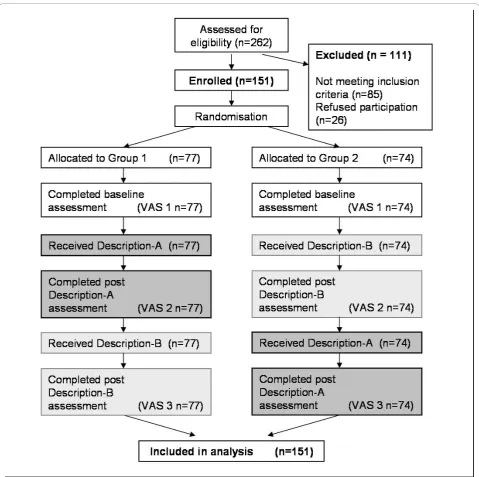
A two group, randomized crossover design methodology trial was implemented (Figure 1). After completing base-line measurements, patients randomized to group one received Description-A first (this involved being asked to consider the set of good health state descriptors) then Description-B (this involved being asked to con-sider the set of poor health state descriptors). Patients in group two received Description-B first, then Descrip-tion-A. There was no washout period between the pro-vision of each of the two health state descriptor sets, as the order effect and effect of receiving both sets of descriptors were under investigation.
Participants and setting
One hundred and fifty-one patients admitted to the rehabilitation unit of a tertiary hospital in Brisbane, Aus-tralia, participated. This population was selected for this investigation for several reasons. The focus of health interventions for this patient group generally focuses on treatments and therapies aiming to maximise function and HRQoL, thus making HRQoL evaluation integral to clinical and research assessments within this type of patient population[3]. This population is also potentially at risk of changing points of reference when completing subjective patient reported outcomes due to social com-parisons or life events that have lead them to be in need of hospitalisation[11]. For inclusion in the study patients were required to be able to communicate effectively in English and have basic cognitive functioning intact as indicated by a Mini Mental State Examination (MMSE) score of >23/30[39].
Measures
The primary outcome measure was the EQ-VAS. This is a continuous measure of overall health state using a 100 point visual analogue scale where 0 represents the worst imaginable health and 100 represents the best imaginable health[18]. This outcome measure was used a total of three times for all participants (Figure 1). The EQ-VAS was first completed at baseline (VAS 1) as a control for comparison purposes, then for a second time (VAS 2) after each group had received their first set of descriptors (Description A or B depended on group). The EQ-VAS was then completed for a third time after the crossover (VAS 3) after each group received the remaining set of descriptors (Description B or A respectively).
whether they had “considered what best (and worst) imaginable health may be like.” This was recorded as a binary yes/no answer for each anchor. If participants had considered what a best imaginable or worst imagin-able health state may be like for either EQ-VAS anchor they were asked to describe in words what they had considered. Their description was recorded verbatim. After receiving each set of descriptors (Description-A or Description-B), patients were also asked if the health state described was more extreme than that which they had previously considered to be the end point on the
EQ-VAS (0 or 100 respectively). A dichotomous response to this question (yes/no) was also recorded as secondary outcome measure.
Baseline patient demographics and their Functional Independence Measure score[40] were also collected from the medical record for the purpose of describing the sample.
Intervention (Description-A and Description-B)
state (Additional file 1). Description-B involved asking the participant to consider a set of descriptors for an extremely poor health state (Additional file 1). Each set of descriptors required less than one minute to read at a comfortable pace. The descriptors provided to the patient were a compilation of the respective best and worst descriptors for each health component used in the Assessment of Quality of Life (AQoL) instrument[41]. It is noteworthy that both sets of descriptors were not intended to affect the patients underlying health, and thus were health evaluation methodology interventions rather than intended as any kind of clinical intervention. The descriptors were intended to promote more careful consideration of a range of possible HRQoL attributes by the respondent immediately prior to assigning an EQ-VAS value to their own health state.
Procedure
Ward staff identified potential participants who were then approached by a research assistant (RA1). RA1 explained the study and sought informed written con-sent. RA1 was not aware of the randomisation sequence (calculated using computerised random number genera-tion by a blinded member of the investigative team and stored in a locked filing cabinet). Consenting partici-pants were then allocated to group (one or two) in order of the random sequence according to their partici-pant number by a separate research assistant (RA2). Before receiving either set of descriptors, patients in both groups completed a baseline self-report of the EQ-5D questionnaire including the EQ-VAS (VAS 1), and the relevant secondary outcomes.
Group one received the health state descriptor sets in the alternative order to group two (Figure 1). After receiving being asked to consider the first set of health state descriptors (Description A or B depending on group), participants completed the assessment measures which included a second self-report of the EQ-VAS (VAS 2) and the secondary outcome measures. Once partici-pants had completed these assessment measures the remaining set of health state descriptors (Description B or A respectively) was immediately given and patients then completed a third and final self-report of the EQ-VAS (EQ-VAS 3) and the relevant secondary outcomes.
The assessments and health state descriptors were administered in this way, only minutes apart, to elimi-nate the possibility of an actual change in underlying health state. This investigation was approved by the Princess Alexandra Hospital and The University of Queensland’s Human Research Ethics Committees.
Power analysis
When examining the main effect comparison of Description-A versus Description-B on EQ-VAS scores
after each set of descriptors, this experiment had 90% power to detect a conservative between-groups differ-ence in VAS of 3 points assuming a standard deviation of 17.5 using total sample size of 150 and a two tailed alpha of 0.05. Because of the correlation of responses within patients, this sample size had >90% power to detect a similar change in VAS when examining the within-group main effect of providing both sets of descriptors between baseline (VAS 1) and the final fol-low-up assessment (VAS 3).
Data Analysis
Demographic and baseline EQ-VAS data were tabulated (Table 1). Raw data was checked for normality graphi-cally and using tests for skew and kurtosis[42,43]. Differ-ence between groups in baseline EQ-VAS score (VAS 1) was examined using an unpaired t-test. Three change scores for the EQ-VAS were calculated. These were the difference between the baseline VAS and the EQ-VAS completed after receiving the first set of descriptors (VAS 2 -VAS 1), the difference between EQ-VAS after the first set of descriptors and the final EQ-VAS after the second set of descriptors (VAS 3 -VAS 2) and the difference between the baseline EQ-VAS and the final VAS after the second set of descriptors (VAS 3 -VAS 1). The number (and percentage) of respondents who changed their EQ-VAS by 5 points or more (in either direction) after exposure to the good and poor health state descriptors was calculated (Table 2). These calcula-tions were done in order to evaluate the effect of the health state descriptors at an individual level (as
Table 1 Participant Demographics, baseline EQ-VAS and Functional Independence Measure scores
Group 1 n = 77
Group 2 n = 74
Age - median (IQR) 80 (74-86) 79 (73-86)
Mini Mental State Examination - median (IQR) 27 (25-29) 26 (25-29) Diagnosis category
Stroke 7 (9%) 9 (12%)
Other Neurological 2 (3%) 3 (4%)
Orthopedic (non elective) 23 (30%) 20 (27%)
Orthopedic (elective) 1 (1%) 2 (3%)
Other Musculo-skeletal 2 (3%) 2 (3%)
Cardiac 3 (4%) 3 (4%)
Pulmonary 8 (10%) 5 (7%)
lower limb amputation 17 (22%) 16 (22%)
Other Medical Condition 8 (10%) 8 (11%)
Other Geriatric Condition 7 (9%) 6 (8%)
Functional Independence Measure
Cognition - median (IQR) 33 (31-34) 32 (30-33)
Motor - median (IQR) 61 (44-68) 59 (47-70)
opposed to group mean differences). This analysis was considered important as analysis of group means would only reflect a systematic change (i.e. a general increase or a general decrease in EQ-VAS scores). However, some individuals may have reported positive shifts while others report negative shifts (depending on their response to the health state descriptors). If shifts in response occurred in a less uniform way such as this, these changes may cancel one another out resulting in no significant mean change. Such a finding may mask response shifts that may have been interpreted as mean-ingful change in a clinical setting where decisions are likely to be based on an individual patient’s reported change. This is in contrast to changes in group means which are more likely to affect the interpretation of clin-ical trial findings. To investigate mean EQ-VAS changes two mixed 2x2 ANOVAs were also conducted.
The first ANOVA investigated whether providing the good health descriptors had a different effect than provid-ing the poor health descriptors and whether this was dependent on the order in which the descriptors were pro-vided. To examine this, the first ANOVA investigated the main effects of Description (A versus B) and sequence (i.e. whether participants were in the group who received best or worst health descriptors first), and an interaction effect between them. This analysis examined the change between the EQ-VAS rating taken after respondents were exposed to each set of health state descriptors (after Description A or B) and the EQ-VAS rating taken immediately prior to the provision of that set of descriptors.
The second ANOVA investigated whether the final EQ-VAS rating after the provision of both good and poor health state descriptors (VAS 3) was different to the baseline EQ-VAS report (VAS 1) and whether this was dependent on the order in which the descriptors were provided. To examine this, the second ANOVA investigated the main effects of total change in HRQoL (VAS 3 -VAS 1) and sequence (i.e. group), and the interaction between total change in HRQoL and sequence (i.e. group).
Results
One hundred and fifty-one patients were enrolled in the study. All participants completed each assessment and were included in analysis. The groups’ baseline demo-graphics were comparable (Table 1) with no mean dif-ference in baseline EQ-VAS between groups (p = 0.30).
Immediately after completing their baseline EQ-VAS, 74 (49%) participants reported that they had not consid-ered what best imaginable health (top scale anchor) may be like and 85 (66%) had not considered what worst imaginable health (bottom scale anchor) may be like. Of those participants who did think of a best imaginable health state, 59 (77%) thought the set of good health descriptors (Description-A) was more extreme (better) than the health state they had previously considered as the top scale anchor. Of those participants who did think of a worst imaginable health state, 63 (95%) thought the set of poor health descriptors (Description-B) were more extreme (worse) than the health state they had previously considered as the bottom scale anchor.
The number of participants in each group who chan-ged their EQ-VAS report by 5 points or more after exposure to each of the health state descriptors are pre-sented in Table 2. The majority of patients in both groups either increased or decreased their VAS score after being exposed to the good and poor health state descriptors. When comparing the final EQ-VAS score after both sets of health descriptors had been provided (VAS 3), to their baseline score (VAS 1) 106 (70%) of all participants had a final health VAS self-report that dif-fered by 5 points or more from their baseline VAS; 51 were from group one and 55 were from group two.
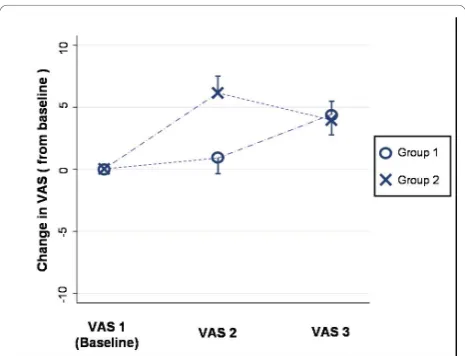
The first ANOVA investigating whether providing the good health descriptors had a different effect than pro-viding the poor health descriptors revealed this main effect of Description (A versus B) was significant (df = 1,149; F = 11.88; p < 0.001). A slight difference between groups in response to the good health descriptors observed in Figure 2 (slight increase for group one, small decrease for group two) was not significant with
Table 2 Number of participants who increased or decreased their EQ-VAS self report by 5 points or more after exposure to either good or poor health state descriptors as well as after both sets of descriptors
Group 1 n = 77 Group 2 n = 74
Number (%) Increase≥5
points
Number (%) Decrease≥5
points
Number (%) Either direction
≥5points
Number (%) Increase≥5
points
Number (%) Decrease≥5
points
Number (%) Either direction
≥5points Good health descriptors
(Description-A)
29 (38%) 24 (31%) 53 (69%) 11 (15%) 25 (34%) 36 (49%)
Poor health descriptors (Description-B)
37 (48%) 14 (18%) 51 (66%) 45 (61%) 8 (11%) 53 (72%)
After both Description A and B (compared with baseline EQ-VAS)
the main effect of sequence (df = 1,149; F = 0.24, p = 0.623) and the interaction (df = 1,149; F = 0.07, p = 0.793) both non-significant. Data from both groups combined indicated that the poor health descriptor set caused a mean (SD) increase in VAS score of 4.88 (11.81) points while the good health descriptor set caused a mean (SD) decrease in VAS score of 0.35 (10.71) points when compared with the VAS score immediately prior to that set of descriptors.
The second ANOVA which investigated the main effect of mean change in EQ-VAS after exposure to both sets of descriptors (VAS 3 -VAS 1), revealed that both groups’final mean EQ-VAS score was higher than their baseline EQ-VAS score (df = 1,149; F = 21.21; p < 0.001). The order in which the descriptors were received was non-significant with the main effect of sequence (df = 1,149; F = 2.11 p = 0.148) and the interaction effect (df = 1,149; F = 0.13 p = 0.723) both non-signifi-cant. The overall data from both groups combined indi-cated a mean (SD) difference between the final EQ-VAS (VAS 3) and the baseline EQ-VAS (VAS 1) for all parti-cipants was 4.5 (12.0) points, VAS 3 was higher. This is also illustrated in Figure 2 where no substantial differ-ence between the mean change scores from each group at the final assessment point (VAS 3) existed.
Discussion
Overall Outcome
The findings from this investigation support our hypoth-esis that respondents frequently do not give consistent consideration to the health states which give meaning to a health state scale such as the EQ-VAS. This may have a substantial effect on how a respondent reports their HRQoL on rating scales of this nature. This investiga-tion has been the first to demonstrate that patients’
self-report of their own HRQoL can be substantially altered despite no actual change in their underlying health state occurring (Table 2 and Figure 1). A change in self reported EQ-VAS rating was elicited for a large propor-tion of individuals merely by asking respondents to con-sider a set of health state descriptors (Table 2).
As one would expect, the mean baseline EQ-VAS score (VAS 1) for this hospitalised patient sample was substantially lower than the previously reported popula-tion norm of 82.5 out of 100[44]. Despite anchors of best imaginable and worst imaginable health state being present in the standard application of this instrument, participants frequently did not consider what these anchors might represent. Overall 133/151 (88%) and 148/151 (98%) of participants either reported that the descriptors of very good and very bad health states (respectively) were more extreme than they had pre-viously considered for the respective end anchor points or that they had not considered best and worst imagin-able health states at all during standard completion of the EQ-VAS.
Overall 70% of participants changed their self-report of HRQoL on the 100 point scale by a margin of 5 points or more after being provided with detailed descriptors of both good and poor health states (Table 2). These changes were not uniform across individuals, with 79 (52%) increasing and 27 (18%) decreasing their EQ-VAS rating by 5 points or more.
At the present time there is no available, published value for minimal clinically important difference on the EQ-VAS amongst this type of population. However a change of this magnitude is comparable to what has previously been identified as clinically important change on this scale amongst other patient populations[45-49]. Furthermore in the context of this population, a change of 5 points or greater represented a change of 8.5% or greater of the mean baseline score. Thus this amount of change in self-reported HRQoL on this scale may well have been interpreted as clinically meaningful for up to 70% of participants despite it being attributable to an acute shift in response rather than a change in underly-ing health. If this were observed in a clinical settunderly-ing, these reports may have incorrectly been interpreted as improvement in HRQoL for individuals who increased their score, and as decline in HRQoL amongst those who decreased their score (Table 2).
While it is unlikely that a patient will come across extreme health state descriptors between health assess-ments unless they are provided to them explicitly, other naturally occurring events (such as exposure to patients in an extremely poor health state while attending a hos-pital, watching television or elsewhere in the commu-nity) are likely to affect how a respondent completes a self evaluation of their own health state.
Strengths and limitations
A strength of this investigation lies in the methodology of employing a randomised crossover trial design for this novel examination of HRQoL evaluation. This has allowed for a methodologically rigorous investigation resulting in empirical evidence to support our hypoth-esis. This proof of concept is likely to contribute to future improvement in self-reported health evaluation methodology relevant to clinical settings, epidemiologi-cal investigations and health research utilising patient reported outcomes. However, the ability to directly gen-eralise these results is limited by the population in this study being hospitalised older adults and the use of a single rating scale (EQ-VAS) as the primary outcome. It is possible that other populations and rating scales may have been affected to a greater or lesser extent. How-ever, given the high use of healthcare resources by this population and the widespread use of the EQ-5D instru-ment, the sample and EQ-VAS were appropriate for this investigation.
Comparison to prior research
The metric properties and theoretical basis of visual analogue rating scales for use in evaluating health states has been the subject of much investigation and debate [11,28,29,50-58]. Previous empirical work has demon-strated that EQ-VAS ratings can be dependent on the context in which they are presented when rating multi-ple hypothetical scenarios[28]. While that finding has important implications regarding the use of multi-item visual analogue scales for assigning utility values to hypothetical health states,[28] this investigation has been the first to highlight the risk of a reference type bias on influencing individuals report of their own HRQoL using a rating scale such as the EQ-VAS.
The novel nature of this investigation limits the direct comparisons that can be made to previous empirical investigations of the response shift phenomenon. Research investigations in the response shift field have often focused on analysis of mean scores or changes at a group level [59-62] as opposed to changes at an indivi-dual level[8,17,63]. While this investigation found signif-icant effects at a group level with changes in mean EQ-VAS ratings, non-uniform response shifts across a large proportion of individuals were also observed (Table 2).
Findings from this study are consistent with previous investigations of social comparison, framing and order effects. It has previously been identified that self-reports of quality of life and HRQoL are dependent on social comparisons[64-67]. It is likely that the descriptions of good and poor health states presented in this investiga-tion may have elicited a similar effect to previously described upward or downward social comparisons respectively[64,66,67]. The resultant change in EQ-VAS
that occurred after this stimuli is also congruent with investigations of the framing effect[30-33]. While the current investigation did not alter the wording of the EQ-VAS to give a positive or negative valence, a similar effect is likely to have been elicited by the extreme health state descriptors provided between assessments. Interestingly, the order (sequence) in which the descrip-tors were provided in this investigation was not statisti-cally significant. This is consistent with previous investigations that have revealed the order of instrument administration to be inconsequential[35-38,68].
Implications and future directions
The EQ-VAS instrument was used in this investigation to illustrate how variable consideration during the eva-luation process can cause substantially different reports of HRQoL, despite no actual change in underlying health. Rather than an indictment of this particular instrument (which is certainly not the intention of the authors), these results indicate that caution should be exercised when using subjective patient reported out-comes such as those dependent on extreme anchors to give meaning to the value assigned to an individual health state.
It is clear from the minimal amount of consideration of the anchors by the respondents during the standard administration of the EQ-VAS, and their desire to change their response after being asked to consider the health state descriptors in this study, that responses are frequently not well considered. It is possible that many respondents may have initially applied an unwritten qualifying context for the anchors, such as best or worst health‘that is possible for me,’ ‘that I have experienced,’ ‘for my age’, or some other social comparator. Further investigation of what the respondents considered would be useful to support or refute this speculation. Empirical evidence of this nature would be useful to inform future improvements in HRQoL evaluation methodology. This empirical evidence could be generated through qualita-tive analysis of a direct think aloud approach or probing questions immediately following standard completion of the instrument[69].
If this occurred at each assessment, it may promote con-sistent consideration of the instrument.
Considering the spectrum of health components included in the health state descriptors may potentially reduce reconceptualisation and reprioritisation, while considering the extreme nature of how bad (or good) each of the health components can be may help reduce recalibration. Further investigation in this area is war-ranted, and would most likely require use of custom designed evaluation measures or approaches. Further research is also indicated to determine if extreme health states which give meaning to health rating scales are fre-quently not considered amongst other patient popula-tions. Investigation of the issues addressed in this manuscript should also be examined amongst other patient reported outcomes including pain and fatigue.
Conclusions
Subjective health state evaluations may not be well con-sidered. An immediate significant shift in response can be elicited by exposure to a mere description of an extreme health state despite no actual change in under-lying health state occurring. Caution should be exercised when interpreting change in subjective patient reported outcomes in research and clinical settings; particularly those dependent on brief extreme anchors to give mean-ing to assigned values.
Additional material
Additional file 1: Health state descriptors. This file contains the health state descriptors used for Description-A and Description-B.
Acknowledgements None
Author details
1Centre for Functioning and Health Research, Ipswich Road, Woolloongabba,
Queensland, Australia.2The University of Queensland, School of Health and Rehabilitation Sciences, St Lucia, Queensland, Australia.3Queensland
University of Technology, School of Public Health and Institute of Health and Biomedical Innovation, Kelvin Grove, Australia.4Bond University, Centre for
Research in Evidence-Based Practice, Gold Coast, Queensland, Australia.
5Southern Health, Allied Health Research Unit, Kingston Centre, Cnr Warrigal
and Kingston Roads, Cheltenham, Victoria, Australia.6Monash University,
Physiotherapy Department, School of Primary Health Care, Monash University Peninsular Campus, Victoria, Australia.
Authors’contributions
All authors contributed to the conception of research idea and planning of research processes. SM (and research assistants) contributed to data collection. SM and TH contributed to data analysis. SM prepared the manuscript. All authors contributed to manuscript review, appraisal and editing.
Competing interests
The authors declare that they have no competing interests.
Received: 30 July 2009 Accepted: 2 December 2010 Published: 2 December 2010
References
1. Little P, Everitt H, Williamson I, Warner G, Moore M, Gould C, Ferrier K, Payne S:Preferences of patients for patient centred approach to consultation in primary care: observational study.Bmj2001, 322(7284):468-472.
2. Addington-Hall J, Kalra L:Who should measure quality of life?Bmj2001, 322(7299):1417-1420.
3. McPhail S, Beller E, Haines T:Two perspectives of proxy reporting of health-related quality of life using the Euroqol-5 D, an investigation of agreement.Med Care2008,46(11):1140-1148.
4. Hickey A, Barker M, McGee H, O’Boyle C:Measuring health-related quality of life in older patient populations: a review of current approaches. Pharmacoeconomics2005,23(10):971-993.
5. Schwartz C, Sprangers M:Methodological approaches for assessing response shift in longitudinal health-related quality-of-life research. Social Science and Medicine1999,48:1531-1548.
6. Sprangers M, Schwartz C:Integrating response shift into health-related quality of life research: a theoretical model.Social Science and Medicine 1999,48(11):1507-1515.
7. Schwartz CE, Andresen EM, Nosek MA, Krahn GL:Response shift theory: important implications for measuring quality of life in people with disability.Arch Phys Med Rehabil2007,88(4):529-536.
8. McPhail S, Comans T, Haines T:Evidence of disagreement between patient-perceived change and conventional longitudinal evaluation of change in health-related quality of life among older adults.Clin Rehabil 2010,24(11):1036-1044.
9. Schwartz CE, Rapkin BD:Reconsidering the psychometrics of quality of life assessment in light of response shift and appraisal.Health Qual Life Outcomes2004,2:16.
10. Osborne RH, Hawkins M, Sprangers MA:Change of perspective: a measurable and desired outcome of chronic disease self-management intervention programs that violates the premise of preintervention/ postintervention assessment.Arthritis Rheum2006,55(3):458-465. 11. McPhail S, Haines T:The Response Shift Phenomenon in Clinical Trials.
J Clin Res Best Practices2010,6(2):1-8.
12. Oort FJ:Using structural equation modeling to detect response shifts and true change.Qual Life Res2005,14(3):587-598.
13. Rapkin BD, Schwartz CE:Toward a theoretical model of quality-of-life appraisal: Implications of findings from studies of response shift.Health Qual Life Outcomes2004,2:14.
14. Sprangers MA, Van Dam FS, Broersen J, Lodder L, Wever L, Visser MR, Oosterveld P, Smets EM:Revealing response shift in longitudinal research on fatigue–the use of the thentest approach.Acta Oncol1999, 38(6):709-718.
15. Visser MR, Oort FJ, Sprangers MA:Methods to detect response shift in quality of life data: a convergent validity study.Qual Life Res2005, 14(3):629-639.
16. Oort FJ, Visser MR, Sprangers MA:An application of structural equation modeling to detect response shifts and true change in quality of life data from cancer patients undergoing invasive surgery.Qual Life Res 2005,14(3):599-609.
17. McPhail S, Haines T:Response shift, recall bias and their effect on measuring change in health-related quality of life amongst older hospital patients.Health Qual Life Outcomes2010,8(1):65. 18. Rabin R, de Charro F:EQ-5D: a measure of health status from the
EuroQol Group.Ann Med2001,33(5):337-343.
19. Krabbe PF, Peerenboom L, Langenhoff BS, Ruers TJ:Responsiveness of the generic EQ-5D summary measure compared to the disease-specific EORTC QLQ C-30.Qual Life Res2004,13(7):1247-1253.
20. Holland R, Smith RD, Harvey I, Swift L, Lenaghan E:Assessing quality of life in the elderly: a direct comparison of the EQ-5D and AQoL.Health Econ 2004,13(8):793-805.
22. Pickard AS, Johnson JA, Feeny DH:Responsiveness of generic health-related quality of life measures in stroke.Qual Life Res2005, 14(1):207-219.
23. Konig HH, Ulshofer A, Gregor M, von Tirpitz C, Reinshagen M, Adler G, Leidl R:Validation of the EuroQol questionnaire in patients with inflammatory bowel disease.Eur J Gastroenterol Hepatol2002, 14(11):1205-1215.
24. Fayad F, Lefevre-Colau MM, Gautheron V, Mace Y, Fermanian J, Mayoux-Benhamou A, Roren A, Rannou F, Roby-Brami A, Revel M,et al:Reliability, validity and responsiveness of the French version of the questionnaire Quick Disability of the Arm, Shoulder and Hand in shoulder disorders. Man Ther2009,14(2):206-212.
25. Kimman ML, Dirksen CD, Lambin P, Boersma LJ:Responsiveness of the EQ-5D in breast cancer patients in their first year after treatment.Health Qual Life Outcomes2009,7:11.
26. Gunther OH, Roick C, Angermeyer MC, Konig HH:The responsiveness of EQ-5D utility scores in patients with depression: A comparison with instruments measuring quality of life, psychopathology and social functioning.J Affect Disord2008,105(1-3):81-91.
27. McPhail S, Lane P, Russell T, Brauer SG, Urry S, Jasiewicz J, Condie P, Haines T:Telephone reliability of the Frenchay Activity Index and EQ-5D amongst older adults.Health Qual Life Outcomes2009,7:48.
28. Krabbe PF, Stalmeier PF, Lamers LM, Busschbach JJ:Testing the interval-level measurement property of multi-item visual analogue scales.Qual Life Res2006,15(10):1651-1661.
29. Bleichrodt H, Johannesson M:An experimental test of a theoretical foundation for rating-scale valuations.Med Decis Making1997, 17(2):208-216.
30. Levin IP, Schneider SL, Gaeth GJ:All Frames Are Not Created Equal: A Typology and Critical Analysis of Framing Effects.Organizational Behavior and Human Decision Processes1998,76(2):149-188.
31. Kühberger A:The Influence of Framing on Risky Decisions: A Meta-analysis.Organizational Behavior and Human Decision Processes1998, 75(1):23-55.
32. Piñon A, Gambara H:A meta-analytic review of framing effect: Risky, Attribute and Goal framing.Psicothema2005,17(2):325-331. 33. Stapel DA, Koomen W:Interpretation versus Reference Framing:
Assimilation and Contrast Effects in the Organizational Domain.Organ Behav Hum Decis Process1998,76(2):132-148.
34. Levin IP, Gaeth GJ:How Consumers are Affected by the Framing of Attribute Information Before and After Consuming the Product.The Journal of Consumer Research1988,15(3):374-378.
35. Cheung YB, Wong LC, Tay MH, Toh CK, Koo WH, Epstein R, Goh C:Order effects in the assessment of quality of life in cancer patients.Qual Life Res2004,13(7):1217-1223.
36. McColl E, Eccles MP, Rousseau NS, Steen IN, Parkin DW, Grimshaw JM:From the generic to the condition-specific?: Instrument order effects in Quality of Life Assessment.Medical care2003,41(7):777-790.
37. Cheung YB, Lim C, Goh C, Thumboo J, Wee J:Order effects: a randomised study of three major cancer-specific quality of life instruments.Health and quality of life outcomes2005,3:37.
38. Childs AL:Effect of order of administration of health-related quality of life interview instruments on responses.Qual Life Res2005,14(2):493-500. 39. Folstein M, Folstein S, McHugh P:Mini-Mental State: a practical method
for grading the cognitive state of patients for the clinician.Journal of Psychiatric Research1975,12:189-198.
40. Linacre J, Heinemann A, Wright B, Granger C, Hamilton B:The structure and stability of the Functional Independence Measure.Archives of Physical Medicine & Rehabilitation1994,75:127-132.
41. Hawthorne G, Richardson J, Osborne R:The assessment of quality of life (AQoL) instrument: a psychometric measure of health related quality of life.Quality of Life Research1999,8:209-224.
42. D’Agostino RB, Belanger A, D’Agostino RB Jr:A Suggestion for Using Powerful and Informative Tests of Normality.The American Statistician 1990,44(4):316-321.
43. Royston P:Comment on sg3.4 and an Improved D’Agostino Test.Stata Technical Bulletin1992,1(3):20-23.
44. Kind P, Dolan P, Gudex C, Williams A:Variations in population health status: results from a United Kingdom national questionnaire survey.Bmj 1998,316(7133):736-741.
45. Mathias S, Pritchard M, Colwell H, Lu J, Wright N:What is the minimal clinically important difference and responsiveness of a patient-reported outcome questionnaire for metastatic colorectal cancer?Ann Oncol2006, 17(suppl_9):ix121.
46. Siena S, Peeters M, Van Cutsem E, Humblet Y, Conte P, Bajetta E, Comandini D, Bodoky G, Van Hazel G, Salek T,et al:Association of progression-free survival with patient-reported outcomes and survival: results from a randomised phase 3 trial of panitumumab.Br J Cancer 2007,97(11):1469-1474.
47. Luo N, Chew L-H, Fong K-Y, Koh D-R, Ng S-C, Yoon K-H, Vasoo S, Li S-C, Thumboo J:Do English and Chinese EQ-5D versions demonstrate measurement equivalence? an exploratory study.Health and Quality of Life Outcomes2003,1(1):7.
48. Pickard AS, Neary MP, Cella D:Estimation of minimally important differences in EQ-5D utility and VAS scores in cancer.Health Qual Life Outcomes2007,5:70.
49. Coteur G, Feagan B, Keininger DL, Kosinski M:Evaluation of the meaningfulness of health-related quality of life improvements as assessed by the SF-36 and the EQ-5D VAS in patients with active Crohn’s disease.Aliment Pharmacol Ther2009,29(9):1032-1041. 50. Robinson A, Dolan P, Williams A:Valuing health status using VAS and
TTO: what lies behind the numbers?Soc Sci Med1997,45(8):1289-1297. 51. Robinson A, Loomes G, Jones-Lee M:Visual analog scales, standard
gambles, and relative risk aversion.Med Decis Making2001,21(1):17-27. 52. Torrance GW, Feeny D, Furlong W:Visual analog scales: do they have a role in the measurement of preferences for health states?Med Decis Making2001,21(4):329-334.
53. Lamers LM, Stalmeier PF, Krabbe PF, Busschbach JJ:Inconsistencies in TTO and VAS values for EQ-5D health states.Med Decis Making2006, 26(2):173-181.
54. Krabbe PF:Thurstone scaling as a measurement method to quantify subjective health outcomes.Med Care2008,46(4):357-365. 55. Parkin D, Devlin N:Is there a case for using visual analogue scale
valuations in cost-utility analysis?Health Econ2006,15(7):653-664. 56. Nord E:The validity of a visual analogue scale in determining social
utility weights for health states.Int J Health Plann Manage1991, 6(3):234-242.
57. Bleichrodt H, Johannesson M:Standard gamble, time trade-off and rating scale: experimental results on the ranking properties of QALYs.J Health Econ1997,16(2):155-175.
58. Doctor JN, Bleichrodt H, Lin HJ:Health utility bias: a systematic review and meta-analytic evaluation.Med Decis Making2010,30(1):58-67. 59. Joore MA, Potjewijd J, Timmerman AA, Anteunis LJ:Response shift in the
measurement of quality of life in hearing impaired adults after hearing aid fitting.Qual Life Res2002,11(4):299-307.
60. Ring L, Hofer S, Heuston F, Harris D, O’Boyle CA:Response shift masks the treatment impact on patient reported outcomes (PROs): the example of individual quality of life in edentulous patients.Health Qual Life Outcomes 2005,3:55.
61. Ahmed S, Mayo NE, Wood-Dauphinee S, Hanley JA, Cohen SR:Response shift influenced estimates of change in health-related quality of life poststroke.J Clin Epidemiol2004,57(6):561-570.
62. Visser MR, Smets EM, Sprangers MA, de Haes HJ:How response shift may affect the measurement of change in fatigue.J Pain Symptom Manage 2000,20(1):12-18.
63. Mayo NE, Scott SC, Dendukuri N, Ahmed S, Wood-Dauphinee S:Identifying response shift statistically at the individual level.Qual Life Res2008, 17(4):627-639.
64. Bowling A, Banister D, Sutton S, Evans O, Windsor J:A multidimensional model of the quality of life in older age.Aging Ment Health2002, 6(4):355-371.
65. Trief PM, Wade MJ, Pine D, Weinstock RS:A comparison of health-related quality of life of elderly and younger insulin-treated adults with diabetes.Age and ageing2003,32(6):613-618.
66. Franz M, Reber T, Meyer T, Gallhofer B:Social Comparison and Quality of Life in Schizophrenic Patients.Quality of Life Research1997,6(7/8):646-647. 67. Dibb B, Yardley L:Factors important for the measurement of social
comparison in chronic illness: a mixed-methods study.Chronic Illness 2006,2(3):219-230.
instrument in knee and hip osteoarthritis: a randomized study. Osteoarthritis and cartilage/OARS, Osteoarthritis Research Society2008, 16(4):429-435.
69. Collins D:Pretesting survey instruments: an overview of cognitive methods.Qual Life Res2003,12(3):229-238.
doi:10.1186/1477-7525-8-146
Cite this article as:McPhailet al.:Reference bias: presentation of extreme health states prior to eq-vas improves health-related quality of life scores. a randomised cross-over trial.Health and Quality of Life Outcomes20108:146.
Submit your next manuscript to BioMed Central and take full advantage of:
• Convenient online submission
• Thorough peer review
• No space constraints or color figure charges
• Immediate publication on acceptance
• Inclusion in PubMed, CAS, Scopus and Google Scholar
• Research which is freely available for redistribution