GSJ: Volume 7, Issue 2,
February
2019, Online: ISSN
2320
-9186
www.globalscientificjournal.com
Productivity Improvement through Line Balancing - A Case
Study in an Apparel Industry
Mahathir Mohammad Bappy
1, Md. Abu Musa
2, Md. Farhad Hossain
3Author Details
Author1
, Mahathir Mohammad Bappy is currently working as a faculty in Industrial and production engineering department in Shahjalal University of Science and Technology, Sylhet, Bangladesh. E-mail: [email protected]
Co-Author2,
Md. Abu Musa is currently pursuing bachelor’s degree program in Industrial and production engineering in Shahjalal University of Science and Technology, Bangladesh. E-mail: [email protected]
Co-Author3,
Md. Farhad Hossain is a graduate of Industrial and production engineering from Shahjalal University of Science and Technology, Bangladesh. E-mail: [email protected]
KeyWords
Line balancing, Line efficiency, Labor productivity, Work sharing method, Productivity
ABSTRACT
Introduction
Apparel industry is one of the world’s vital industries and the garment industry is a fundamental one within the supply chain of apparel industry. Within a single decade garments industry in Bangladesh has emerged as the single dominant industry [1]. It makes a significant contribution to the national economy by creating generous employment opportunities and reducing poverty through socioeconomic development [2]. The sector became very important concerning employment, foreign exchange earnings and its contribution to GDP. Still, in terms of productivity, its performance is below the mark even in the tough competitive market. To survive in this competitive market, productivity improvement is a vital issue in the case of RMG industry. In this business environment, the design of such manufacturing systems, which involves the design of products, processes and the plant layout before physical construction, becomes more and more important. Particularly, the design of an efficient assembly line has a considerable industrial importance [3]. Reducing Lean wastes and decreasing process bottlenecks will certainly improve the efficiency and productivity. The Finishing line is one of the critical phases in the RMG production. The production process of garments industry can be grouped into three main stages cutting, sewing and finishing [4]. The finishing line consists of a set of workstations in which several tasks are performed to enhance the suitability of the fabric for end use and the dimensional stability of the products. Tasks are assigned to operators based on their labor skill levels. Required manpower for each operation is determined through the calculation of cycle time and benchmark target per hour. Unequal workload among workstations results in bottlenecks and WIP. Work sharing method plays a vital role in eliminating these bottlenecks. Finally, a balanced layout is modeled for the finishing line.
Literature review
The assembly line balancing problem (ALBP) involves distributing the tasks needed to manufacture any unit of the products to be assembled among the work stations along a manufacturing line [5]. Line Balancing is leveling the workload across all processes in a cell or value stream to remove bottlenecks and excess capacity [6]. The issue of line balancing with limited resources has always been a serious problem in industry [7]. ALBP has been an active field of research over the past decades due to its relevancy to diversified industries such as garment, footwear and electronics [8]. The assembly line balancing problem has received considerable attention in the literature since 1954 [9]. The assembly line balancing problem was first introduced by Bryton in his graduate thesis. In his study, he accepted the number of workstations as constant, the workstation times as equal for all stations and work tasks as moving among the workstations. The first article was published in 1955 by Salveson. He developed a 0-1 integer programming model to solve the problem. However, since the ALB problem falls into the NP hard class of combinatorial optimization problems (Gutjahr and Nemhauser, 1964), it has consistently developed the efficient algorithms for obtaining optimal solutions. COMSOAL (Computer Method of Sequencing Operations for Assembly Lines) was first used by Arcus in 1966 as a solution approach to the assembly line balancing problem [10]. Numerous research efforts have been directed towards the development of computer-efficient approximation algorithms or heuristics (e.g. Kilbridge and Wester, 1961; Helgeson and Birnie, 1961; Hoffman, 1963; Mansoor, 1964; Arcus, 1966; Baybar, 1986a) and exact methods to solve the ALB problems. (e.g. Jackson, 1956; Bowman, 1960; Van Assche and Herroelen, 1978; Mamoud, 1989; Hackman et al., 1989; Sarin et al., 1999) [11].
Classification of ALB problem is primarily based on objective functions and problem structure. Different versions of ALB problems are introduced due to the variation of objectives [12]. ALBP with various objectives are classified into three types:
ALBP-I: minimizes the number of workstations, for a given cycle time.
ALBP-II: minimizes the cycle time, for a given number of workstations.
ALBP-III: maximizes the workload smoothness, for a given number of workstations [13].
Methodology
To balance the finishing line relevant data was collected from the line.
At first, for a certain garment order the number of operations, sequence of operations, seams length, types of fabric, number of workers, working hours, machine efficacy etc. were identified. The time needed for each operation by every worker was calculated. Tasks are then assigned to the operators based on their labor skill level.
Figure 1: Steps involved in the line balancing
For each operation the average cycle time was calculated by using stop watch. The S.M.V., Takt time, cycle time, labor productivity, line efficiency and target per hour were calculated using following equations:
Capacity per hour =
Daily production =
Tact time =
Target =
Standard minute value (S.M.V) = in minute
Theoretical manpower =
Labor productivity =
The benchmark target per hour was determined considering the cycle time and desired efficiency of the line. Variation in the cycle time per head results in variation in the hourly capacity of the operations. In order to reduce this variation and adjust the hourly capacity of the operations required manpower were calculated for each operation. The adjusted hourly capacity of different operations was then compared with the benchmark target capacity to identify the bottleneck processes which was the prime concern. Higher cycle time per head or lower hourly capacity than benchmark target indicates the bottleneck process. The bottleneck operations and balancing operations (operations which have higher hourly capacity than benchmark target) were then identified. After that, the line was balanced by sharing workload among workers who has experience in both bottleneck process and balancing process. The experienced worker shared their excess time on bottleneck process after completing tasks on balancing process. In this manner the bottleneck processes were balanced. Based on the updated calculation a balanced finishing line production layout was modeled.
Data Collection and Analysis
To balance the line the first step is to specify the sequential relationships among tasks.
The process wise capacity of the finishing line has been shown in Table 1 where Standard minute value (S.M.V) has been calculated by taking average cycle time for each process and considering allowances. Currently the labor productivity is 31% and line efficiency is 67%.
Here the benchmark target for the line calculating total 75 manpower worked on that line for 600 minutes. With a S.M.V value of 13 we have standardized the Benchmark target of 300 pieces of garments at 86% efficiency.
Table 1: Labor productivity, Line efficiency and Target per hour before line balancing
Total output per day 2300
Total manpower 75
Working time 600
S.M.V. 13
Takt time 0.214
Cycle time 0.261
Labor productivity 31
Line efficiency 67
Target per hour 346 (efficiency 100%) 277 (efficiency 80%) 208 (efficiency 60%)
Benchmark Target Per Hour 300 (efficiency 86%)
Figure 2: Variations in process cycle time
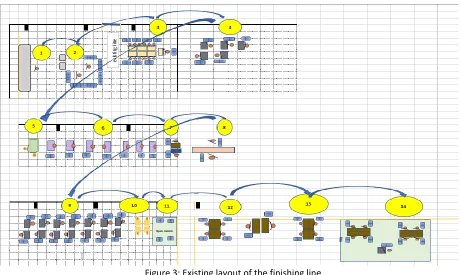
In this figure 3 the existing layout of the finishing line is shown in the sequential order in which material flows. The blue arrow indicates the work flow.
Figure 3: Existing layout of the finishing line
The table 2 shows the current manpower and the proposed manpower based on the adjustment of the cycle time. The hourly capacity shows the impact of adjusting cycle time. Adjusting cycle time per head results in adjusted hourly capacity.The adjustment of manpower with respect to cycle time per head results in requirement of 70 manpower where 75 workers are employed in current layout.
0 5 10 15 20 25
Table 2: Process wise manpower distribution, capacity and cycle time calculation
Serial
No. Operation
Current Manpower Required Manpower Estimated Standard Cycle Time(Sec) Hourly Capacity Adjusted Hourly Capacity Cycle Time Per Head After Cycle Time
1 Input 1 1 8.11 444 444 8 8
2 Size Sorting 2 1 14.34 502 251 7 14
3
Thread
Trimming 13 6 63.81 733 339 5 11
4
Inside
Inspection 5 4 42.00 429 343 8 11
5
Remove
Loose thread 2 1 14.20 507 254 7 14
6
Pressing
(Iron) 7 4 44.40 568 324 6 11
7 Attach Button 2 1 13.82 521 260 7 14
8 Heat Seal 2 4 44.20 163 326 22 11
9
Topside
inspection 14 10 100.80 500 357 7 10
10
Repair:
Sewing 4 9 92.40 156 351 23 10
11 Spot (Repair) 4 8 84.00 171 343 21 11
12 Measurement 6 6 66.00 327 327 11 11
13 Attach UPC 4 4 43.80 329 329 11 11
14 Packing 9 11 110.42 293 359 12 10
Total 75 70
After balancing cycle time by adjusting the manpower, the cycle time of the operations are now closer to the benchmark value as shown in figure 4.
Figure 4: Variation in process cycle time after lie balancing. 0 2 4 6 8 10 12 14 16
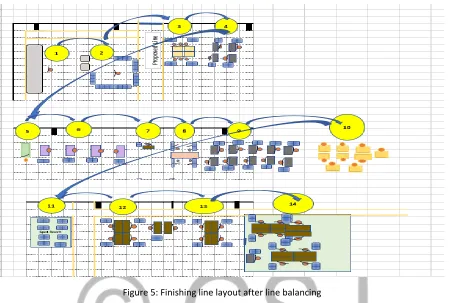
The figure 5 shows the finishing line layout after adjusting the manpower. The sequential order of the operations remains same where the assigned manpower reduced from 75 to 70.
Figure 5: Finishing line layout after line balancing
Balancing method is very essential to make the production flow smoother. Line is balanceable if a perfect balance can be obtained via work-sharing between adjacent stations. Considering working distance, type of machines and efficiency, workers who have extra time to work after completing their works, have been shared their work to complete the bottleneck processes. Previously identified three bottleneck processes have been plotted in the left side of the Table 3. Skilled worker from the process input can share 15 minutes on size shorting which adjust the bottleneck process size shorting. Similarly, the skilled worker from the process Inside inspection and Pressing (Iron) can share 15 minutes on Remove loose thread and Attach button respectively.
Table 3: Work sharing between Bottleneck process and Balancing process
The work sharing of the three tasks will remove the bottlenecks of the finishing line while adjusting the hourly capacity of all tasks.
Sl No
Process Name
Process No Hourly Capacity Balanced Hourly Capacity Process Name Process No Hourly Capacity Balanced Hourly Capacity
1
Size Sorting
2
251
313
Input
1
444
333
2
Remove Loose Thread
5
254
317
Inside Inspection
4
343
318
3
Attach Button
7
260
325
Pressing(Iron)
6
324
302
Bottleneck Process
Balancing Process
1 skilled worker from process #1 can work for 45 min and share work with process #2 for last 15 min
1 skilled worker from process #4 can work for 45 min and share work with process #5 for last 15 min
Table 4: Process wise adjusted hourly capacity after line balancing
Operation
Adjusted Hourly Capacity
Balanced Hourly Capacity
Input 444 333
Size Sorting 251 313
Thread Trimming 339 339
Inside Inspection 343 318 Remove Loose thread 254 317
Pressing (Iron) 324 302
Attach Button 260 325
Heat Seal 326 326
Topside inspection 357 357
Repair: Sewing 351 351
Repair: Spot 343 343
Measurement 327 327
Attach UPC 329 329
Packing 359 359
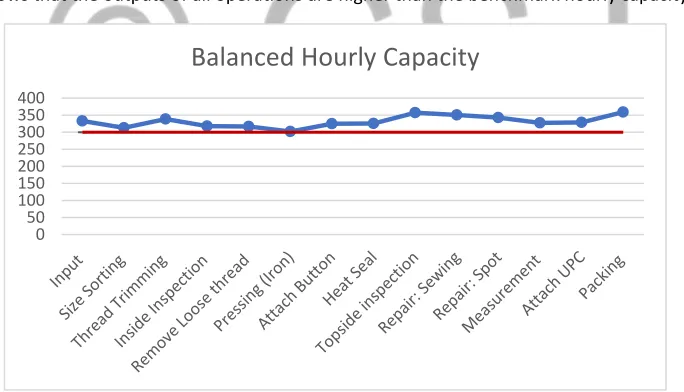
In figure 6 by plotting process wise capacity in a line graph shows the variation of each process from the bench mark target. The Hourly capacity graph shows that the outputs of all operations are higher than the benchmark hourly capacity.
Figure 6: Variation in each process hourly capacity per hour compare to benchmark target
The final proposed layout for the finishing line is shown in the figure 7. The yellow arrow indicates work sharing by the skilled workers in between bottleneck processes and balancing processes.
0 50 100 150 200 250 300 350 400
Figure 7: Proposed finishing line layout after line balancing
Result and Discussion
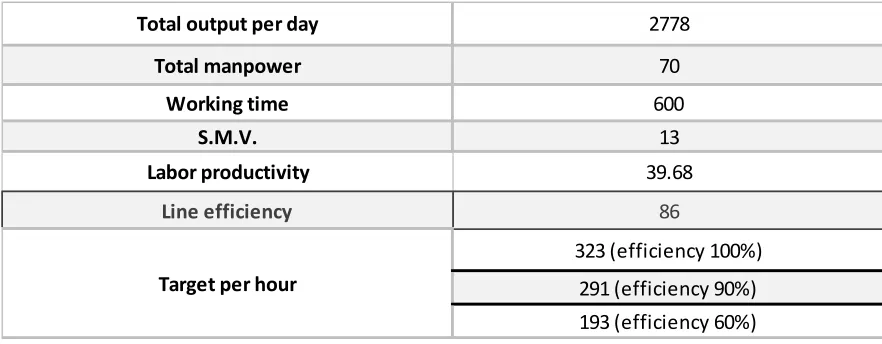
Table 5: Labor productivity, Line efficiency and Target per hour after line balancing
Therefore, by changing the manpower and locations of stations and performing some improvements in activities of one station, the improvement scenarios are generated. Further improvements in the productivity can be achieved by considering large amount of order.
Conclusion
Productivity improvement is an important issue in RMG sector. The profit earning of apparel industry largely depends on productivity improvement. This study shows the way of improving the production efficiency by using work sharing method. Number of operators are reduced by considering process wise cycle time per head. A final layout for the finishing line is proposed. The proposed layout model has been followed the logic of modular system (worker works on more than two processes who is skilled on all processes and these combination of skilled workers finish their work in piece flow production) and traditional system (one worker works in one process and all the workers who may be skilled or not finish their work in bundle flow production) both together where only modular production system can be applicable with a series of skilled workers to achieve more productivity. This calculation could be justified by considering different line of the production floor. Result would have been more effective if the order considered is larger than the current order. Lean tools are also very important for reducing wastes and improving quality. So, further research could be done by using combination of lean and work study techniques.
References
[1] M. Yunus and T. Yamagata. The garment industry in Bangladesh. Fukunishi ed., Dynamics of the Garment Industry in Low-Income Countries: Experience of the Asia and African (Interim Report). Chousakenkyu Houkokusho, IDE-JETRO, 2012.
[2] M. S. Islam, Md. A. Rakib and ATM. Adnan. Ready-Made Garments Sector of Bangladesh: Its Contribution and Challenges towards Development. Asian Dev. Stud, Vol. 5, Issue 2, June 2016.
[3] M. Baudin, (2002). Lean assembly: The nuts and bolts of making assembly operations flow. Productivity, New York.
[4] M. Vilà, J. Pereira “An enumerationprocedure for the assembly line balancing problembased on branching by non-decreasing idle time”,European Journal of Operational Research 229, pp. 106–113, 2013
[5] W. Grzechca And L. R. Foulds. Assembly Line Balancing Problem with Task Splitting: A Case Study, IFAC-PapersOnLine 48-3, pp. 2002–2008, 2015.
[6] Mr. S.V. Kothavade, Mr. A.P. Kulkarni, Mr. H.M. Ghuman, Er. S.P. Deshpande. A Review on Different Techniques to Solve Assembly Line Balancing Problem. International Conference on Global Trends in Engineering, Technology and Management, pp. 154-161, 2016.
[7] K. Agpak, H. Gokcen. Assembly line balancing: Two resource constrained cases. International Journal of Production Economics 96(1), pp. 129-140, 2005 [8] J. C. Chen, C.C. Chen, L.H. Su, H.B. Wu, C.J. Sun “Assembly line balancing in garment industry” Expert Systems with Applications 39, pp. 10073–10081, 2012. [9] F. N. Silverman, J. C. Carter. A COST-BASED METHODOLOGY FOR STOCHASTIC LINE BALANCING WITH INTERMITTENT LINE STOPPAGES. Management Science.
Vol. 32, No. 4, pp. 455-463, 1986.
[10] R. Zhu, Y. Ma. Information Engineering and Applications: International Conference on Information Engineering and Applications, IEA 2011. [11] N. Kriengkorakot, N. Pianthong. The Assembly Line Balancing Problem: Review articles. KKU Engineering Journal Vol. 34 No .2, pp. 133 – 140, 2007. [12] Md. K. Uddin, J. Luis M. Lastra. Assembly Line - Theory and Practice. IntechOpen, London, 2011.
[13] S. O. Tasan, & S. Tunali. A review of the current applications of genetic algorithms in assembly line balancing. Journal of Intelligent Manufacturing, 19(1), pp. 49– 69, 2008.
[14] Md. N. Morshed & K. Saifujjaman Palash. Assembly Line Balancing to Improve Productivity using WorkSharing Method in Apparel Industry. Global Journal of Researches in Engineering: G Industrial Engineering Volume 14 Issue 3 Version 1.0 Year 2014.
Total manpower 70
Working time 600
S.M.V. 13
Labor productivity 39.68
Line efficiency 86
323 (efficiency 100%)
291 (efficiency 90%) 193 (efficiency 60%)
Total output per day 2778