GSJ: Volume 7, Issue 10, October 2019, Online: ISSN 2320-9186
www.globalscientificjournal.com
Effect of Fiber Content and Chemical Modification on Sound
Absorption of Bagasse Fiber – Filled Polyurethane Composite
S. Hamza
1*, M. A. Hassan
2, T. M. Chiroma
3, J. Niresh
4and E. Garba
5KeyWords
KeyWords: Noise Pollution, Polyurethane, Sugarcane Bagasse, Mercerization, Acetylating, Polymer Composite, Sound Absorption Coefficient
ABSTRACT
I.
INTRODUCTION
In recent years, noise has become an undesirable feature of the environment due to increased human activities. Apart from increase
in world population, high level of industrialization has contributed to high level of noise pollution, making it worrisome. Noise
pollu-tion has negative effects on human health, it is one of the nuisances that decrease quality of human life; it disturbs sleep, interferes
in complex task performance, modifies human behaviour and also causes annoyance. Noise pollution can have serious consequences
on human health and can affect human body in three different ways; physical, physiological and psychological. The physical effects
are direct effcts on peoples’s health, such as loss of hearing. Physiologically, noise pollution adversely affects health resulting in
stress while psychological related effects are distractions and annoyance [1, 2]. Amongst the noise pollutants in most of urban areas
in developing countries are noise from vehicle traffic, pressure horns, construction industries, machineries, religious worship
institu-tions and home power generating sets [3]. Reduction of noise pollution has been a major challenge due to lack of noise
screens/acoustic ceiling tiles in most homes, offices and other buildings due to to high cost of acoustic materials. There is also
chal-lenge of environmentally disposal of sugarcane bagasse generated in sugar factories in Nigeria and there is no commercial scale
us-age of the by-product except to incenerate. Therefore the use of bagasse in the production of sound absorbing composite material
will help combat the existing problems of both waste disposals in sugar mills, noise pollution in our environment and also add value
to the by-product. Materials currently in use for noise reduction are variety of non-biodegradable synthetic sound absorbers, despite
adequate performance, their production and after use disposal contribute to environmental pollution. Most of these materials are
fibrous in nature. Synthetic fibers such as fiber glass, glass wool or rock wool are used as raw materials. Despite their good
perfor-mance for acoustic purposes, they are quite expensive and not sustainable [4-6].
One of the effective solutions in noise control is based on the use of a variety of noise reduction materials with special structure in
trems of transmission route [7].
Sugarcane (Saccharum officinarum) is commonly found in equatorial countries such as India, Pakistan, Malaysia and Indonesia, and
tropical countries such as Brazil [8]. In some West African countries like Nigeria, sugarcane can be cultivated almost in all the states
locally but commercially it is produced in; Katsina, Taraba, Kano, Adamawa, Jigawa, Kaduna, Kebbi, and Sokoto state [9]. In 100% of
sugarcane, the resulting bagasse varies from 23%-40% [10]. Currently in Nigeria, a portion of this waste is utilized for energy
produc-tion in sugar nills; anorher part is burnt in order to clear the field. Some efforts have been made to use the waste in the producproduc-tion
of paper [8, 11].
Sound absorbing materials normally absorb nearly all the sound energy striking them and reflect very little. Consequently, the
mate-rials have been discovered to be very suitable for control of noise. There are different types of sound absorption matemate-rials, their
absorption capabilities depend on some factors such as frequency, composition, thickness, surface finish and mode of mounting.
However, materials that have high value of sound absorption coefficient are usually porous which contain cavities, channels or
in-terstices so that sound waves are able to pass through them [12,13]. The purpose of absorptive materials is to convert impinging
acoustic energy into heat. The energy content of sound wave is normally very small; therefore, the amount of heat generated is also
small. Viscous-flow effect and internal friction are the two mechanisms by which energy is dissipated in sound absorptive materials.
The structure of an effective sound absorber consists of a series of interconnected pores or void, through which sound waves
Most building materials have acoustic properties that will reflect, absorb, or transmit the sound striking them. When sound wave
intracts with a surface of a wall or ceiling, a part of energy is reflected, another part is absorbed and the other part is transmitted
through the wall. The incident waves are those waves that are being projected to a definite material which can either be reflected or
transmitted. The amounts of energy going to reflection, absorptoion, or transmission depend on the acoustical performance of the
material surface [14].
Partition
Reflected sound
Absorbed sound
Transmitted sound
Incident sound wave
Figure 1. Interaction of sound wave on material
In this study, sugarcane bagasse was subjected to chemical modifications, namely- mercerization and acetylation. The sound
absorp-tion coefficients of the composites produced with raw, mercerized and acetylated fiber were compared to that of the pure matrix.
I. MATERIALS AND METHODS
2.1 Materials
Polyurethane in two parts #24 and #25 for the matrix were obtained from Fiber Glast Developments Corporation. Crushed
sugar-cane bagasse of mixed varieties B4719 (50%), Sp716180 (15%), M1400 (20%) ans Co957 (15%) were collected from Savanna Sugar
Company, Numan Local Government Area of Adamawa State. NaOH pellets, acetic acid and acetic anhydride were obtained from
chemical store.
2.2 Methods
2.2.1 Fiber purification, sizing and chemical modifications
10 kg of crushed fiber was soaked in water for 45 minutes and washed several times in clean water to get rid of sugar remnant and
other waste soluble impurities present on the fiber surface and then dried. 710 microns size of fiber was obtained by using standard
sieves and the fiber particles were divided into three portions. The first part was named crude fiber. The other two portions were
The two parts of the purified fiber were mercerized by immersion in 5% w/v NaOH solution for 48 hours at room temperature. The
fiber was then washed in distilled water and dried for 48 hours under sunlight [12]. The resultant fiber was divided into two parts; a
part was named mercerized fiber while the other portion was used for acetylation.
Acetylation was done by first soaking the last portion of the fiber in distilled water for 60 minutes, filtered and placed in a flask
con-taining 10% w/v acetic acid for 30 minutes. It was then placed in another flask concon-taining 14% w/v acetic anhydride solution and a
drop of concentrated H2SO4 was added and allowed for 70 minutes at 30oC. The fiber was then washed with distilled water until is
acid free and dried prior to usage [13]
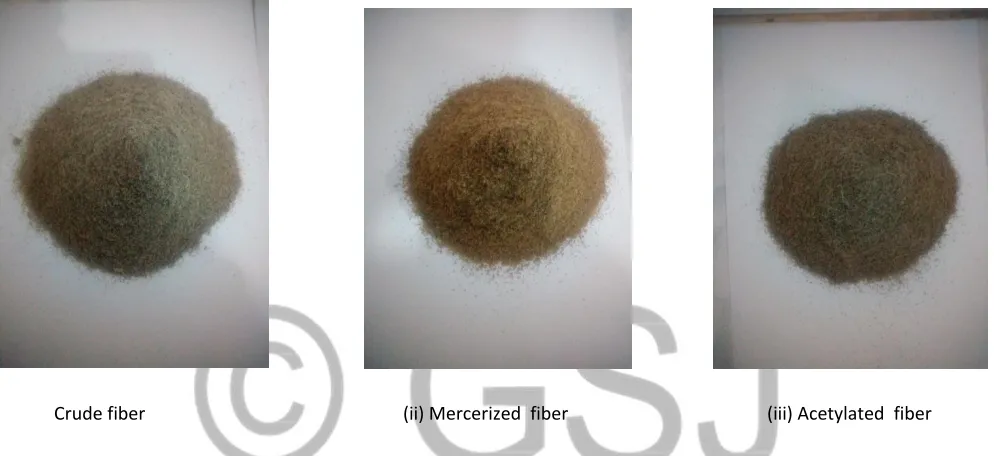
(i) Crude fiber (ii) Mercerized fiber (iii) Acetylated fiber
Figure 2: Crude, mercerized and acetylated bagasse fibers (710microns particle size)
2.2.2 Composite formation
The samples were prepared through the free rising foaming method. 16g each of liquid polyurethane kits, part A and B were mixed
to prepare the pure polyurethane samples. Appropriate quantities, by weight, of part B was added to the required amount of
ba-gasse fiber and mixed with magnetic stirrer for 30 minutes at 1000 rpm. Then part A was added to the mixture and stirred at 1500
rpm with mechanical stirrer for 15 seconds. The mixture was gently poured into PVC cylindrical mold of 100 mm diameter by 40 mm
high. The mixture expanded and then cured at room temperature for 12 hours prior to demolding, after which the samples were
prepared for sound absorption coefficient measurements [15, 16]. The fiber contents 0, 5, 10, 15 and 20 wt % was used to prepare
samples PUF, A1, A2, A3, A4, B1, B2, B3, B4, C1, C2, C3, and C4 for crude, mercerized and acetylated composite respectively.
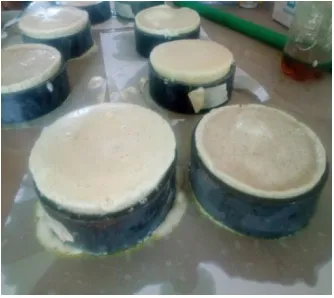
(i) 100mm diameter PVC molds (ii) Samples fabrication
Figure 3: Samples production and molds
III. RESULTS AND DISCUSSION
The sound absorption coefficients of the specimens were assessed according to ASTM E1050-10 in frequency range 50-1600 Hz. This
frequency range is simply an average of all frequencies within the third-octave band which is frequencies of human hearing. The
frequency range has also been selected to satisfy the fundamental constraint that had been highlighted by ASTM. According to the
standard, the usable frequency range depends on the diameter of the tube and spacing between the microphone positions.
The sound absorption coefficients of pure polyurethane foam (base matrix) and various polyurethane composites are shown in
fig-ures 4 to 6.
Figure 4: Sound absorption coefficients curves for base matrix and crude fiber composites with various fiber loadings 0.000
0.100 0.200 0.300 0.400 0.500 0.600 0.700 0.800 0.900 1.000
50 200 350 500 650 800 950 1100 1250 1400 1550 1700
Soun
d
Absorption
Coef
ficient
(
α)
Frequency (Hz)
PUF
A1
A2
A3
Figure 4 shows the correlation between the sound absorption coefficient and wave frequency for the samples with and without
var-ied percentage of crude fiber in frequency range of 50 to 1600 Hz. It can be seen that the souns absorption characteristics of the
pure polyurethane foam and the composites vary, to a large extent with wave frequency. The sound absorption coefficients of the
composites generally increased with frequency within 80 Hz and 1000 Hz and then decrease as the frequency is increased to 1600
Hz. This behaviour could be ascribed to the specific characteristics of the materials in absorbing and reflecting sound energy at
cer-tain frequencies. Sound absorption coefficient of a material depends on the material and the frequency of the sound which strikes
the surface of the material. The behaviour of the composites is in agreement with the report of Elammaran et. al [17]. The plot for
the pure polyurethane foam shows the maximum peak value of sound absorption coefficient of 0.136 at frequency of 1600 Hz. As
the crude fiber content loading is increased from 0 to 20 wt% (PUF-A4), the sound absorption capabilitities of the samples also
in-creased from 0.136 to 0.925 within the frequency range under consideration. As the frequency is inin-creased, the values of absorption
increase with initial fluctuation. Comparing the peak of the plot of pure polyurethane and that of the composites, it could be seen
from the figure that all the composites performed better than the base matrix, the sample with lowest percentage of fiber shows
lower values of sound absorption coefficient. Whereas the base matrix exhibit a continued increase in sound absorption with
fre-quency increase, the composites generally increase in sound absorption with frefre-quency up to some peak values which occurred at
frequency between 1000 Hz and 1250 Hz. The composites with least and highest fiber loadings (A1 &A4) peaked at 1000 Hz, while
A2 and A3 at 1250 Hz. The value of maximum peak of individual composite plot does not indicate much difference with most of the
peaks being above 0.830 and close to 1, indicating average range of 0.041. This low range indicates that the sound absorption
coeffi-cient is not affected to a large extent by the percentage of the fiber present in the composites of same thickness. The maximum
val-ue obtained is 0.925 for the sample with 20 % fiber loading (A4) at the same time when the sample with 5% loading (A1) had a sound
absorption coefficient of 0.836. All the plots for the composites (A1, A2, A3, & A4) also show that the sound absorption coefficient
value declines between frequencies of 1250 to 1600 Hz after reaching the respective peaks. The values of sound absorption
coeffi-cients recorded indicate that addition of crude bagasse fiber is efficient in absorbing sound waves at medium frequencies,
particular-ly above 250 Hz. At very low frequencies, below 250 Hz, the results revealed that sound absorption coefficients of 0.001. 0.072,
0.026, 0.050 and 0.007 were obtained. This is an indication that the samples with and without varied fiber loadings are not able to
absorb sufficient incident waves and reflected most after striking the samples at the said frequency range. This result is in
agree-ment with the report of Chunhu et. al [18], that low frequency sound waves are very difficult to absorb because of their long
wave-length.
It was observed that the polyurethane foam with 25 mm thickness, with or without varied percentages of crude bagasse fiber used
in this study are not able to absorb low frequency sound waves efficiently, therefore, is inefficient for low frequencies applications
as reported by Seddeq [19]. To improve the absorption or reduction of low frequency sounds, the materials used should be thicker
so as to provide enough time for sound waves to transform into heat when passing through the obstacles within the materials. The
formulation of polyurethane foam with different crude bagasse fiber loadings was able to enhance the sound absorption coefficient
in the medium frequency range without altering the thickness of sound absorbing materials. The behaviour of the composites could
be adduced to the increasing compactness of the structure obtained in the composite when amount of fiber in it increases, in which
the compact structure reduces the size and volume fraction of air voids and make the air passage much narrower and more
tortu-ous. Consequently, sound wave is made to travel longer distance in the structure which results in further reduction of sound energy.
Figure5: Sound absorption coefficients curves for base matrix and mercerized fiber composites with various fiber loadings
Figure 5 shows the sound absorption of the base matrix and composites with different amount of mercerized fibers at frequencies
50 – 1600 Hz. From the figure, it can be seen that the base matrix exhibits same trend as discuseedd in figure 4. Addition of 5 wt%
(B1) of mercerized fiber in polyurethane system does not change the sound absorption characteristics of the composite
meaningful-ly, as the values initially decrease from 0.194 to 0.025 between the frequencies of 50-125 Hz and then increased steadily from 0.028
at 160 Hz to a peak value of 0.235 at 1600 Hz. Increasing the fiber content of composite from 5 wt% to 10 wt% (B2) also shows
simi-lar trend, having absorption coefficient of 0.201 to 0.035 between 50 – 160 Hz and then increased gradually from 0.048 to 0.182
within 200 Hz and 800 Hz then decreased to 0.165 at 1000 Hz, before obtaining a peak value of 0.268 at 1600 Hz. Further increase in
the fiber content of the composite to 15 wt% (B3) shows that the acoustic absorption of the sample also decline initially and
fluctua-tions apperared with different degree as the frequency increases. The absorption of the composites decreases from 0.222 to 0.058
within 50 and 100 Hz and then increased steadily to 0.121 at 400 Hz then fluctuates between 0.020 and 0.234 within the frequencies
of 500 Hz and 1250 Hz and then recorded a maximum value of 0.312 at 1600 Hz. Increasing the fiber content from 15 wt% to 20 wt%
loading (B4) indicates a similar trend in acoustic absorption charactreristics with the sample B3. The sound absorption coefficient
curve obtained for the sample B4 is similar to the behaviour of the sample B3. In this case, the acoustic absorption of B4 decreases
from 0.282 t0 0.065 within the frequencies 50-100 Hz recording fluctuations over the frequency range of 125-1600 Hz having peak
value of 0.386 at 800 Hz. Comparing the acoustic behaviour of the base matrix to the mercerized composited, B1, B2, B3 and B4, it
was observed that addition of the treated fiber has negative impact on the absorption characteristics of the composites. It was
no-ticed that the sound absorption coefficient of the mercerized samples increased with increasing amount of fiber content in the
com-positions. Alkaline treatment using sodium hydroxide has been known to be effective not only for surface modification of natural
fibers used as reinforcement in composites but also increase the sound absorption coefficients of natural fiber composites [21]. In 0.000
0.100 0.200 0.300 0.400 0.500 0.600 0.700 0.800 0.900 1.000
50 200 350 500 650 800 950 1100 1250 1400 1550 1700
Soun
d
Abso
rption
Coefficien
t
(α)
Frequency (Hz)
PUF
B 1
B 2
B 3
this study, it has given rather an unexpected outcome; which may be related to the variation in the properties of the bagasse fibers
used, apart from the existence of various varieties; another reason could be maturity levels of the fibers (maturation period) which
also affects the fiber properties to an extent [22].
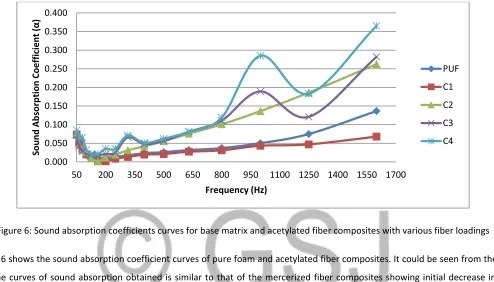
Figure 6: Sound absorption coefficients curves for base matrix and acetylated fiber composites with various fiber loadings
Figure 6 shows the sound absorption coefficient curves of pure foam and acetylated fiber composites. It could be seen from the
fig-ure, the curves of sound absorption obtained is similar to that of the mercerized fiber composites showing initial decrease in the
values of absorption within the frequency range of 50-160 Hz with different degrees of fluctuations between 200 Hz and 1600 Hz.
Sample with 5 wt% of acetylated fiber (C1) recorded a maximum absorption of 0.068 at 1600 Hz while sample with 10 wt% (C2), 15
wt% (C3) and 20 wt% (C4) acetylated fibers recorded maximum sound absorption coefficients of 0.068, 0.262, 0.282 and 0.365
re-spectively at frequency 1600 Hz. Comparing the performance of the composites with that of the base matrix, it was observed that no
significant improvement in absorption characteristics was recorded as a result of fiber acetylation in the polyurethane mixtures. This
shows that the further treatment of the fiber after mercerization could not impact positively on the acoustic absorption capabilities
of the composites. This could be as a result of similar reason advanced for same trend in mercerized composites [22]. The results
obtained for the acetylated composite samples also revealved that as the amount of the fiber is increased in the composition, the
sound absorption coefficient also increased.
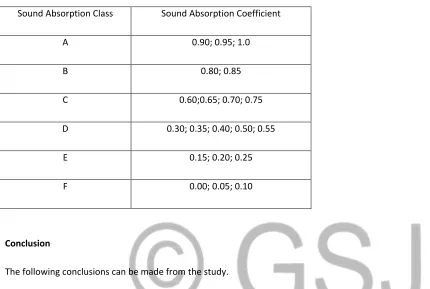
Based on the absorption classes described in the International Standard ISO 11654 (table I) the samples can be grouped as follows:
a. The crude composites A1, A2, A3 and A4 are described by high sound absorption coefficient values (0.836-0.925) for
fre-quency range between 1000-1250 Hz are class A
b. The mercerized (B1, B2, B3, B4) and acetylated (C1, C2, C3, C4) composites have low sound absorption coefficient values
(0.068-0.386) between the frequency range 800-1600 Hz are class D, E & F. 0.000
0.050 0.100 0.150 0.200 0.250 0.300 0.350 0.400
50 200 350 500 650 800 950 1100 1250 1400 1550 1700
Soun
d
Abso
rption
Coefficien
t
(α)
Frequency (Hz)
PUF
C1
C2
C3
Table 1, Sound absorption class and absorption coefficient (Source: ISO 11654:1997).
Sound Absorption Class Sound Absorption Coefficient
A 0.90; 0.95; 1.0
B 0.80; 0.85
C 0.60;0.65; 0.70; 0.75
D 0.30; 0.35; 0.40; 0.50; 0.55
E 0.15; 0.20; 0.25
F 0.00; 0.05; 0.10
Conclusion
The following conclusions can be made from the study.
1. Polyurethane-based sugarcane bagasse composites were successfully developed and their sound absorption performances
in the frequency range 50-1600 Hz have been studied.
2. Crude composite demonstrates superior sound absorption coefficient. Crude composite with 20 wt% fiber content (A4) has
the highest sound absorption coefficient of 0.925 within the frequency range of 1000 Hz and 1250 Hz and could be
com-pared to class A sound absorbers.
3. The sound absorption performances of the modified composites are inferior to that of unmodified composites and
mercer-ized composites B3, B4 and that of acetylated C4 could be categormercer-ized as class D sound absorbers
4. Based on classification of sound absorption materials, the likely area of application of composites A4, B3, B4 and C4 is in
buildings such as residentilal and class rooms.
Acknowlegements
The authors wish to acknowledge the authorities of Taraba State University, Jalingo, PSG College of Technology, Coimbatore, India
References
[1] Esther O. Aluko and Victor U. Nna (2015). Review Article: Impact of Noise Pollution on Human Cardiovascular System.
Interna-tional Journal of Tropical Disease & Health, ISSN: 2278-1005, Vol.: 6, Issue: 2, pp. 35-43.
[2]Pal Debasish and Bhattacharya Debasish (2012). Research Article: Effect of Road Traffic Noise Pollution on Human Work
Efficien-cy in Government Offices, Private Organizations, and Commercial Business Centers in Agartala City Using Fuzzy Expert System: A
Case Study. Advances in Fuzzy Systems, Volume 2012, Article ID 828593, 9 pages
[3]Olokooba S. M., Ibrahhim Imam, Abdulraheem-Mustapha M. A. (2010). Noise Pollution: A Major Catalyst to Climate Change and
Human Health Catastrophe. Retrieved from: http://unilorin.edu.ng/publications/imami.
[4]Zulkifli, R., M.J.M. Nor, A.R. Ismail, M.Z Nuawi and M.F.M. Tahir, (2009). Effect of Perforated Size and Gap Thickness on Acoustic
Properties of Coir fiber Sound Absorption Panels. Eur. J. Sci. Res., 28: 242-252.
[5]Zulkifli, R., M.J.M. Tahir, A.R. Ismail and M.Z. Nuawi, (2008). Acoustic Properties of Multilayer Coir Fibers Sound Absorption Panel.
J. Applied Sci., 8: 3709-3714.
[6]Mohd Jailani Mohd Nor., Md. Ayub, Rozli Zulkifli, Nowshad Amin and Mohammad Hosseini Fouladi (2010). Effect of Compression
on the Acoustic Absorption of Coir Fiber. American Journal of Applied Sciences 7 (9): 1285-1290.
[7]Yonghua Wang, Chengchun Zhang, Luquan Ren, Mohamed Ichchou, Marie-Annick Galland and Olivier Bareille (2013). Influences
of Rice Hull in Polyurethane Foam on its Sound Absorption Characteristics. Polymer Composites 2013, pages 1847-1855.
[8] Sylvia Thais Martins Carvalho, Lourival Marin mendes, Antonia Amanda da Silva Cesare, Jeimy Blanco Florez, Fabio Akira Mori,
Giovanni Francisco Rabelo (2015). Acoustic Characterization of Sugarcane Bagasse Particleboard Panels (Saccharum Officinarum L).
Material Research, 2015; 18(4): 821-827
[9]www.finelib.com. Retrieved from:
https://www.finelib.com/about/nigeria-cash-crops/sugarcane-production-and-the-states-that-grows-it-in-nigeria/149.
[10] Gunawan, T. Bantacut, M. Romli and E. Noor (2018). Biomass by-product from crystal sugar production: A comparative study
between Ngadirejo and Mauritius sugar mill. IOP Conf. Series: Earth and Environmental Science 141 (2018) 012009.
[11] Adedoyin Adelakun (2011). Nigeria Sugar Industry Falling Prices, Rising Prospects
[12] Sgriccia, N., Hawley, m. C., and Misra, M. (2008). Characterization of natural fiber surfaces and natural fiber composites.
Com-posites: Part A 39, 1632-1637.
[13] Bledzki, A. K., Mamun, A. A., Lucka-Gabor, M.and Gutowski, V. S. (2008): The effects of acetylation on properties of flax fibre
and its polypropylene composites. Express Polymer Letters, 2(6): 413– 422.
Properties of Sound Absorbing Materials Using a Three-Microphone Impedance Tube. Applied Acoustics, 71, 506–509.
[15] Peng Li, Yubo Tao and Sheldon Q. Shi (2014). Effect of Fiber Content and Temperature on the Dielectric Properties of Kenaf
fi-ber-filled Rigid Polyurethane Foam. BioResources 9 (2), 2681-2688.
[16] Gayathri R., Vasanthakumari R., and Padamanabhan C. (2013). Sound Absorption, Thermal and Mechanical Behaviour of
Polyu-rethane Foam Modified with Nano silica, Nano Clay and Crumb Rubber Fillers. International Journal of Scientific & Engineering
Re-search, Volume 4, Issue 5, pp.301-308.
[17] Elammaran jayamani, Sinin Hamdan and Nurizahusna binti Suid (2013). Applied Mechanic and Materials vol. 315, pp 577-581
[18] Chunhua Zhang, Junqing Li, Zhe Hu, Fenglei Zhu, Yudong Huang (2012). Correlation between the Acoustic and Porous Cell
Mor-phology of Polyurethane Foam: Effect of Interconnected Porosity. Materials and Design 41 (2012) 319-325.
[19] Seddeq, H. S. (2009). Factors Influencing Acoustic Performance of Sound Absorptive Materials. Australian Journal of Basic and
Applied Sciences, 3(4), 4610-4617.
[20] Elammaran Jayamani, Sinin Hamdan, Md Rezaur Rahman, Soon Kok Heng, and Muhammad khusairy Bin Bakri (2014). Processing
and Characterization on Chemical Treatment of Fibers on Mechanical and Acoustical Properties. Acoustic Absorbers, BioResources
9(3) 5542-5556.
[21] Elammaran Jayamani, Sinin Hamdan, Muhammad Khusairy Bin Bakri, Soon Kok Heng, Md Rezaur Rahman and Akshay Kakar
(2015). Analysis of Natural Fiber Polymer Composites: Effects of Alkaline Treatment on Sound Absorption. Journal of Reinforced
Plas-tics and Composites 2016, Vol. 35(9) 703–711.
[22] Asagekar, S., D. and Joshi V., K. (2013). Characteristics of Sugarcane Fibers. Indian Journal of Fiber & Textile Research Vol. 39,
June 2014, pp. 180-184.
[23] ASTM E1050-10 (2012). Standard Test Method for Impedance and Absorption of Acoustical Materials using a Tube, Two
micro-phones and a Digital frequency analysis system. ASTM International, West Conshohocken, PA.