RESEARCH
Estimated dead space fraction
and the ventilatory ratio are associated
with mortality in early ARDS
Luis Morales‑Quinteros
1*, Marcus J. Schultz
2,3,4, Josep Bringué
5,6, Carolyn S. Calfee
7,8,9, Marta Camprubí
5,
Olaf L. Cremer
10, Janneke Horn
2, Tom van der Poll
11,12, Pratik Sinha
7,8, Antonio Artigas
1,5,6, Lieuwe D. Bos
2,3,13and MARS Consortium
Abstract
Background: Indirect indices for measuring impaired ventilation, such as the estimated dead space fraction and the ventilatory ratio, have been shown to be independently associated with an increased risk of mortality. This study aimed to compare various methods for dead space estimation and the ventilatory ratio in patients with acute respira‑ tory distress syndrome (ARDS) and to determine their independent values for predicting death at day 30. The present study is a post hoc analysis of a prospective observational cohort study of ICUs of two tertiary care hospitals in the Netherlands.
Results: Individual patient data from 940 ARDS patients were analyzed. Estimated dead space fraction and the ventilatory ratio at days 1 and 2 were significantly higher among non‑survivors (p < 0.01). Dead space fraction calcula‑ tion using the estimate from physiological variables [VD/VT phys] and the ventilatory ratio at day 2 showed independent association with mortality at 30 days (odds ratio 1.28 [95% CI 1.02–1.61], p < 0.03 and 1.20 [95% CI, 1.01–1.40], p < 0.03, respectively); whereas, the Harris–Benedict [VD/VT HB] and Penn State [VD/VT PS] estimations were not associated with mortality. The predicted validity of the estimated dead space fraction and the ventilatory ratio improved the baseline model based on PEEP, PaO2/FiO2, driving pressure and compliance of the respiratory system at day 2 (AUROCC 0.72 vs. 0.69, p < 0.05).
Conclusions: Estimated methods for dead space calculation and the ventilatory ratio during the early course of ARDS are associated with mortality at day 30 and add statistically significant but limited improvement in the pre‑ dictive accuracy to indices of oxygenation and respiratory system mechanics at the second day of mechanical ventilation.
Keywords: Acute respiratory distress syndrome, ARDS, Respiratory dead space, Dead space, Ventilatory ratio, Intensive care unit, Prognostication, Prediction, Mortality
© The Author(s) 2019. This article is distributed under the terms of the Creative Commons Attribution 4.0 International License (http://creat iveco mmons .org/licen ses/by/4.0/), which permits unrestricted use, distribution, and reproduction in any medium, provided you give appropriate credit to the original author(s) and the source, provide a link to the Creative Commons license, and indicate if changes were made.
Background
The acute respiratory distress syndrome (ARDS) is an important cause of acute respiratory failure with a high mortality rate [1, 2]. Arterial oxygen tension (PaO2) to
fraction of inspired oxygen (FiO2) is the only measured
physiological variable in the Berlin Definition for ARDS [3]. The prognostic value of PaO2/FiO2 for mortality
prediction, however, is limited [4, 5]. More accurate markers are needed to predict outcome in the early course of ARDS.
Both increased V/Q heterogeneity and shunt are the more likely contributors to increased dead space in ARDS. It results from endothelial injury, microvas-cular plugging with cellular aggregates and thrombi, and disordered pulmonary blood flow, as well as
Open Access
*Correspondence: [email protected]
1 Intensive Care Unit, Hospital Universitari Sagrat Cor, Grupo Quironsalud, Carrer de Viladomat, 288, 08029 Barcelona, Spain
overdistention of alveolar units that may result from the heterogeneity within the injured lung and/or from the use of mechanical ventilation itself [6, 7]. Indeed, dead space fraction (VD/VT) during the first week after
the initial diagnosis is known to be a predictor of sur-vival, independent of oxygenation [8–10]. Dead space measurements, however, are not utilized routinely in clinical practice, probably due to the added costs of direct measurement techniques. Approximation meth-ods for estimating dead space fraction do not require direct measurement of exhaled carbon dioxide, are less complicated to perform, and feasible to calculate at the bedside [11]. Moreover, estimated dead space correlates well with mortality [12]. Recently, a clinically practical method, the ventilatory ratio (VR), has been validated for estimating pulmonary dead space. It can be calcu-lated using routinely measured respiratory variables at bedside. In patients with ARDS, VR positively cor-relates with dead space fraction [13], and could, there-fore, function as a surrogate for dead space fraction.
In this study, we hypothesized that indices of ventila-tory impairment early during the course of ARDS would have independent predictive value for 30-day mortality. In addition, we tested whether estimates of ventilatory impairment at day 2 outperform estimations at day 1.
Methods
Study design and ethical considerations
The study design was a post hoc analysis of the ‘Molec-ular Diagnosis and Risk Stratification of Sepsis’ (MARS) project, a prospective observational cohort study in the mixed medical–surgical intensive care units (ICUs) of two tertiary teaching hospitals in the Netherlands (the Aca-demic Medical Center in Amsterdam, and the University Medical Center in Utrecht) The study was registered at ClinicalTrials.gov (study identifier NCT01905033) [14]. Patients were included via an opt-out method, approved by the medical ethical committees of both hospitals.
Population
The parent study had the following two inclusion crite-ria: (a) being admitted to one of the participating ICUs; and (b) having an expected length of stay in ICU longer than 24 h. Patients aged under 18 years were excluded. The current analysis only included patients with ARDS diagnosis during the first 2 days of invasive mechanical ventilation. Patients who were invasively ventilated for less than 24 h were excluded from the analysis.
ARDS definition
ARDS was defined according to the Berlin Defini-tion [3] as acute hypoxemic respiratory failure, and the
concurrent presence of (1) ratio of arterial oxygen tension to inspired fraction of oxygen (PaO2/FIO2) of 300 mmHg
or less; (2) new bilateral pulmonary parenchymal abnor-malities on chest X-ray or computed tomography; and (3) ventilatory support with positive end-expiratory pressure (PEEP) of 5 cmH2O or more. ARDS was prospectively
diagnosed by a team of training research physicians. Case vignettes were used to train the research personnel in identifying chest radiology abnormalities consistent with ARDS.
Predictors
All formulas used to calculate dead space fraction, including the unadjusted Harris–Benedict [VD/VT HB]
[15, 16], Penn State [VD/VT PS] [16–19], and estimate
from physiological variables formulas [VD/VT phys] [11,
20], and the VR [21] are provided in Additional file 1. Cal-culation of the predictors was made once the patient was under mechanical ventilation for more than 24 h and met the ARDS criteria. Arterial blood gas, anthropometrics (height, measured body weight, predicted body weight, body mass index, body surface area, sex and age), and respiratory variables (tidal volume, tidal volume per pre-dicted body weight, respiratory rate, minute ventilation, minute ventilation per predicted body weight, PaCO2,
PaO2/FiO2, respiratory system compliance, PEEP, and
Murray lung injury score) were recorded. Blood gases were performed every 6 h as part of routine care. For the current analysis, we used the worst values for each day. PaCO2 levels and minute ventilation measurements were
taken during the same period of the day.
Endpoints
The primary endpoint was the predictive accuracy of the estimated dead space fraction and VR on mortal-ity at 30 days after ARDS diagnosis measured by area under the receiver operating characteristics curve (AUROCC), net reclassification improvement and inte-grated discrimination index on top of a model with other predictors of outcome and calibration.
Analysis plan
All data were analyzed using R studio built under R version 3.2.2 (R Core Team 2013, Vienna, Austria) [22]. Data distribution was assumed not to be nor-mally distributed for descriptive analysis and shown by median and interquartile range. Categorical vari-ables are presented as absolute numbers (percentages). The Kruskal–Wallis test was used to analyze continu-ous nonparametric data. Categorical data were ana-lyzed by χ2 tests. p < 0.05 was considered to represent
considered to be missing at random and were imputed using multiple imputation chain equations using the “MICE” package in R [23]. The analyses were repeated with non-imputed data to consider the influence of this step and are reported in Additional file 1: Tables S1 and S2.
Univariate analysis was performed for all respiratory and physiological parameters using logistic regression with 30-day mortality as the dependent variable and was summarized with the odds ratio, 95% confidence interval (95% CI), p-value and AUROCC per variable of interest. The independent effect of the estimated ven-tilation impairment indices was studied by adding the predictor variable to a logistic regression model with five pre-selected variables known to be associated with 30-day mortality: APACHE IV, PEEP, PaO2/FiO2,
driv-ing pressure, and compliance of the respiratory system. The goodness of fit of the logistic regression model was assessed with the Hosmer–Lemeshow test. Variation inflation below 2.5 was considered sufficient to rule out collinearity in the model. The independent association of estimates of impaired ventilation and outcome was visualized by plotting estimated dead space fraction and the covariates against mortality. Estimated dead space fraction and covariates were stratified per tertiles to show trends. Finally, the AUROCC, net reclassifica-tion improvement (NRI) and integrated discriminareclassifica-tion index (IDI) were used to determine whether estimated ventilation impairment indices improved predictive accuracy on top of that of the base model including PEEP, PaO2/FiO2, driving pressure and compliance of
the respiratory system. All analyses were performed for day 1 and day 2 of ARDS diagnosis. As a second-ary analysis, estimated ventilation impairment indexes were compared between Berlin severities of ARDS.
Results Patients
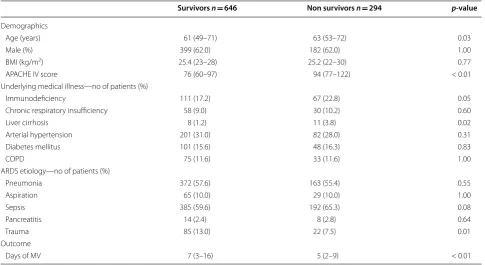
A total of 6994 admissions were included in MARS from January 2011 until December 2013. 965 patients ful-filled the criteria of ARDS, of whom 940 patients were mechanically ventilated for longer than 24 h (Additional file 1: Figure S1). Table 1 shows patient characteristics. Mortality at day 30 was 31%. Non-survivors were older than survivors and had a significantly higher APACHE IV score. Trauma was associated with a lower mortality. Liver cirrhosis and immunodeficiency presented signifi-cantly higher mortality.
Estimated indices
Driving pressure, respiratory rate, PaO2/FiO2 and
com-pliance of the respiratory system were significantly dif-ferent between survivors and non-survivors (Table 2).
All the estimated dead space fractions were significantly higher among non-survivors on day 1 and day 2. The VR was also significantly higher among non-survivors on day 1 and day 2 (Table 2). Figure 1 in this manuscript and from Additional file 1: Figure S2 show the mortality per tertile of dead space fraction for the first and second day of after the initial diagnosis, respectively, stratified for tertiles of PaO2/FiO2, PEEP, driving pressure and
compli-ance of the respiratory system. The figures give a visual representation of the relationship between the estimated dead space fraction and mortality, when stratified for PaO2/FiO2, PEEP, driving pressure and compliance of the
respiratory system. There was no significant difference in estimated ventilation impairment indexes between Ber-lin severity scores of ARDS on day 1 or day 2 (p= 0.49 or higher for each comparison; see Additional file 1: Fig-ures S3 and S4).
Mortality prediction with the estimated indices
Each estimate of dead space fraction was significantly associated with mortality at day 30 in unadjusted analyses for day 1 and day 2 (Table 2). After adjustment for pre-defined covariates (APACHE IV, PEEP, PaO2/FiO2,
driv-ing pressure and compliance of the respiratory system), the logistic regression model showed independent asso-ciation with mortality at day 30 for the estimated dead space fraction calculated by the direct formula (VD/VT phys) and the ventilatory ratio on day 2 (Table 3). The
Hos-mer–Lemeshow test indicated a good model fit for each of the tested predictors on days 1 and day 2 (p-value = 1). A sensitivity analyses only including patients without any missing data resulted in similar regression coefficients (Additional file 1: Table S1).
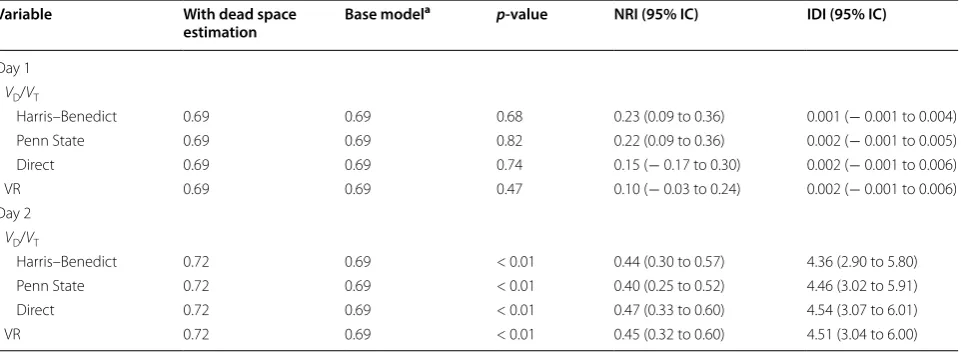
The AUROCC improved when the estimated dead space calculations and the VR were added to the base model (including APACHE IV score, PEEP, PaO2/FiO2,
driving pressure and compliance of the respiratory sys-tem as predictors) on day 2, but this effect was not observed on day 1 (Table 4). The addition of any estimate of dead space fraction improved the predictive accuracy of the baseline model at day 2 in terms of NRI and IDI but not at day 1 (Table 4).
Discussion
prognostic value. The added predictive accuracy on top of known predictors of outcome was not observed on the first day of invasive mechanical ventilation. Impaired ventilation does not seem to be associated with the severity of ARDS using the Berlin classification
but rather adds an additional dimension to an estima-tion of the severity of ARDS.
We found that a significant number of ARDS patients had high estimated dead space fractions in the early course of ARDS. These findings confirm those from Table 1 Baseline demographics and outcome of 940 patients with acute respiratory distress syndrome
Data reported as interquartile ratio
BMI body mass index, APACHE acute physiology and chronic health evaluation, COPD chronic obstructive pulmonary disease, VFD at day 28 ventilator‑free days and alive at day 28
Survivors n= 646 Non survivors n= 294 p-value
Demographics
Age (years) 61 (49–71) 63 (53–72) 0.03
Male (%) 399 (62.0) 182 (62.0) 1.00
BMI (kg/m2) 25.4 (23–28) 25.2 (22–30) 0.77
APACHE IV score 76 (60–97) 94 (77–122) < 0.01 Underlying medical illness—no of patients (%)
Immunodeficiency 111 (17.2) 67 (22.8) 0.05 Chronic respiratory insufficiency 58 (9.0) 30 (10.2) 0.60
Liver cirrhosis 8 (1.2) 11 (3.8) 0.02
Arterial hypertension 201 (31.0) 82 (28.0) 0.31 Diabetes mellitus 101 (15.6) 48 (16.3) 0.83
COPD 75 (11.6) 33 (11.6) 1.00
ARDS etiology—no of patients (%)
Pneumonia 372 (57.6) 163 (55.4) 0.55
Aspiration 65 (10.0) 29 (10.0) 1.00
Sepsis 385 (59.6) 192 (65.3) 0.08
Pancreatitis 14 (2.4) 8 (2.8) 0.64
Trauma 85 (13.0) 22 (7.5) 0.01
Outcome
Days of MV 7 (3–16) 5 (2–9) < 0.01
Table 2 Respiratory variables between survivors and non survivors at days 1 and 2
PEEP positive end‑expiratory pressure, ΔP driving pressure, Crs compliance of the respiratory system, PaCO2 partial pressure of carbon dioxide, VD/VT estimated dead
space fraction, VR ventilatory ratio
Variable Day 1 Day 2
Survivors n= 652
(QR) Non survivors
n= 288 (QR)
OR p-value Survivors n= 638
(QR) Non survivors
n= 253 (QR)
OR p-value
PEEP (cmH2O) 10 (5–12) 10 (6–13) 1.25 (1.02–1.53) 0.03 8 (5–12) 10 (6–12) 1.48 (1.14–1.92) < 0.01
ΔP 14 (10–19) 17 (11–22) 1.73 (1.39–2.14) 0.04 12 (9–17) 15 (11–21) 2.26 (1.84–2.80) 0.03 PaO2/FiO2 206 (154–261) 191 (136–255) 0.85 (0.71–1.02) 0.08 214 (160–266) 200 (143–245) 0.76 (0.63–0.92) < 0.01
Crs (ml/cmH2O) 33 (24–50) 27 (20–41) 0.82 (0.72–0.94) < 0.01 40 (28–66) 30 (20–50) 0.66 (0.56–0.80) 0.01
VD/VT
previous studies that have demonstrated that impaired ventilation can occur within hours after onset of ARDS [8–10, 24]. Dead space is the portion of each tidal volume that does not contribute to CO2 clearance and represents
a good global index of lung function efficiency. In ARDS, elevated VD/VT results from increased V/Q
heterogene-ity due to injury of capillaries by thrombotic and inflam-matory factors with obstruction of pulmonary blood in the pulmonary circulation and perhaps some degree of overdistention by mechanical ventilation. Shunt and low cardiac output states are known determinants of high VD/VT. However, these are features of impaired perfusion
rather than ventilation impairment per se [6].
We did not find a statically significant association between PaO2/FiO2 recorded at the first day of ARDS
and the primary outcome. Previous works in ARDS showed that PaO2/FiO2 may vary due to changes in
ventilatory parameters during the first 24 h of mechani-cal ventilation. These observations may explain why we did not find an association with mortality on the first day in our cohort [24–26].
Our results showed statistically significant but limited improvement in the prediction for mortality for each of the estimated dead space fraction, including the VR. An elevated physiological dead space fraction, calculated with the Bohr–Enghoff equation through volumetric cap-nography, has been shown to be a strong independent predictor of mortality in the early and intermediate phase of ARDS [8]. The first reports describing the independent association between dead space and mortality in ARDS used a Vt 10 ml/kg of IBW, which is an important fac-tor for increased dead space due to regional pulmonary overdistention or reduced cardiac output [9]. Our find-ings continue to show an association in mortality among the predictors studied in our cohort with Vt 6 ml/kg IBW, which may suggest intrinsic phenomena on ARDS patho-physiology or maybe other factors different from tidal volume overdistention, such as PEEP.
Dead space fraction was not included in the Berlin Definition. The consensus panel argued that because dead space fraction is challenging to measure, they choose to evaluate minute ventilation standardized at a PaCO2 of 40 mmHg as a surrogate instead [3, 27].
Addition of this surrogate resulted in the selection of a smaller group of patients and did not improve mortality stratification. Given the prognostic value of the hereby
evaluated surrogates of dead space ventilation, we pro-pose that ARDS patients could be categorized into those with failure of oxygenation and/or those with failure of ventilation. Such categories may facilitate a better under-standing between those patients who suffer most from shunt or dead space ventilation. This differentiation could lead to a better understanding of pathophysiological pro-cesses and lead to more consistent management strate-gies. Previous studies have highlighted that the degree of impaired ventilation also depends on the etiology of ARDS [10], e.g., pulmonary ARDS has a significantly higher VD/VT than those with non-pulmonary ARDS.
We did not test if there was a difference in the ventila-tion impairment measurements between pulmonary and extrapulmonary ARDS in our cohort.
The VR has been proposed as an alternative surrogate for dead space fraction. VR, which includes predicted minute ventilation and predicted PaCO2, had been
described to monitor ventilatory efficiency [28]. Recently, it was found to be independently associated with mortal-ity in ARDS patients [13], and we confirmed this finding. In the current study, VR was independently associated with mortality on day 2, but not on day 1 of ARDS. The advantage of VR is that it is easier to calculate than the estimations of dead space fraction with a similar, but maybe slightly lower predictive accuracy for the outcome.
Important limitations of this study exist. Estimated methods for dead space fraction use equations for energy expenditure or physiological variables [11, 15, 17–19]. The Harris-Benedict estimate predicted the measured dead space fraction with moderate accuracy but was associated with mortality [11]. Recently, the ventilatory ratio has been found to positively correlate with dead space in ARDS [13]. However, the VR has been only vali-dated in mandatory modes of ventilation. It is worth to know that CO2 production (V̇CO2) changes dramatically
once patients are off sedation and in spontaneous modes of ventilation [29]. Both the estimated VD/VT and VR
are determined by V̇CO2 which is an important factor in
CO2 homeostasis in critically ill patients and impacts any
measure of impaired ventilation [30, 31].
In this study, we did not routinely use controlled ven-tilation, but spontaneous effort was allowed and likely, due to limited use of sedation. This certainly has led to differences in estimations of dead space fraction as com-pared to a scenario where all patients would have been
Fig. 1 Association between estimated dead space fraction calculated by the Harris‑Benedict formula and mortality at 30 days stratified for covariables at day 2 of mechanical ventilation. Estimated dead space fraction (Harris–Benedict estimate) showing the association between VD/VT
separated in tertiles (left: < 0.58/middle: 0.58–0.68 and right: > 0.68) and mortality according to tertiles of PaO2/FiO2 (upper row), PEEP (second row),
under controlled ventilation, and could explain the lack of independent association with mortality in our study, except for the VD/VT phys which not include V̇CO2
meas-urements in its formula. In the future, the evaluation of the estimated measurements of impaired ventilation should incorporate a consideration of altered metabolism as it will impact the variation of CO2 production in ICU
patients.
It has been described in previous works that the PaO2/
FiO2 values during ARDS may vary and that the values
measured during the first 24 h of mechanical ventila-tion are not as predictive of outcomes [24, 25, 32]. This may be explained by the fact that PaO2/FiO2 due to some
causes can be improved by changing the mechanical ven-tilation settings, or due to rapid resolution of ARDS, per-haps because the underlying cause has been addressed effectively or because significant fluid overload was treated or prevented. These changes are typically made in
the first 24 h leading to rapid improvement in oxygena-tion in those patients with reversible causes. We believe that this not only applies to oxygenation but also glob-ally all gas exchange derangements, including ventila-tion impairment. We suspect that impaired ventilaventila-tion and shunt that can be reversed effectively in the first 24 h does not contribute to mortality and therefore, the asso-ciation between these parameters and outcome increases after the first day.
However, because we did still confirm the statisti-cally significant but limited improvement in the pre-dictive accuracy of the VR found in other studies, this is actually an advantage of the estimation of impaired ventilation as it increases the external validity of such measurement. Second, we were not able to quantify the correlation between VR and the estimated dead space fraction measurements, due to complexities second-ary to mathematical coupling [13]. Third, the associa-tion between the studied variables was attenuated after inclusion of the missing data. Because we were aware of this, we reported the lower effect size. On the other hand, the “true” predictive accuracy was statistically significantly higher but with limited improvement after imputation for missing data, as shown by the NRI and IDI, which estimate the added value of the VD/VT phys
and the VR for the second day of ARDS on top of the base model. However, although the IDI and the NRI are used to measure and evaluating the improvement in prediction performance of a prognostic marker, we suggest that their results and interpretation should be treated with caution as the interpretation is debated. Table 3 Multivariate analysis of the different VD/VT
estimates and VR at days 1 and 2 (N= 635)
Corrected for the following co‑variates: APACHE IV, PEEP, PaO2/FiO2, driving
pressure and compliance of the respiratory system
VD/VT estimated dead space fraction, VR ventilatory ratio
Variable Day 1 Day 2
OR (95% CI) p-value OR (95% CI) p-value
VD/VT
Harris–Benedict 1.13 (0.93–1.37) 0.20 1.15 (0.96–1.38) 0.11 Penn State 1.17 (0.96–1.44) 0.11 1.21 (0.98–1.50) 0.06 Direct 1.20 (0.97–1.48) 0.09 1.28 (1.02–1.61) 0.03 VR 1.13 (0.97–1.32) 0.10 1.20 (1.01–1.40) 0.03
Table 4 Area under the curve (AUC) differences and summary of added value for the predictive variables to the model at days 1 and 2
VD/VT estimated dead space fraction, VR ventilatory ratio, NRI net reclassification improvement, IDI integrated discrimination improvement a Base model includes APACHE IV, PEEP, PaO
2/FiO2, driving pressure and compliance of the respiratory system
Variable With dead space
estimation Base model
a p-value NRI (95% IC) IDI (95% IC)
Day 1
VD/VT
Harris–Benedict 0.69 0.69 0.68 0.23 (0.09 to 0.36) 0.001 (− 0.001 to 0.004) Penn State 0.69 0.69 0.82 0.22 (0.09 to 0.36) 0.002 (− 0.001 to 0.005) Direct 0.69 0.69 0.74 0.15 (− 0.17 to 0.30) 0.002 (− 0.001 to 0.006) VR 0.69 0.69 0.47 0.10 (− 0.03 to 0.24) 0.002 (− 0.001 to 0.006) Day 2
VD/VT
Besides these limitations, our study has some strengths. We studied a large prospectively enrolled cohort and, therefore, had sufficient power to detect significant differences in the primary outcome. This was an observational study that included all consecu-tive patients who developed ARDS in two ICUs over a 3-year period, thereby increasing the generalizability of the findings of the study. Despite using different equa-tions for estimating dead space ventilation fraction, they yielded similar results, suggesting validity of the findings. Furthermore, we used a predefined analysis in line with the latest recommendations for predictive research [33, 34].
The statistically significant but limited improvement of the added predictive value of the variables (dead space estimations and ventilatory ratio) shown in this study indicate that they may be useful bedside indices to moni-tor impaired ventilation in critically ill patients, and may offer clinicians information about ventilatory failure at the bedside. When direct measurements of dead space fraction are unavailable, dead space estimations may be used in place of direct measurement in clinical practice. Furthermore, the relative simplicity of calculation allows for the incorporation of dead space fraction surrogates in future clinical trials. Given the simplicity of ventilatory ratio to be easily calculated using routine bedside vari-ables, albeit, with known inherent limitations, it may be used as a tool to adjunct mortality estimation in patients with ARDS on day 2.
We believe that rather than a value in itself to be applied in isolation, dead space and its estimates should be understood as a marker to assess ARDS severity and therefore, it could be used to build a model based on oxygenation abnormalities (PaO2/FiO2) and respiratory
mechanics (PEEP) to track respiratory changes to pre-vent pre-ventilator-induced lung injury or avoid further lung deterioration. Thus, a modified lung injury score may aid in decision-making therapies and risk stratification for future clinical trials.
Conclusions
Estimations for impaired ventilation on the second day of mechanical ventilation may yield limited but help-ful prognostic information that is not captured by con-ventional oxygenation indices and respiratory system mechanics in patients with ARDS.
Supplementary information
Supplementary information accompanies this paper at https ://doi. org/10.1186/s1361 3‑019‑0601‑0.
Additional file 1. Estimated dead space fraction (Harris‑Benedict estimate) showing the association between VD/VT separated in tertiles
(left: < 0.58 / middle: 0.58–0.68 and right: > 0.68) and mortality according to tertiles of PaO2/FiO2 (upper row), PEEP (second row), driving pressure (third row) and compliance of the respiratory system (bottom row).
Abbreviations
APACHE IV: acute physiology and chronic health evaluation IV; ARDS: acute respiratory distress syndrome; AUROCC: area under the receiver operating characteristic curve; FiO2: fraction of inspired oxygen; ICU: intensive care unit; IBW: ideal body weight; IDI: integrated discrimination improvement; MARS: molecular diagnosis and risk stratification of sepsis; PaCO2: partial pressure of carbon dioxide in arterial blood; PEEP: positive end‑expiratory pressure; PaO2: partial pressure of oxygen in arterial blood; PaO2/FiO2: arterial oxygen tension to fraction of inspired oxygen; V̇CO2: carbon dioxide production; VR: ventila‑ tory ratio; VD/VT: dead space fraction.
Acknowledgements Not applicable.
Authors’ contributions
All the authors have contributed equally for the elaboration of this article. All authors read and approved the final manuscript.
Authors’ information
A complete list of members of the Molecular Diagnosis and Risk Stratification of Sepsis (MARS) Consortium is provided:
Amsterdam University Medical Centers, location AMC, Amsterdam, The Netherlands: Friso M. de Beer, Lieuwe D. Bos, Gerie J. Glas, Janneke Horn, Arie J. Hoogendijk, Roosmarijn T. van Hooijdonk, Mischa A. Huson, Tom van der Poll, Brendon Scicluna, Laura R. Schouten, Marcus J. Schultz, Marleen Straat, Lon‑ neke A. van Vught, Luuk Wieske, Maryse A. Wiewel, and Esther Witteveen.
University Medical Center Utrecht, Utrecht, The Netherlands: Marc J. Bonten, Olaf L. Cremer, Jos F. Frencken, Kirsten van de Groep, Peter M. Klein Klou‑ wenberg, Maria E. Koster–Brouwer, David S. Ong, Meri R. Varkila and Diana M. Verboom.
Funding
This article did not receive sponsorship for publication.
Availability of data and supporting materials
All data generated or analyzed during this study are included in this published article and its additional files.
Ethics approval and consent to participate Not applicable.
Consent for publication Not applicable.
Competing interests
Dr. Morales received support for this article research from Fisher & Paykel Healthcare Limited (FPH). Dr. Bos receives funding from the Dutch lung foundation. The remaining authors have disclosed that they do not have any potential conflicts of interest. This research was performed within the frame‑ work of the Center for Translational Molecular Medicine (CTMM) (http://www. ctmm.nl), project Molecular Diagnosis and Risk Stratification of Sepsis (Grant 04I‑201). The sponsor CTMM was not involved in the design and conduction of the study; nor was the sponsor involved in collection, management, analy‑ sis, and interpretation of the data or preparation, review or approval of the article. Decision to submit the article was not dependent on the sponsor.
Author details
5 Critical Care Center, ParcTaulí Hospital Universitari, Institut d’Investigació i Innovació Parc Taulí I3PT, Universitat Autònoma de Barcelona, Sabadell, Spain. 6 CIBER Enfermedades Respiratorias, Instituto de Salud Carlos III, Madrid, Spain. 7 Department of Medicine, Division of Pulmonary, Critical Care, Allergy and Sleep Medicine, University of California, San Francisco, San Francisco, CA, USA. 8 Department of Anesthesia, University of California, San Francisco, San Francisco, CA, USA. 9 Cardiovascular Research Institute, University of California, San Francisco, San Francisco, CA, USA. 10 Department of Intensive Care Medi‑ cine, University Medical Center Utrecht, Utrecht, The Netherlands. 11 Center of Experimental and Molecular Medicine, Academic Medical Center, University of Amsterdam, Amsterdam, The Netherlands. 12 Division of Infectious Diseases, Academic Medical Center, University of Amsterdam, Amsterdam, The Neth‑ erlands. 13 Department of Respiratory Medicine, Academic Medical Center, Amsterdam, The Netherlands.
Received: 29 July 2019 Accepted: 5 November 2019
References
1. The Acute Respiratory Distress Syndrome Network. Ventilation with lower tidal volumes as compared with traditional tidal volumes for acute lung injury and the acute respiratory distress syndrome. N Engl J Med. 2000;342:1301–8.
2. Bellani G, Laffey JG, Pham T, et al. Epidemiology, patterns of care, and mortality for patients with acute respiratory distress syndrome in inten‑ sive care units in 50 countries. JAMA. 2016;315:788–800.
3. Ranieri VM, Rubenfeld GD, Thompson BT, et al. Acute respiratory distress syndrome: the Berlin Definition. JAMA. 2012;307:2526–33.
4. Bersten AD, Edibam C, Hunt T, et al. Incidence and mortality of acute lung injury and the acute respiratory distress syndrome in three Australian states. Am J Respir Crit Care Med. 2002;165:443–8.
5. Seeley E, McAuley DF, Eisner M, et al. Predictors of mortality in acute lung injury during the era of lung protective ventilation. Thorax. 2009;63:994–8.
6. Tomashefski JF Jr, Davies P, Boggis C, et al. The pulmonary vascu‑ lar lesions of the adult respiratory distress syndrome. Am J Pathol. 1983;1983(112):112–26.
7. Greene R. Pulmonary vascular obstruction in the adult respiratory distress syndrome. J Thorac Imaging. 1986;1:31–8.
8. Nuckton TJ, Alonso JA, Kallet RH, et al. Pulmonary dead‑space fraction as a risk factor for death in the acute respiratory distress syndrome. N Engl J Med. 2002;346:1281–6.
9. Kallet RH, Alonso JA, Pittet JF, et al. Prognostic value of the pulmonary dead‑space fraction during the first 6 days of acute respiratory distress syndrome. Respir Care. 2004;49:1008–14.
10. Kallet RH, Zhuo H, Ho K, et al. Lung injury etiology and other factors influencing the relationship between dead‑space fraction and mortality in ARDS. Respir Care. 2017;62:1241–8.
11. Beitler JR, Thompson BT, Matthay MA, et al. Estimating dead‑space frac‑ tion for secondary analyses of acute respiratory distress syndrome clinical trials. Crit Care Med. 2015;43:1026–35.
12. Siddiki H, Kojicic M, Li G, et al. Bedside quantification of dead‑space fraction using routine clinical data in patients with acute lung injury: secondary analysis of two prospective trials. Crit Care. 2010;14:R141. 13. Sinha P, Calfee CS, Beitler JR, et al. Physiologic analysis and clinical perfor‑
mance of the ventilatory ratio in acute respiratory distress syndrome. Am J Respir Crit Care Med. 2019;199:333–41.
14. Klein Klouwenberg PM, Ong DS, Bos LD, et al. Interobserver agreement of Centers for Disease Control and Prevention criteria for classifying infec‑ tions in critically ill patients. Crit Care Med. 2013;41:2373–8.
15. Harris JA, Benedict FG. A biometric study of human basal metabolism. Proc Natl Acad Sci USA. 1918;4:370–3.
16. Weir JB. New methods for calculating metabolic rate with special refer‑ ence to protein metabolism. J Physiol. 1949;109(1–2):1–9.
17. Mifflin MD, St Jeor ST, Hill LA, et al. A new predictive equation for resting energy expenditure in healthy individuals. Am J Clin Nutr. 1990;51:241–7. 18. Frankenfield DC, Coleman A, Alam S, et al. Analysis of estimation methods
for resting metabolic rate in critically ill adults. JPEN J Parenter Enteral Nutr. 2009;33(1):27–36.
19. Frankenfield D. Validation of an equation for resting metabolic rate in older obese, critically ill patients. JPEN J Parenter Enteral Nutr. 2011;35:264–9.
20. Murray JF, Matthay MA, Luce JM, et al. An expanded difinition of the adult respiratory distress syndrome. Am Rev Respir Dis. 1988;138:720–3. 21. Sinha P, Fauvel NJ, Singh S, et al. Ventilatory ratio: a simple bedside meas‑
ure of ventilation. Br J Anaesth. 2009;102(5):692–7.
22. R Core Team. R: a language and environment for statistical computing. R Foundation for Statistical Computing. 2013. http://www.r‑proje ct.org/. Accessed 10 Dec 2018.
23. Buuren SV, Groothuis‑Oudshoorn K. Mice: multivariate imputation by chained equations in R. J Stat Softw. 2011;45(3):1–67.
24. Villar J, Pérez‑Méndez L, López J, et al. An early PEEP/FIO2 trial identifies different degrees of lung injury in patients with acute respiratory distress syndrome. Am J Respir Crit Care Med. 2007;176:795–804.
25. Squara P, Dhainaut JF, Artigas A, et al. Hemodynamic profile in severe ARDS: results of the European Collaborative ARDS Study. Intensive Care Med. 1998;24:1018–28.
26. Villar J, Blanco J, Añón JM, et al. The ALIEN study: incidence and outcome of acute respiratory distress syndrome in the era of lung protective venti‑ lation. Intensive Care Med. 2011;37:1932–41.
27. Wexler HR, Lok P. A simple formula for adjusting arterial carbon dioxide tension. Can Anaesth Soc J. 1981;28:370–2.
28. Sinha P, Sanders RD, Soni N, et al. Acute respiratory distress syndrome: the prognostic value of ventilatory ratio—a simple bedside tool to monitor ventilatory efficiency. Am J Respir Crit Care Med. 2013;187:1150–3. 29. Rose DK, Froese AB. Changes in respiratory pattern affect dead space/
tidal volume ratio during spontaneous but not during controlled ventila‑ tion: a study in pediatric patients. Anesth Analg. 1980;59:341–9. 30. Liposky JMNL. Ventilatory response to high caloric loads in critically ill
patients. Crit Care Med. 1994;22:796–802.
31. Weissman C, Kemper M, Damask MC, et al. Effect of routine intensive care interactions on metabolic rate. Chest. 1984;86:815–8.
32. Madotto F, Pham T, Bellani G, et al. Resolved versus confirmed ARDS after 24 h: insights from the LUNG SAFE study. Intensive Care Med. 2017;44:564–77.
33. Moons KG, Kengne AP, Woodward M, et al. Risk prediction models: I. Development, internal validation, and assessing the incremental value of a new (bio)marker. Heart. 2012;98:683–90.
34. Moons KG, Kengne AP, Grobbee DE, et al. Risk prediction models: II. External validation, model updating, and impact assessment. Heart. 2012;98:691–8.
Publisher’s Note