ARTICLE
Effects of Continuity of Care in Infancy on Receipt of
Lead, Anemia, and Tuberculosis Screening
Ana I. Flores, BSa, Warren B. Bilker, PhDb, Evaline A. Alessandrini, MD, MSCEa,b
aDepartment of Pediatrics, Children’s Hospital of Philadelphia and University of Pennsylvania School of Medicine, Philadelphia, Pennsylvania;bCenter for
Clinical Epidemiology and Biostatistics, University of Pennsylvania, Philadelphia, Pennsylvania
The authors have indicated they have no financial relationships relevant to this article to disclose.
ABSTRACT
OBJECTIVES.The goals were (1) to examine the influence of continuity of care on
delivery of lead, anemia, and tuberculosis screening in a cohort of Medicaid-enrolled children, (2) to determine whether well-child care continuity had a greater effect than continuity for all ambulatory visits, and (3) to investigate which aspects of continuity were most associated with receipt of these screening services.
METHODS.A prospective birth cohort of 1564 Medicaid-enrolled infants was studied.
Continuity of care scores for the first 6 months of life were calculated for total ambulatory visits and well-child care visits. Outcomes of interest were performance ofⱖ1 screening for lead toxicity, anemia, and tuberculosis during the first 24 months of life.
RESULTS.For total ambulatory visits, children with complete continuity of care (the
same practitioner seen for every visit) were more than twice as likely to receive lead screening, compared with children who saw a different practitioner for every visit, irrespective of the measurement technique used. Similarly, children with complete continuity were 1.5 to 2 times more likely to have been screened for tuberculosis. Continuity showed a lesser, but still significant, effect on anemia screening. Well-child care visit continuity of care had less impact on screening performance than did total visit continuity of care.
CONCLUSIONS.In this study, greater continuity of care in infancy was associated with
increased likelihood of receiving screening for lead toxicity, anemia, and tuberculosis in the first 24 months of life. The dimension of continuity of care that was most influential in this population was dispersion of visits among different practitioners.
P
REVENTIVE HEALTH CAREis essential to promoting the health and development of children. Screening is availablefor potentially dangerous health problems in young children, including lead toxicity, iron-deficiency anemia, and tuberculosis. Lead toxicity in early life has been shown to be associated with decreased IQ later in childhood.1,2The
potential adverse effects of iron-deficiency anemia in infancy include problems with psychomotor development and damage to the visual and auditory systems.3,4 Although the incidence of tuberculosis in the United States is
decreasing, tuberculosis remains significant for children because it is more likely to progress from latent to active disease and can lead to serious complications such as tuberculosis meningitis.5Despite these known negative effects,
many children are not receiving proper screening,6–9particularly children shown to be at increased risk, such as those
from urban low-income families.5,9–17Attempts to improve preventive care services that have shown some success
include patient education, practice-level interventions, reminder systems for patients and practices, and implemen-tation of new office systems.18–22However, few studies have looked specifically at increasing rates of lead, anemia, and
tuberculosis screening.23–25 Additional methods for improving receipt of these screening services are needed, and
continuity of care (COC) with a primary practitioner may play an important role.
COC has long been viewed as a fundamental part of the definition of primary care by the Institute of Medicine26
and is essential for providing quality health care. Studies have shown consistently that COC improves patient satisfaction,27,28receipt of preventive care,29and utilization of health care services.30,31COC is perhaps most important
www.pediatrics.org/cgi/doi/10.1542/ peds.2007-1497
doi:10.1542/peds.2007-1497
Key Words
continuity of care, Medicaid, screening, early childhood, urban
Abbreviations COC— continuity of care WCC—well-child care UPC— usual provider of care B&B—Bice and Boxerman SECON—sequence continuity CI— confidence interval IQR—interquartile range OR— odds ratio
Accepted for publication Jul 20, 2007
Address correspondence to Evaline A. Alessandrini, MD, MSCE, Children’s Hospital of Philadelphia, 3535 Market St, Room 1542, Philadelphia, PA 19104. E-mail: alessandrini@ email.chop.edu
in the pediatric population, because of the greater fre-quency of health care visits and the need to establish a foundation for future health care use. In the pediatric population, high COC has been shown to be associated with parental reports of high quality of care,32 fewer
emergency department visits33 and hospitalizations,34
timely measles-mumps-rubella vaccination,35and
up-to-date immunizations at 2 years of age.36These outcomes
are clearly essential to providing quality health care, and COC is a key component in ensuring they are accom-plished.
Many methods of quantifying COC have been devel-oped, with little agreement regarding which is the most appropriate measure. Each available technique empha-sizes different aspects of COC, and scores for the same pattern of health care visits vary depending on the mea-surement index used. Jee and Cabana37suggested
clas-sifying COC indices into 5 categories, that is, (1) duration of the practitioner-patient relationship, (2) density of visits to a single practitioner, (3) dispersion of visits among practitioners, (4) sequence of practitioners seen, and (5) subjective estimates. Studies typically examine only 1 dimension of COC, with density being the most frequently studied measure. In determining the influ-ence of COC, it is important to examine multiple mea-sures, to account for the varying dimensions of COC and to determine the best approach to improving COC de-livery. In addition, it has been suggested that, in evalu-ating COC in pediatric populations, separate analyses of COC for well-child care (WCC) visits alone, rather than for all visits combined, may be important,37although this
is rarely found in literature reports.
In this study, we examined the influence of COC on delivery of lead, anemia, and tuberculosis screening in Medicaid-enrolled children. We hypothesized that in-creased COC would be associated with inin-creased screen-ing, with WCC COC having a greater influence. Finally, we investigated the different dimensions of COC, to determine whether any are more important for this population and therefore should be targeted for inter-vention strategies.
METHODS
Study Population
We conducted a prospective birth cohort study of 1564 Medicaid-enrolled infants born between July 1999 and March 2001, at 2 urban teaching hospitals and 1 subur-ban community hospital in the Philadelphia area. Eligi-bility criteria for infants included birth weight ofⱖ2 kg, gestational age ofⱖ34 weeks, and nursery stay ofⱕ10 days. Families that did not have an English- or Spanish-speaking person in the home were excluded.
We collected data on maternal, infant, and household characteristics through hospital chart reviews and ma-ternal interviews during the postpartum period. We made calls to study families at 2, 4, 6, 12, and 24 months and asked mothers to report all sites where their child had received care during that time. We reviewed charts in all primary care offices where care was received. In this chart review, we obtained ambulatory visit data
(including the name of the practitioner seen) for the first 6 months and screening data for the first 24 months of life. Information on primary care practice characteristics, including number of full-time practitioners, hours of operation, and percentage of Medicaid-enrolled patients served, were collected through surveys sent to each in-fant’s primary care practice.
Predictor
Our primary predictor of interest was COC during the first 6 months of life for (1) total ambulatory visits and (2) WCC visits. Health care visits from all ambulatory sites were reviewed by a trained research assistant, who abstracted the visit date and the name of the treating practitioner. Visits were categorized as WCC or non-WCC on the basis of abstracted diagnoses. Ambulatory visits included visits to primary practices for either WCC or sick visits and excluded visits to the emergency de-partment or specialists. Because COC cannot exist for only 1 visit, total ambulatory COC scores were calculated for infants with ⱖ2 ambulatory visits and WCC COC scores were determined for infants withⱖ2 WCC visits. For comprehensive assessment of COC, we used mea-surement techniques from 3 of the 5 identified COC categories, namely, density, dispersion, and sequence. We chose the usual provider of care (UPC) method38as
our density measure because it is the most frequently used method in the literature. Many measures of disper-sion are used in the literature, including the method described by Bice and Boxerman (B&B),39the modified
continuity index,40the modified modified continuity
in-dex,41and the index described by Ejlertsson.42We used
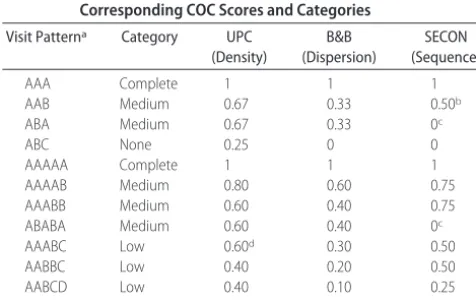
each of these methods to calculate COC for our popula-tion, and we obtained similar results with all methods. Here we report only the results for the B&B method. Sequence continuity (SECON) is currently the only in-dex of continuity for an individual patient that accounts for the sequence of visits.43Table 1 describes each COC
measure and provides the formula to calculate it.
Categorizing COC
No consistent definitions of what constitutes high and low COC have been used in the literature. Some studies divided populations into tertiles to define high, medium, and low COC,32,34,35whereas others defined high and low
were chosen on the basis of scores corresponding to visit patterns considered clinically important. Because a score of 0 is not possible when using UPC, the no, low, and medium continuity groups were based on clinically sig-nificant visit patterns. Scores of 1 for UPC were consid-ered to indicate complete continuity.
Outcomes
The outcomes of interest were receipt of screening tests for lead, anemia, and tuberculosis at least once during the first 24 months of life. The Advisory Committee on Childhood Lead Poisoning Prevention issued recom-mendations in December 2000, stating that all children enrolled in Medicaid should receive blood lead screening at 12 and 24 months.44In 1998, the Centers for Disease
Control and Prevention published a recommendation that infants at high risk for iron-deficiency anemia, in-cluding those from low-income families, should receive universal screening between 9 and 12 months of age, 6 months later, and annually from 2 to 5 years of age.45
During the time of this study, accepted practice in Phil-adelphia was to screen for tuberculosis at 1, 3, 5, and 11 years of age. On the basis of these standards, our
out-comes of interest wereⱖ1 screen for lead, 1 screen for anemia with a complete blood count, and 1 screen for tuberculosis with a purified protein derivative skin test.
Covariates
Infant, maternal, and health care characteristics col-lected via medical chart reviews, maternal interviews, and practice surveys were included in our analyses. These variables were chosen because of their association with either COC or receipt of preventive screening tests in the medical literature. These covariates are listed in Table 3.
Statistical Analyses
In the first stage of our analysis, categorical variables were described by using proportions with 95% confi-dence intervals (CIs), continuous variables with ranges, means with SDs, and medians with interquartile ranges (IQRs). The 4-level COC variable was described as the proportion of patients within each category (with 95% CI). Our outcomes for screening were dichotomized with respect to whether the infant was screened and are presented as proportions (with 95% CIs). In the second stage, we examined associations between levels of COC and screening, depicting the proportion of children screened within each COC level for each dimension. We used logistic regression models to assess the relationship between COC and receipt of lead, anemia, and tubercu-losis screening. In the third stage, we investigated pos-sible confounders of the relationship between COC and screening. We added relevant maternal, infant, and practice characteristics and visit frequency to our regres-sion models. Variables that changed the coefficient for COC byⱖ15% were considered confounders and were included in our final models. We tested adequate WCC for possible effect modification with COC. At the time of the study, the American Academy of Pediatrics recom-mended 4 WCC visits in the first 6 months of life.46,47
Because data collection ended when each infant was exactly 6 months of age, which might not have allowed time for the 6-month visit, we defined adequate WCC as
ⱖ3 WCC visits. We dichotomized COC by comparing no COC (COC⫽0) with all others, no COC with complete COC (COC⫽1), and complete COC with all others. We
TABLE 2 Examples of Visit Patterns for 3 and 5 Visits, With Corresponding COC Scores and Categories
Visit Patterna Category UPC
(Density)
B&B (Dispersion)
SECON (Sequence)
AAA Complete 1 1 1
AAB Medium 0.67 0.33 0.50b
ABA Medium 0.67 0.33 0c
ABC None 0.25 0 0
AAAAA Complete 1 1 1
AAAAB Medium 0.80 0.60 0.75
AAABB Medium 0.60 0.40 0.75
ABABA Medium 0.60 0.40 0c
AAABC Low 0.60d 0.30 0.50
AABBC Low 0.40 0.20 0.50
AABCD Low 0.40 0.10 0.25
ABCDE None 0.20 0 0
aEach letter represents a different provider.
bValue not shown in appropriate COC category; appropriate category is low. cValue not shown in appropriate COC category; appropriate category is no continuity. dValue not shown in appropriate COC category; appropriate category is medium.
TABLE 1 COC Measures
Measure Description Equation Variable Definitions Minimum Maximum Category Cutoff
Points
UPC (density) Ratio of number of visits to most frequently seen provider to total number of visits
UPC⫽no/N N⫽total number of visits,no⫽
number of visits to most frequently seen practitioner
Approaches 0 1 None:ⱕ0.3; low:⬎0.3 and⬍0.6; medium: ⱖ0.6 and⬍1; complete: 1 B&B (dispersion) Accounts for all practitioners
seen and number of visits to each practitioner
N⫽total number of visits,n⫽number of visits to practitionerj, s⫽number of practitioners seen
0 1 None: 0; low:⬎0 and ⱕ0.3; medium:
⬎0.3 and⬍1; complete: 1 SECON (sequence) Examines pairs of visits to
determine whether same practitioner was seen for consecutive visits
N⫽total number of visits,⌰t⫽1 if
visitstandt⫹1 are to same practitioner and otherwise 0
0 1 None: 0; low:⬎0 and ⱕ0.5; medium:
then compared the odds ratios (ORs) for children with adequate and inadequate WCC for each of the screening tests. If a statistically significant difference in the ORs was seen, then an interaction term was added to the model and thePvalue was examined for the significance of this term. Final models included a test for trend, to determine whether increasing levels of COC were asso-ciated with increased likelihood of screening.
RESULTS
Study Population
Of the 1564 infants enrolled in the study, 1356 (87%) completed follow-up evaluation and hadⱖ2 ambulatory visits and 1286 (82%) hadⱖ2 WCC visits in the first 6 months of life. Infant, maternal, and practice character-istics for the participants withⱖ2 total ambulatory visits andⱖ2 WCC visits are summarized in Table 3.
Study infants were seen at 117 different health care practices. The median number of full-time practitioners at each practice was 9 (IQR: 0 –18). The median number of ambulatory visits in the first 6 months was 5 (IQR: 3–7), and the median number of WCC visits was 3 (IQR: 2– 4). The median number of practitioners seen was 3 (IQR: 1–5)
for all ambulatory visits and 2 (IQR: 0 – 4) for WCC visits. A total of 723 infants (53%; 95% CI: 51%–56%) were screened for lead, 818 (60%; 95% CI: 58%– 63%) for anemia, 451 (33%; 95% CI: 31%–36%) for tuberculosis, and 285 (21%; 95% CI: 19%–23%) for all 3 conditions.
COC
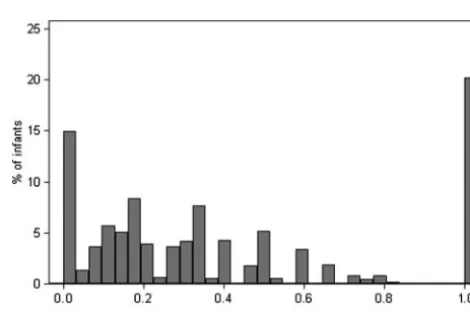
The distributions of COC for each measure are shown in Figs 1 to 3. The mean ⫾SD scores for UPC, B&B, and SECON were 0.61⫾0.26, 0.40⫾0.35, and 0.43⫾0.36, respectively.
Lead Screening
Lead screening increased significantly with increasing COC in all 3 dimensions examined (Table 4), although the dis-persion (B&B) measure had a greater effect than the den-sity (UPC) and sequence (SECON) measures. The WCC COC showed a similar trend, with slightly less of an effect. These models are adjusted for 2 confounders, namely, ur-ban residence and receiving care at a practice with more than one half of patients enrolled in Medicaid.
Anemia Screening
Compared with lead screening, total visit COC had a lower, but still significant, association with receiving
FIGURE 1
Distribution of total visit COC scores with the UPC (density) measure.
TABLE 3 Characteristics of Participants
n(%)
ⱖ2 Total Visits (n⫽1356)
ⱖ2 WCC Visits (n⫽1286)
Infant Race
Black 824 (61) 778 (61)
White 120 (9) 294 (23)
Hispanic 339 (25) 115 (9)
Other 102 (8) 99 (8)
Male 713 (53) 673 (52)
First born 564 (42) 539 (42)
Urban 1016 (75) 960 (75)
Mother
Foreign born 249 (18) 241 (19)
Single 1103 (81) 1044 (81)
Education (⬍12 y) 607 (45) 579 (45)
Teen 405 (30) 384 (30)
Unemployed 480 (35) 472 (37)
Father in home 493 (36) 472 (37)
Adequate prenatal care 707 (52) 682 (53)
Practicea
Type
Hospital-based 540 (40) 512 (40)
Private office 479 (36) 452 (36)
Community or federally qualified health center
316 (24) 302 (24)
Evening hours 817 (62) 776 (62)
Weekend hours 824 (63) 784 (63)
Evening and weekend hours 720 (55) 684 (55) No. of full-time practitioners
1 118 (9) 114 (9)
2–5 267 (20) 246 (19)
6–10 541 (40) 520 (40)
⬎10 430 (32) 406 (32)
More than one half Medicaid patients 940 (73) 897 (73)
aPatient-level analysis; each practice was represented multiple times.
FIGURE 2
anemia screening. The dispersion and sequence mea-sures, but not the density measure, of COC showed significant associations (Table 5). WCC COC did not have a significant effect on anemia screening for any of the 3 measures.
Tuberculosis Screening
With increasing total visit COC, the likelihood of receiv-ing tuberculosis screenreceiv-ing improved for all 3 COC sures (Table 6). In this case, density and dispersion mea-sures had greater effects than did the sequence measure. Unlike with lead and anemia screening, WCC continuity had a greater effect than did total visit COC.
Visit Frequency and Adequate WCC
The total number of ambulatory visits did not have a significant independent effect on screening for lead (OR: 1.0; 95% CI: 0.9 –1.0), anemia (OR: 1.1; 95% CI: 1.0 – 1.1), or tuberculosis (OR: 0.9; 95% CI: 0.9 –1.0). The number of WCC visits also did not independently influ-ence the receipt of screening for lead (OR: 1.0; 95% CI: 0.9 –1.1), anemia (OR: 1.1; 95% CI: 1.0 –1.2), or tuber-culosis (OR: 0.9; 95% CI: 0.8 –1.0). Finally, adequacy of
WCC did not modify the effect of any measure of COC on receipt of screening tests.
DISCUSSION
Low rates of preventive screening services for lead tox-icity, anemia, and tuberculosis continue to be a signifi-cant problem. Children from low-income families are at higher risk of suffering from these conditions and are less likely to receive screening. Wide ranges of preven-tive service delivery rates have been reported for differ-ent populations.17 In our cohort of Medicaid-enrolled
children, 53% were up to date for lead testing at 24 months of age, 60% for anemia, and 38% for tubercu-losis. Methods of increasing screening rates in this pop-ulation need to be identified, to improve the health and development of these children. Various studies have suggested that practice education interventions and im-plementation of new office systems can improve preven-tive care delivery.18–25 In this study, we showed that
higher COC was associated with increased likelihood of receiving screening; therefore, efforts to improve conti-nuity should be pursued.
Many studies have demonstrated the importance of COC in improving health care outcomes.27–36 Higher
COC has been shown to be associated with timely and up-to-date immunizations in children.35,36 To date, no
studies have examined quantitatively the influence of COC on other preventive care measures in a pediatric population. The goal of this study was to determine whether children who receive high COC are more likely to receive recommended screening for lead, anemia, and tuberculosis. Our results indicated that high COC during infancy was associated with increased performance of these tests in the first 24 months of life. Children with complete COC (the same practitioner seen for every visit) were⬎2 times more likely to receive lead screen-ing than were children who saw a different practitioner for every visit, irrespective of the measurement tech-nique used. Similarly, when complete COC was com-pared with no COC for tuberculosis screening, children with complete COC were 1.5 to 2 times more likely to
TABLE 4 Adjusted ORs for Lead Screening According to COC Category
Continuity Index Category Total Visits WCC Visits
n(%) Proportion Screened
(95% CI), %
OR (95% CI)a n(%) Proportion Screened
(95% CI), %
OR (95% CI)a
UPC (density) None 162 (12) 49 (41–57) 1 95 (7) 48 (38–59) 1
Low 531 (39) 49 (45–53) 1.1 (0.8–1.6) 459 (36) 48 (44–53) 1.1 (0.7–1.7)
Medium 389 (29) 56 (51–61) 1.5 (1.1–2.1) 328 (26) 56 (51–62) 1.6 (1.0–2.6)
Complete 274 (20) 60 (54–66) 2.0 (1.4–2.8)b 404 (31) 60 (55–65) 1.9 (1.2–3.1)b
B&B (dispersion) None 199 (15) 44 (37–51) 1 353 (27) 48 (43–53) 1
Low 447 (33) 52 (47–57) 1.7 (1.2–2.5) 162 (13) 50 (42–58) 1.2 (0.8–1.7)
Medium 436 (32) 55 (50–59) 1.9 (1.3–2.7) 367 (29) 55 (50–60) 1.5 (1.1–2.0)
Complete 274 (20) 60 (54–66) 2.7 (1.8–3.9)b 404 (31) 60 (55–65) 1.9 (1.4–2.6)b
SECON (sequence) None 344 (25) 49 (44–55) 1 438 (34) 50 (45–55) 1
Low 558 (67) 52 (48–56) 1.3 (1.0–1.8) 326 (25) 52 (46–57) 1.1 (0.9–1.5)
Medium 180 (13) 55 (47–62) 1.6 (1.1–2.4) 118 (9) 55 (46–64) 1.2 (0.8–1.9)
Complete 274 (20) 60 (54–66) 2.0 (1.4–2.9)b 404 (31) 60 (55–65) 1.7 (1.3–2.3)b
aAdjusted for urban residence and primary practices with one half or more Medicaid-enrolled patients. bPfor trend⬍.001.
FIGURE 3
have been screened. Continuity showed a lower, but still significant, effect on anemia screening.
Because preventive care is traditionally delivered dur-ing WCC visits, we hypothesized that COC for these visits would be more important than total visit COC in influencing health screening. Our results, however, in-dicated that WCC COC did not influence up-to-date lead screening as much as did total visit COC and the rela-tionship between WCC COC and anemia screening was not significant. For tuberculosis screening, increased to-tal COC and WCC COC were associated with increased screening. This indicates that all visits, not just WCC visits, are important in establishing relationships with patients and families and meeting their health care needs, including preventive health care. Furthermore, familiarity between patients and clinicians may facilitate performance of health screening even at sick visits,
be-cause the patient’s personal history, risk factors, and history of screening are better known.
Previous analysis of this cohort found that up-to-date immunization status was associated with the number of health care visits the infant made in the first 6 months, rather than COC.48 This is likely attributable to the
at-tention that immunization status receives as a quality indicator for pediatric health care, which results in a focus on receipt of immunizations at every visit, regard-less of the physician seen. In contrast, we found that screening tests were associated positively with COC in this population but were not associated with a greater number of health care visits.
We used 3 measurement techniques for determining COC in 3 (density, dispersion, and sequence) of the 5 dimensions of COC suggested by Jee and Cabana.37
Pre-vious studies focused on only 1 measurement technique
TABLE 5 Adjusted ORs for Anemia Screening According to COC Category
Continuity Index Category Total Visits WCC Visits
n(%) Proportion Screened
(95% CI), %
OR (95% CI)a
n(%) Proportion Screened
(95% CI), %
OR (95% CI)a
UPC (density) None 162 (12) 61 (53–69) 1 95 (7) 61 (51–71) 1
Low 531 (39) 57 (53–62) 1.0 (0.7–1.4) 459 (36) 59 (54–64) 0.9 (0.6–1.5)
Medium 389 (29) 63 (58–68) 1.3 (0.9–1.7) 328 (26) 62 (57–67) 1.1 (0.7–1.8)
Complete 274 (20) 61 (55–67) 1.2 (0.8–1.6)b 404 (31) 61 (56–65) 1.1 (0.7–1.8)c
B&B (dispersion) None 199 (15) 50 (43–57) 1 353 (27) 59 (53–64) 1
Low 447 (33) 61 (56–65) 1.7 (1.2–2.4) 162 (13) 57 (49–65) 1.0 (0.7–1.4)
Medium 436 (32) 64 (60–69) 2.0 (1.4–2.8) 367 (29) 63 (58–68) 1.2 (0.9–1.7)
Complete 274 (20) 61 (55–58) 1.7 (1.2–2.5)d 404 (31) 62 (57–67) 1.2 (0.9–1.6)b
SECON (sequence) None 344 (25) 56 (50–61) 1 438 (34) 60 (55–65) 1
Low 558 (67) 62 (58–66) 1.4 (1.0–1.8) 326 (25) 60 (52–71) 1.0 (0.8–1.4)
Medium 180 (13) 63 (56–70) 1.5 (1.0–2.2) 118 (9) 62 (52–70) 1.1 (0.7–1.6)
Complete 274 (20) 61 (55–67) 1.3 (1.0–1.9)e 404 (31) 62 (57–67) 1.1 (0.9–1.5)f
aAdjusted for urban residence. bPfor trend⫽.001. cPfor trend⫽.002. dPfor trend⬍.001. ePfor trend⫽.08. fPfor trend⫽.003.
TABLE 6 Adjusted ORs for Tuberculosis Screening According to COC Category
Continuity Index Category Total Visits WCC Visits
n(%) Proportion Screened
(95% CI), %
OR (95% CI)a n(%) Proportion Screened
(95% CI), %
OR (95% CI)a
UPC (density) None 162 (12) 17 (12–24) 1 95 (7) 11 (5–19) 1
Low 531 (39) 28 (24–32) 1.3 (0.8–1.9) 459 (36) 23 (19–27) 1.9 (0.9–4.1)
Medium 389 (29) 42 (37–47) 1.9 (1.3–2.9) 328 (26) 39 (34–45) 3.7 (1.7–8.0)
Complete 274 (20) 40 (35–47) 2.0 (1.2–3.1)b 404 (31) 44 (39–49) 4.1 (1.9–8.8)b
B&B (dispersion) None 199 (15) 21 (16–27) 1 353 (27) 17 (13–21) 1
Low 447 (33) 27 (23–31) 1.2 (0.8–1.9) 162 (13) 25 (19–33) 1.9 (1.1–3.1)
Medium 436 (32) 41 (36–46) 1.8 (1.2–2.9) 367 (29) 39 (34–44) 2.7 (1.8–4.0)
Complete 274 (20) 41 (35–47) 2.0 (1.2–3.2)b 404 (31) 45 (40–50) 3.1 (2.1–4.5)b
SECON (sequence) None 344 (25) 26 (22–31) 1 438 (34) 20 (16–24) 1
Low 558 (67) 34 (30–38) 1.2 (0.8–1.6) 326 (25) 35 (30–41) 1.8 (1.2–2.6)
Medium 180 (13) 35 (28–42) 1.2 (0.7–1.9) 118 (9) 35 (26–44) 1.7 (1.0–2.8)
Complete 274 (20) 41 (35–47) 1.5 (1.0–2.3)b 404 (31) 45 (40–50) 2.3 (1.6–3.3)b
and therefore do not provide information on what as-pect of COC should be the focus of attempts to improve health care outcomes. Our goal was to determine whether particular components of COC are more strongly associated with receipt of preventive care ser-vices. Analysis of total ambulatory visit COC showed that the dispersion measure (B&B) had a greater effect than density (UPC) and sequence (SECON). Dispersion methods differ from density measures in that they add the components of the number of practitioners seen and the number of visits to each practitioner, rather than simply the number of visits to a single practitioner, com-pared with all other visits. This suggests that, in attempts to maximize COC to improve health outcomes, the focus should be not only on increasing the number of visits to the primary provider but also on decreasing the number of practitioners from whom a patient seeks care. A pos-sible way to accomplish this in larger practices would be to assign each patient to a smaller cluster of 2 or 3 practitioners within the practice. SECON examines the order in which the practitioners are seen. Higher SECON scores were associated with up-to-date screening but were less important than dispersion. These results indi-cate that less emphasis can be placed on ensuring that the same practitioner is seen for consecutive visits when seeking to improve preventive care; however, this may not be true when outcomes for a series of visits for a specific illness are examined.
In this study, we examined COC only in the first 6 months of life, when health care visits are most frequent. However, COC beyond this early infant time frame is also likely to be associated with optimal use of health services. To obtain more information about how COC changes over time and how this affects the relationship between COC and receipt of screening tests, future stud-ies that monitor patients over a longer period of time are needed. We did not account for emergency department visits or specialist visits when calculating COC. Including these visits in the calculations would have decreased the COC scores for a subset of patients. Because screening tests are not typically performed in these settings, we thought that inclusion of these visits was not indicated. We looked at only 3 of the 5 dimensions of COC and did not include the duration of the practitioner-patient re-lationship or subjective estimates. Because the time pe-riod over which the study was conducted was short and fixed, durations of care were similar for all patients and would not have provided additional information for this group. Subjective estimates were not obtained at the time of the study because we sought to focus on quan-tifiable methods of determining COC, although parent perception is important and may be a valuable compo-nent to consider in future studies.
Our study group consisted of Medicaid-enrolled infants in the Philadelphia area, and results may not be generaliz-able to other populations. Because this is an urban low-income population, the patients are at higher risk of not receiving proper screening, and targeting this vulnerable group is important. Our data on specific practice character-istics was somewhat limited. For instance, we did not have information regarding whether the practices had electronic
records or office systems to alert providers when it was time for screening. Studies have shown the benefits of these methods in improving vaccination rates and delivery of other preventive services,18–25and they might have been
an important predictor in this population as well. We also did not have information on whether the practices had the resources to perform blood tests on site, which could play an important role in determining whether children receive screening.
Our results suggest that COC is an important part of ensuring adequate preventive service delivery to a vul-nerable population. The next step is to identify ways to improve COC and to predict which children are at risk of not receiving it. Increasing COC is difficult in the pedi-atric population because of the frequency of acute visits, for which families may prefer to see the first physician available, rather than waiting to see their regular physi-cian. Targeting improvement of COC for WCC visits, which typically are scheduled in advance, may be the most feasible first step in increasing overall continuity. Although the association between WCC COC and pre-ventive service delivery was less clear than that for total visit continuity, enhancing WCC COC could establish a pattern that would lead to improved overall COC.
ACKNOWLEDGMENTS
Dr Alessandrini was supported by a career development award from the National Institute of Child Health and Human Development (grant K23HD001320) and Ms Flores by a clinical research fellowship from the Doris Duke Charitable Foundation.
We thank Colleen Brensinger and the Biostatistics Analysis Center at the University of Pennsylvania for help with the data analysis for this study. In addition, we thank Dr Michael Cabana for encouraging us to explore the various dimensions of COC.
REFERENCES
1. Needleman HL, Gastonis CA. Low-level lead exposure and the IQ of children: a meta-analysis of modern studies.JAMA.1990; 263(5):673– 678
2. Bellinger DC, Stiles KM, Needleman HL. Low-level lead expo-sure, intelligence and academic achievement: a long-term fol-low-up study.Pediatrics.1992;90(6):855– 861
3. Algarin C, Peirano P, Garrido M, Pizarro F, Lozoff B. Iron deficiency anemia in infancy: long-lasting effects on auditory and visual system functioning.Pediatr Res.2003;53(2):217–223 4. Walter T, DeAndraca I, Chadud P, Perales CG. Iron deficiency anemia: adverse effects on infant psychomotor development. Pediatrics.1989;84(1):7–17
5. Nelson LJ, Schneider E, Wells CD, Moore M. Epidemiology of tuberculosis in the United States, 1993–2001: the need for continued vigilance.Pediatrics.2004;114(2):333–341
6. Bordley WC, Margolis PA. The delivery of immunization and other preventive services in private practices.Pediatrics.1996; 97(4):467– 473
7. Holl JL, Szilagyi PG, Rodewald LE, et al. Evaluation of New York State’s Child Health Plus: access, utilization, quality of health care, and health status.Pediatrics.2000;105(3 suppl E):711–718 8. Kaufman RB, Clouse TL, Olson DR, Matte TD. Elevated blood
9. Binder S, Matte TD, Kresnow M, Houston B, Sacks JJ. Lead testing of children and homes: results of a national telephone survey.Public Health Rep.1996;111(4):342–346
10. Brody DK, Pirkle JL, Kramer RA, et al. Blood lead levels in the US population: phase 1 of the Third National Health and Nu-trition Examination Survey (NHANES III, 1988 to 1991). JAMA.1994;272(4):277–283
11. Vivier PM, Hogan JW, Simon P, Leddy T, Dansereau LM, Alario AJ. A statewide assessment of lead screening histories of pre-school children enrolled in a Medicaid managed care program. Pediatrics. 2001;108(2). Available at: www.pediatrics.org/cgi/ content/full/108/2/e29
12. Owen GM, Lubin AH, Garry PJ. Pre-school children in the United States: who has iron deficiency?J Pediatr.1971;79(4): 563–568
13. Czajka-Narins DM, Haddy TB, Kallen DJ. Nutrition and social correlates in iron deficiency anemia. Am J Clin Nutr. 1978; 31(6):955–960
14. Abernathy RS. Tuberculosis: an update. Pediatr Rev. 1997; 18(2):50 –58
15. US General Accounting Office. Lead Poisoning: Federal Health Care Programs Are Not Effectively Reaching at Risk Children. Wash-ington, DC: General Accounting Office; 1999. Publication GAO/HEHS-98-78
16. Fairbrother G, Friedman S, DuMont KA, Lobach KS. Markers for primary care: missed opportunities to immunize and screen for lead and tuberculosis by private physicians serving large numbers of inner-city Medicaid-eligible children. Pediatrics. 1996;97(6):785–790
17. Chung PJ, Lee TC, Morrison JL, Schuster MA. Preventive care for children in the United States: quality and barriers.Annu Rev Public Health.2006;27:491–515
18. Margolis PA, Stevens R, Bordley WC, et al. From concept to application: the impact of a community-wide intervention to improve the delivery of preventive services to children. Pediat-rics. 2001;108(3). Available at: www.pediatrics.org/cgi/ content/full/108/3/e42
19. Szilagyi PG, Bordley C, Vann JC, et al. Effect of patient reminder/recall interventions on immunization rates.JAMA. 2000;284(14):1820 –1827
20. Sinn JS, Morrow AL, Finch AB. Improving immunization rates in private pediatric practices through physician leadership. Arch Pediatr Adolesc Med.1999;153(6):597– 603
21. Briss PA, Rodewald LE, Hinman AR, et al. Reviews of evidence regarding interventions to improve vaccination coverage in children, adolescents, and adults: the Task Force on Commu-nity Preventive Services. Am J Prev Med. 2000;18(1 suppl): 97–140
22. LeBaron CW, Chaney M, Baughman AL, et al. Impact of mea-surement and feedback on vaccination coverage in public clin-ics, 1988 –1994.JAMA.1997;277(8):631– 635
23. Bordley CW, Margolis PA, Stuart J, Lannon C, Keyes L. Im-proving preventive service delivery through office systems. Pediatrics. 2001;108(3). Available at: www.pediatrics.org/cgi/ content/full/108/3/e41
24. Margolis PA, Lannon CM, Stuart JM, Fried BJ, Keyes-Elstein L, Moore DE. Practice based education to improve delivery sys-tems for prevention in primary care: randomized trial.BMJ. 2004;328(7436):388 –392
25. Shaw JS, Wasserman RC, Barry S, et al. Statewide quality im-provement outreach improves preventive services for young chil-dren.Pediatrics. 2006;118(4). Available at: www.pediatrics.org/ cgi/content/full/118/4/e1039
26. Institute of Medicine, Division of Health Manpower and Re-sources Development.A Manpower Policy for Primary Health Care: Report of a Study. Washington, DC: Institute of Medicine; 1978 27. Breslau N, Mortimer EA. Seeing the same doctor: determinants
of satisfaction with specialty care for disabled children.Med Care.1981;19(7):741–758
28. Chao J. Continuity of care: incorporating patient perceptions. Fam Med.1988;20(5):333–337
29. Weiss LJ, Blustein J. Faithful patients: the effect of long-term physician-patient relationships on the costs and use of health care by older Americans. Am J Public Health. 1996;86(12): 1742–1747
30. Gill JM, Mainous AG, Nsereko M. The effect of continuity of care on emergency department use.Arch Fam Med.2000;9(4): 333–338
31. Gill JM, Mainous AG. The role of provider continuity in pre-venting hospitalizations.Arch Fam Med.1998;7(4):352–357 32. Christakis DA, Wright JA, Zimmerman FJ, Bassett AL, Connell
FA. Continuity of care is associated with high-quality care by parent report. Pediatrics. 2002;109(4). Available at: www. pediatrics.org/cgi/content/full/109/4/e54
33. Brousseau DC, Meurer JR, Isenberg ML, Kuhn EM, Gorelick, MH. Association between infant continuity of care and pediatric emergency department utilization. Pediatrics. 2004;113(4): 738 –741
34. Christakis DA, Mell L, Koepsell TD, Zimmerman FJ, Connell FA. Association of lower continuity of care with greater risk of emergency department use and hospitalization in children. Pediatrics.2001;107(3):524 –529
35. Christakis DA, Mell L, Wright JA, Davis R, Connell FA. The association between greater continuity of care and timely mea-sles-mumps-rubella vaccination. Am J Public Health. 2000; 90(6):962–965
36. Smith PJ, Santoli J, Chu SY, Ochoa DQ, Rodewald LE. The association between having a medical home and vaccination coverage among children eligible for the Vaccines for Children program.Pediatrics.2005;116(1):130 –139
37. Jee SH, Cabana MD. Indices of continuity of care: a systematic review of the literature.Med Care Res Rev.2006;63(2):158 –188 38. Breslau N, Reeb KG. Continuity of care in a university-based
practice.J Med Educ.1975;50(10):965–969
39. Bice TW, Boxerman SB. A quantitative measure of continuity of care.Med Care.1977;15(4):347–349
40. Godkin MK, Rice CA. A measure of continuity of care for physicians in practice.Fam Med.1984;16(4):136 –140 41. Magill MK, Senf J. A new method for measuring continuity of
care in family practice residencies.J Fam Pract.1987;24(2):165–168 42. Ejlertsson G. Assessment of patient/doctor continuity in pri-mary medical care.J R Coll Gen Pract Occas Pap.1980;(10):7–10 43. Steinwachs DM. Measuring provider continuity in ambulatory care: an assessment of alternative approaches.Med Care.1979; 17(6):551–565
44. Advisory Committee on Childhood Lead Poisoning Prevention. Recommendations for blood lead screening of young children enrolled in Medicaid: targeting a group at high risk.MMWR Recomm Rep.2000;49(RR-14):1–13
45. Centers for Disease Control and Prevention. Recommendations to prevent and control iron deficiency in the United States. MMWR Recomm Rep.1998;47(RR-3):1–29
46. American Academy of Pediatrics, Committee on Practice and Ambulatory Medicine. Recommendations for preventive pedi-atric health care.Pediatrics.1995;96(2):373–374
47. American Academy of Pediatrics, Committee on Practice and Ambulatory Medicine. Recommendations for preventive pedi-atric health care.Pediatrics.2000;105(3):645– 646
DOI: 10.1542/peds.2007-1497
2008;121;e399
Pediatrics
Ana I. Flores, Warren B. Bilker and Evaline A. Alessandrini
Tuberculosis Screening
Effects of Continuity of Care in Infancy on Receipt of Lead, Anemia, and
Services
Updated Information &
http://pediatrics.aappublications.org/content/121/3/e399
including high resolution figures, can be found at:
References
http://pediatrics.aappublications.org/content/121/3/e399#BIBL
This article cites 32 articles, 12 of which you can access for free at:
Subspecialty Collections
http://www.aappublications.org/cgi/collection/standard_of_care_sub Standard of Care
_management_sub
http://www.aappublications.org/cgi/collection/administration:practice Administration/Practice Management
following collection(s):
This article, along with others on similar topics, appears in the
Permissions & Licensing
http://www.aappublications.org/site/misc/Permissions.xhtml
in its entirety can be found online at:
Information about reproducing this article in parts (figures, tables) or
Reprints
http://www.aappublications.org/site/misc/reprints.xhtml
DOI: 10.1542/peds.2007-1497
2008;121;e399
Pediatrics
Ana I. Flores, Warren B. Bilker and Evaline A. Alessandrini
Tuberculosis Screening
Effects of Continuity of Care in Infancy on Receipt of Lead, Anemia, and
http://pediatrics.aappublications.org/content/121/3/e399
located on the World Wide Web at:
The online version of this article, along with updated information and services, is
by the American Academy of Pediatrics. All rights reserved. Print ISSN: 1073-0397.