PERFORMANCE CALCULATION OF
WAVELET TRANSFORMS FOR
REMOVAL OF BASELINE WANDER
FROM ECG
AMIT KUMAR MANOCHA*
Department of Electrical and Electronics Engineering, Shivalik Institute of Engineering & Technology, Ambala, Haryana, INDIA
GEETA KAUSHIK
Department of Electronics & Communication Engineering, M.M. University, Mullana, Ambala, INDIA
UDAI SINGH
Department of Electronics & Communication Engineering, M.M. University, Mullana, Ambala, INDIA Abstract :
As change in ST segment is an indication of ischemia in ECG and usually baseline wanders which are low frequency component of 0.5 to 1 Hz signal overlaps the ST segment in ECG, when the ECG is recorded by the electrodes from the chest of the patient. So Baseline wanders may makes wrong interpretation for the detection of ischemia and removal of baseline wander may cause another loss of important clinical information. This paper is to present the wavelet transform for estimation of baseline wanders in ECG and to find the effectiveness of this method by the Percent Root Mean Square Difference (PRD). Obtained results show that the wavelet transform approach performs successfully removal of baseline wanders. To test the proposed method, ECG signals obtained from European ST-T database have been used.
Keywords: ECG, baseline wanders, ST segment, noise, and wavelet transforms.
1. INTRODUCTION TO ECG & ARTIFACTS
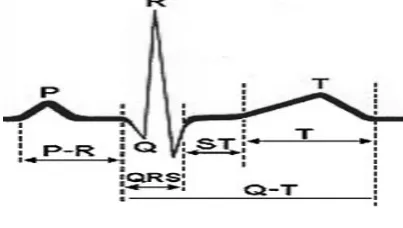
A typical ECG tracing of the cardiac cycle (heartbeat) consists of a P wave, a QRS complex, a T wave, and a U wave which is normally visible in 50 to 75% of ECG. The P wave represents the sequential activation depolarization of the right and left atria, the QRS complex is corresponds to right and left ventricular depolarization and T wave results from repolarization of the ventricles and is of a longer duration than QRS complex. The ST segment represents the time between the ventricular depolarization and repolarization. The baseline voltage of the ECG is known as the isoelectric line and the isoelectric line is measured as the portion of the tracing following the T wave and preceding the next P wave [P. Ranjith, et.al (2003)].
Figure 1- The Normal ECG waveform
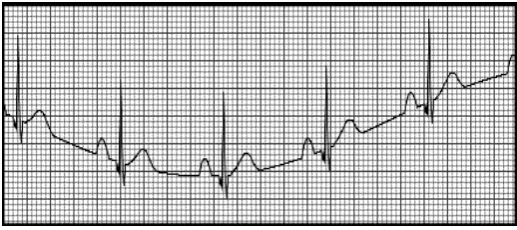
electrical interference by outside sources, electrical noise from elsewhere in the body, poor contact, and machine malfunction. Artifacts are extremely common, and knowledge of them is necessary to prevent misinterpretation of a heart's rhythm. As ECG includes slow baseline drift, varying ST-T patterns in ECG of same patient, muscle noise, and power line interference [S. Hargittai (2008a)]. Baseline wander is an extraneous, low-frequency activity in the ECG, which may interfere with the signal analysis, rendering the clinical interpretation inaccurate and misleading. Three types of predominant noise that commonly contaminate the signal are baseline wander (BW) noise, electromyographic (EMG) interference, and 50 or 60 Hz power line interference. In wandering baseline, the isoelectric line changes position. One possible cause is the cables moving during the reading. Patient movement, dirty lead wires/electrodes, loose electrodes, and a variety of other things can cause this as well as shown in figure 2. Among them baseline wander noise is a significant noise for diagnose purpose because the baseline wandering mostly affect the ST segment, which is further used for the identification of ischemia by ECG [C. Papaloukas, D. I. Fortiadis (2001)], [F. Censil, et.al (2008)]. But in doing so we need to preserve the important clinical information of ECG signal so as to use it for ECG characterization. So this we prefer the wavelet transform. The main reason for using wavelet transform is the properties of good representation of non-stationary signal such as ECG signal and the possibility of dividing the signal into different bands of frequency [J. Vila, J. Presedo (1997)], [S. Hargittai (2008b)].
Figure 2- Baseline Wandering Artifact
2. WAVELET TRANSFORM:
Wavelets are generated from one single function (basis function) called the mother wavelet. Mother Wavelet is a prototype for generating the other window functions. The mother wavelet is scaled or dilated by a factor of ‘a’ and translated or shifted by a factor of b to give (under Morlet's original formulation) [S. kadambe et.al (1999)]:
a b t a t b a
1 , ... (1)Where a and b are two arbitrary real numbers. ‘a’ and ‘b’ represent the dilations and translations parameters respectively in the time axis. The parameter ‘a’ contracts (t) in the time axis when a < 1 and expands or stretches when a > 1. Hence ‘a’ is called the dilation (scaling) parameter. For a < 0, the function results in time reversal with dilation. Mathematically, when‘t’ is replaced in equation by (t – b) it causes a translation or shift in the time axis resulting in the wavelet function. It is very helpful in analyzing the signal that contains sharp spikes and discontinuities. The mother wavelet can be represented by (ψ (t)) and the baby wavelet (B(t))are obtain by scaling the mother wavelet to form family of wavelet. They are written as
ψ(t) = ….(2)
B(t) = ψ{(t – τ)/ } ….(3)
chouakri, et.al(2005)].
3. PERFORMANCE ANALYSIS:
For the performance analysis, we have used the Percent Root Mean Square Difference (PRD). PRD has taken different definitions in different research reports. The most acceptable definition of PRD is given by the formula:
PRD = X 100 ...(4)
Where is the original standard signal and is the reconstructed signal is the mean signal, usually defined as the mean value of the original signal. However some researchers do not take into account an estimate of mean signal ( ) in the definition, therefore, PRD reported by them is obviously much less. Thus is it important to use the same definition of PRD, preferably taking an estimate of mean signal ( ) while comparing the performance of any algorithm[Na Pan et.al(2007)].
4. RESULTS AND DISCUSSION:
In order to process baseline removal algorithm, one would need to acquire an ECG segment possessing an isoelectric level baseline, add a known signal simulating one, compute the baseline deviation from the contaminated ECG and finally compute the error associated to the baseline extraction method. For this scheme to be effective, the used ECG segment must be as ‘‘clean’’ as possible (i.e. isoelectric level baseline). For this, we use the data (ECG samples) taken from European ST-T database. Firstly it was made noise free (basic) signal by taking its median in order to bring this to zero level as shown in figure 4. Then sine wave (artificial baseline) of 1 Hz was added to the noise free signal in order to make the signal incorporated with baseline wanders. Then by applying wavelet transforms (Decomposition and Reconstruction) at different scaling and by different wavelet transforms, one important step is applied here is that the approximation coefficients after decomposition was to be zero. The figure shows the results for the same. The first pane of figure shows the original signal taken from European ST-T database, second shows the basic signal, third shows the basic signal added with baseline(a sine wave), fourth shows the baseline estimated and last pane shows the basic/baseline free signal obtained after applying the wavelet transform. In order to check the reconstruction of basic signal by wavelet transform, the PRD has been calculating at various scales and by various wavelet transforms.
In order to check the reconstruction of basic signal by wavelet transform, the PRD has been calculated at various scales and by various wavelet transform. The table shows the performance of various wavelets
Table1 Performance of Various Wavelet Transforms
Sr. No. Wavelet used Decomposition Level PRD
1 db4 7 1.2422 2 db4 8 1.1512 3 db4 9 2.5434 4 db4 10 2.9012 5 Db5 8 0.9523 6 Db6 8 0.2237 7 Db7 7 0.1649 8 Coif3 8 8.7472 9 Coif3 7 0.5766 10 Coif4 7 7.3876 11 Coif4 8 14.985 12 Sym3 7 1.1151 13 sym3 8 0.8972 14 Sym3 9 0.7676 15 Sym3 10 3.7274 16 Sym4 8 1.0411 17 Sym4 7 1.1055
4. Conclusion and future work
The results show the removal of baseline wander or low frequency from ECG has been performed successfully by wavelet transform. The accurate reconstruction of baseline free signal after removal of baseline signal or estimation of baseline by wavelet transform is that the best given value of PRD is 0.1649 at 7th level by db7 wavelet. For future work, the use of Empirical mode decomposition may give better results.
References
[1] P. Ranjith, P.C. Baby, P. Joseph (2003), “ECG Analysis using Wavelet Transform: Application to Myocardial Ischemia Detection”, Elsevier ITBM-RBM 24, pp. 44-47.
[2] S. Hargittai (2008), “Efficient and Fast ECG Baseline Wander Reduction without Distortion of Important Clinical Information”, Computers in Cardiology, pp. 841-844.
[4] F. Censil, G. Calcagnini, P. Bartolini, E. Cervi, I. Diemberger, I. Corazza, G. Boriani (2008), “Effect of ECG Filtering on Time Domain Analysis of the P wave”, Computers in Cardiology, pp. 1077-1080.
[5] J. Vila, J. Presedo (1997), “Sutil: Intelligent Ischemia Monitoring System”, International Journal of Medical Informatics, pp.193-214.
[6] S. Hargittai (2008), “Efficient and Fast ECG Baseline Wander Reduction without Distortion of Important Clinical Information" IEEE Conferences on Computers in Cardiology, pp 351-356.
[7] S. kadambe, G. faye Boueaux Bartels (1999), “Wavelet Transform based QRS Complex Detector”, IEEE Transaction on Biomedical Engineering, vol. 3, pp 838-847.
[8] B. Mozaffary, Mohammad A. Tinati (2005), “ECG Base Line Elimination Using Wavelet Packets” Journal Of World Academy of science, Engg. and Tech. vol 5, pp14-15.
[9] S.A. chouakri, F. B. Regig, S Ahmaidi, O Fokapu (2005), “Wavelet Denoising of The Electrocardiogram Signal Based On The Corrupted Noise Estimation”, IEEE computer in Cardiology Conference, vol. 32, pp 1021-1024.