MEASURING OBJECT-ORIENTED
SYSTEMS BASED ON THE
EXPERIMENTAL ANALYSIS OF THE
COMPLEXITY METRICS
J.S.V.R.S.SASTRY*,
M tech student, C.S.E Department, GITAM University, Visakhapatnam-45, Visakhapatnam, Andhra Pradesh, India
Dr. K.V.RAMESH**,
Professor, C.S.E Department, GITAM University, Visakhapatnam-45, Visakhapatnam, Andhra Pradesh, India
M.PADMAJA***
Asst Prof, C.S.E Department, GITAM University, Visakhapatnam-45, Visakhapatnam, Andhra Pradesh, India
Abstract:
Metrics are used to help a software engineer in quantitative analysis to assess the quality of the design before a system is built. The focus of Object-Oriented metrics is on the class which is the fundamental building block of the Object-Oriented architecture. These metrics are focused on internal object structure and external object structure. Internal object structure reflects the complexity of each individual entity such as methods and classes. External complexity measures the interaction among entities such as Coupling and Inheritance. This paper mainly focuses on a set of object oriented metrics that can be used to measure the quality of an object oriented design. Two types of complexity metrics in Object-Oriented paradigm namely Mood metrics and Lorenz & Kidd metrics. Mood metrics consist of Method inheritance factor(MIF), Coupling factor(CF), Attribute inheritance factor(AIF), Method hiding factor(MHF), Attribute hiding factor(AHF), and polymorphism factor(PF). Lorenz & Kidd metrics consist of Number of operations overridden (NOO), Number operations added (NOA), Specialization index(SI). Mood metrics and Lorenz & Kidd metrics measurements are used mainly by designers and testers. Designers uses these metrics to access the software early in process, making changes that will reduce complexity and improve the continuing capability of the design. Testers use to test the software for finding the complexity, performance of the system, quality of the software. This paper reviews Mood metrics and Lorenz & Kidd metrics are validates theoretically and empirically methods. In this paper, work has been done to explore the quality of design of software components using object oriented paradigm. A number of object oriented metrics have been proposed in the literature for measuring the design attributes such as inheritance, coupling, polymorphism etc. This paper, metrics have been used to analyze various features of software component. Complexity of methods involved is a predictor of how much time, effort, Cost is required to develop and maintain the class. If a large number of methods can be invoked in response to a message, the testing and debugging of the class becomes more complicated since it requires a greater level of understanding on the part of the tester.
Keywords: Mood metrics, Lorenz & Kidd metric, Mood metric, Method inheritance factor (MIF), Coupling factor (CF), Method hiding factor (MHF), Specialization index (SI).
1. Introduction
I. Need for Metrics
complexity of each individual entity such as methods and classes, and on external complexity that measures the interactions among entities, such as coupling and inheritance. The metrics measures computational complexity that efficiency of an algorithm and the use of machine resources, as well as psychological complexity factors that affect the ability of a programmer to create, comprehend, modify and maintain software.
Mainly metrics are categorized into procedural metrics and Object-Oriented metrics. This paper only discussed about Object-Oriented metrics. Object-Oriented metrics are categorized into Mood metrics and Lorenz & kidd metrics. By using Mood metrics we can calculate the Method inheritance factor(MIF), Coupling factor(CF), Attribute inheritance factor(AIF), Method hiding factor(MHF), Attribute hiding factor(AHF). By using Lorenz & Kidd metrics we can calculate the Number of operations overridden (NOO), Number operations added (NOA), Specialization index (SI).
Main objective for this paper is to measure the quality of an object oriented design, access the software early in process, making changes that will reduce complexity and improve the continuing capability of the design, finding the bugs, finding complexity of the system, test performance of the system, test quality of the software. Some previous researched papers are:
Fernando Brito e Abreu et al[1]. proposed a set of metrics suitable for evaluating the use of the main abstractions of the Object-Oriented paradigm such as inheritance, encapsulation, information hiding or polymorphism and the emphasis on reuse that, together, are believed to be responsible for the increase in software quality and development productivity. Software metrics play an important role allowing, among other things, better planning, the assessment of improvements, the reduction of unpredictability, early identification of potential problems and productivity evaluation. He concluded that, the adoption of the Object-Oriented paradigm is expected to help produce better and cheaper software. The main concepts of this paradigm, namely, inheritance, encapsulation, information hiding or polymorphism, are the keys to foster reuse and achieve easier maintainability.
Tobias Mayer et al.[7] developed new metrics that are suited to the Object-Oriented paradigm. The MOOD metricshave been subjected to much empirical evaluation, with claims made regarding the usefulness of the metrics to assess external attributes such as quality and maintainability. This paper shows that any such empirical validation is premature due to the majority of the MOOD metrics being fundamentally flawed. The metrics fail to meet the MOOD team's own criteria, and in certain cases inaccurate. He concluded that further work needs to put in to improving and testing the MOOD metrics before attempting to apply them to real life systems.
Mohamed El-Wakil et al. [4] presents the results of our survey of the major OOD quality models appeared in literature since the MOOSE model in 1994, till the QMOOD model in 2002, then it proposes a set of desirable properties that should be possessed by OOD quality models and a comparison among the presented models with respect to the proposed desirable properties set. This paper mainly discuss on comparison between the MOOD and QMOOD models. QMOOD distinguishes itself by providing mathematical formulas that links design quality attributes with design metrics. This allowed computing a Total Quality Index (TQI). We conclude that the QMOOD suite is the most complete, comprehensive, and supported suite.
T. Abd El-lateef et al. [6] proposes a framework to compute and evaluate metrics for object oriented design (MOOD). The proposed framework works on both the object code and source code of the software system. The framework is implemented to measure two other MOOD metrics. It merges the four metrics to calculate the proposed maintainability index (PMI). He concluded that The MOOD analysis frame work “MetricsFW” measures MOOD metrics from the object code. In the future “MetricsFW” can give the ability to measure the maintainability of the original object oriented design before the implementation.
Rachel Harrison et al.[5] describes the results of an investigation into a set of metrics for object-oriented design, called the MOOD metrics. The merits of each of the six MOOD metrics is discussed from a measurement theory viewpoint, taking into account the recognized object-oriented features which they were intended to measure: method hiding, inheritance, coupling, and polymorphism. This paper concludes that the metrics could be used to provide an overall assessment of a software system, which may be helpful to managers of software development projects.
2. Materials and methods
I) Mood metrics:
The MOOD metrics set was first proposed in 1994 by the MOOD project team, headed F. B. e Abreau [1]. The metrics are designed to meet a particular set of criteria, also proposed by the team. The criteria are listed here:
1. Non-size metrics should be system size independent.
2. Metrics should be dimensionless or expressed in some consistent unit system.
3. Metrics should be easily computable.
4. Metrics should be language independent.
I) Method hiding factor:
Fernando Brito [1] et.al is recommended that MHF should not be lower than a particular value but suggest that there is no upper limit, thus implying that it is 'good' for all methods in a classes to be hidden (private).
Equation (1) refers the Method Hiding Factor (MHF) represents the percentage of invisibilities of methods in a class. The MHF is computed by dividing the number of all visible methods in all classes by the number of all methods in the classes.
MHF =∑ ∑ ( ( ))
∑ ( ) (1)
Where V (Mmi) = Visibility value of a member (method or attribute), i.e. a value between 0-1 where public members = 1, private members = 0 and semi-public (e.g. protected) members are calculated as the number of classes that can access the member / total classes in the system.
If the value of MHF is high (100%), it means all methods are private which indicates very little functionality. Thus it is not possible to reuse methods with high MHF. MHF with low (0%) value indicate all methods are public that means most of the methods are unprotected.
II) Attribute hiding factor:
Equation (2) refers the Attribute Hiding Factor (AHF)[4,5,7]is the percentage of invisibilities of attributes in a class. The AHF is computed by dividing the number of visible attributes in a class diagram by the number of all attributes in a class.
AHF =∑ ∑∑ (( )( )) (2)
If the value of AHF is high (100%), it means all attributes are private which indicates very little functionality. Thus it is not possible to reuse attributes with high MHF. MHF with low (0%) value indicate all attributes are public that means most of the attributes are unprotected.
III) Method inheritance factor:
Equation (3) refers the Method Inheritance Factor (MIF) [4, 5, 6, 7] represents the percentage of effective inheritance of methods. The MIF is computed by dividing the number of all inherited methods in all classes by the sum of all methods available of all classes.
= ∑ ( )
∑ ( ) (3)
Here Ma (ci) =Number of methods available,
IV) Attribute inheritance factor:
Equation (4) refers theAttribute Inheritance Factor [4, 5, 7] (AIF) of a class represents the percentage of effective Inheritance of attributes. The AIF is computed by dividing the number of all inherited attribute in all classes by the sum of all attributes available (inherited and locally defined) of all classes.
= ∑ ( )
∑ ( ) (4)
Here Aa (ci) =Number of attributes available
Ai (ci) =Number of attributes available
V) Polymorphism factor:
Equation (5) refers the Polymorphism Factor (PF) [2,4,5] represents the actual number of possible different polymorphic situations With respect to the maximum number of possible distinct polymorphic situations. The PF is computed by dividing The total number of overridden methods in all classes by the result of multiplying the number of new methods times the number of descendants for all classes, respectively. The definition [2] of POF means that it can only be applied to complete hierarchies.
PF = ∑ ( )
∑ ∗ ( ) (5)
Here Mo(Ci)=Override methods
Mn(Ci)=New methods
DC(Ci)=Decendant counts
Taking this concept one step further, it is possible for an entire system to be built using an existing framework. This is especially likely in languages that are shipped with large class libraries, such as Java or Smalltalk. In such cases the whole system could produce POF>1.
VI) Coupling factor:
Equation (6) refers the Coupling Factor (CF) [2, 4, 5, 7] of a class represents the percentage of couplings among classes, not computable to inheritance, with respect to the maximum possible number of couplings in the class diagram. The CF is computed by dividing the number of associations, not related to
inheritance, between all classes by the number of classes squared minus the number of classes.
CF = ∑ ∑ _ ( , (6)
Here is_client(Ci,Cj)=1 if Ci contains at least one non inheritance reference to a method or attribute of a class
Cj=0 other wise
This metric is intended to count all client-supplier relationships in a system. It is not clear, however exactly what is meant by a 'non-inheritance reference'. The two main relationships in an OO system are 'is-a' and 'has-a' relationships. The former describes relationships based on inheritance and the latter describes client-supplier relationships, e.g. one class's use of another class as an instance variable.
II) Lorenz & Kidd metrics:
Lorenz and Kidd [4] introduced many metrics to quantify software quality assessment. Lorenz and Kidd metrics were accompanied by a justification for being considered as metrics. Lorenz and Kidd are applicable to class diagrams. A description of these metrics and the rationale behind them is given; they are classified into two metrics categories:
I) Class size metrics
,
which deal with quantifying an individual class:b. Number of Public Variables per class (NPV): This metric counts the number of public variables in a class. Lorenz and Kidd consider the number of variables in a class to be one measure of its size.
c. Number of Class Variables (NCV) d. Number of Class Methods (NCM)
II). Class Inheritance metrics
,
which look at the quality of the classes use of inheritance:
a. Number of Operations Overridden (NOO): A large number of overridden methods indicate a design problem, indicating that those methods were overridden as a design afterthought. It is suggested that a subclass should really be a specialization of its super classes, resulting in new unique names for methods.
b. Number of Operations added (NOA): The normal expectation for a subclass is that it will further specialize (or add) methods to the super class object. A method is defined as an added method in a subclass if there is no method of the same name in any of its super classes.
c. Specialization Index (SIX): Equation (7) indicates SIX. It refers the quality of the classes use of inheritance. The specialization index measures to what extent subclasses redefine the behavior of their super classes.
SI = NOO x Level / M total (7)
Where level is the class hierarchy at which the class resides and M total is the total number of methods for class.
3. Results and Discussion
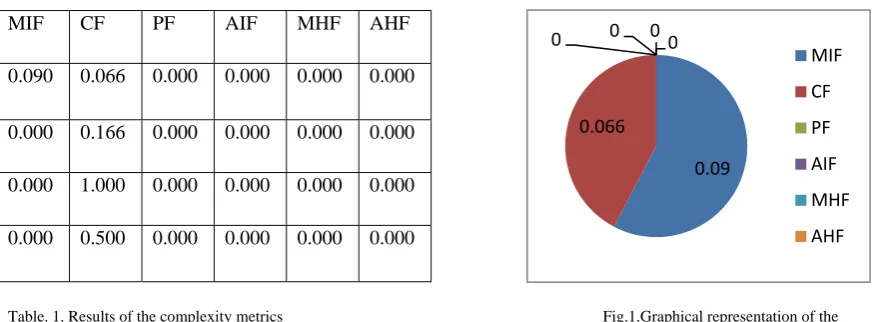
Table. 1. Results of the complexity metrics Fig.1.Graphical representation of the
Complexity metrics
All method values are considered between 0-1 scale. By using above table (1), Fig (1) and references we can estimate those factors that are:
The Attribute Hiding Factor (AHF) metric for all of systems has its maximum value of 100 percent, indicating that all the attributes were declared as private. The values for the AHF vary between 44 to 68 percent, indicating that of 50 percent would suggest an even balance between the public and private data attributes.
Method Hiding Factor (MHF) has relatively low values, indicating a lack of information hiding. The values for the Method Hiding Factor (MHF) vary between 8 to 25 percent. These low values, indicate a low degree of information hiding, possibly suggesting a lack of abstraction at the design stage.
The Attribute Inheritance Factor (AIF) varies between 11 to 47 percent. These are also rather low, suggesting only a moderate use of inheritance. Mean values of 56.2 and 73.5 percent for AIF and MIF, respectively are cited by Abreu [2]. Low values for the inheritance factors support this lack of utilization of inheritance.
The Coupling Factor (CF) metric ranges from 3 to 6 percent, suggesting little interclass coupling. Abreu et al. [1] suggests that CF should be neither too low, nor too high [4]. Low coupling reduces potentially harmful side-effects such as unnecessary dependencies and limited reuse. However, a very low value of CF (0 percent) indicates that a system has no interclass coupling, which might point to a system in which classes only communicate via inheritance, On the other hand, a CF of 100 percent may also indicate problematic design architecture, excessive coupling implies that software will be difficult to maintain, evolve, and reuse.
0.09 0.066
0 0 0 0
MIF
CF
PF
AIF
MHF
AHF
MIF CF PF AIF MHF AHF
0.090 0.066 0.000 0.000 0.000 0.000
0.000 0.166 0.000 0.000 0.000 0.000
0.000 1.000 0.000 0.000 0.000 0.000
The Polymorphism Factor (PF) metric range from 3 to 9 percent; these low values are indicating moderate use of inheritance. If PF range is 100 percent indicating highly use of inheritance. If PF range is zero, indicating no method or function is extended from existing class and function. Number operations overridden (NOO), a large number of overridden methods indicates a design problem. Specialization index, Specialization index is greater than 5 is generally considered suspect and might warrant further investigation.
4. Conclusion
In this paper, work has been done to explore the quality of design of software components using object oriented paradigm. A number of object oriented metrics have been proposed in the literature for measuring the design attributes such as inheritance, coupling, polymorphism etc. This paper, metrics have been used to analyze various features of software component. Complexity of methods involved is a predictor of how much time, effort, cost is required to develop and maintain the class. If a large number of methods can be invoked in response to a message, the testing and debugging of the class becomes more complicated since it requires a greater level of understanding on the part of the tester.
This paper mainly focuses to evaluate the efficiency of the implemented code, efficiency of the design, and quality of the code productively of a programmer. Management also asses the cost of the application, Effort of the application, Calendar time of the system. This metric set can be applied on various projects and evaluate and compare the performance of the code using object oriented paradigm. Finally these metrics are very help full for determining characteristic of any complexity application.
5. References
[1] Fernando Brito e Abreu, Rogério Carapuça “Object-Oriented Software Engineering: Measuring and Controlling the Development
Process”. proc 4th Int. Conf. On Software Quality, McLean, VA, USA, Oct. 1994
[2] Fernando Brito e Abreu ,Miguel Goulão, Rita Esteves ,1995,”Toward the Design Quality Evaluation of Object-Oriented Software
Systems” 5th International Conference on Software Quality, Austin, Texas, 23 to 26 October 1995.
[3] Lalji Prasad, Aditi Nagar” Experimental analysis of different metrics(Object-Oriented and Structural) of software”. 2009 First
International Conference on Computational Intelligence, Communication Systems and Networks.
[4] Mohamed El-Wakil, Ali Fahmy “Object–Oriented Design Quality Models: A Survey and Comparison” IEEE Transactions on SE.
[5] R. Harrison, Member, S. J. Counsell and R.V. Nithni “An Evaluation of the MOOD Set of Object-Oriented Software Metrics”. IEEE
Trans. Software engineering, vol.SE-24,no.6, pp.491-496 June 1998
[6] T. Abd El-lateef, A. H. Yousef, and M.F. Ismail “Object Oriented Design Metrics Framework based on Code Extraction”
.International conferences on Computer Engineering & Systems, 2008. ICCES 2008.
[7] Tobias Mayer & Tracy Hall “Measuring OO Systems: A Critical Analysis of the MOOD Metrics”. Centre for Systems and Software