Research Article
Vol: 1; Issue: 2DEVELOPMENT AND VALIDATION OF HPLC METHOD
FOR THE SIMULTANEOUS ESTIMATION OF
CHLORTHALIDON AND METOPROLOL SUCCINATE IN
BULK AND DOSAGE FORM
Raval Kashyap*1, U Srinivasa2
1
Research Scholar, Department of Pharmacy, Pacific University, Udaipur
2
Head of the Department, Srinivas College of Pharmacy, Mangalore
Date Received: 26th Nov 2013
Date of Accepted: 6th Dec 2013
Date Published: 10-Dec-2013
Available Online on: www.ijpda.com Page 1
Abstract:
A simple, accurate and precise High Performance Liquid Chromatographic (HPLC) method has been developed for simultaneous determination of Chlorthalidon and Metoprolol Succinate in bulk and dosage form. The method has been validated as per the guidelines of ICH. The separation is achieved on 250*4.6mm C18, 5micron (Hypersil BDS) column with flow rate 1.0 mL per minute in isocratic mode using Buffer pH 4.5: Methanol : acetonitrile (50:25:25) as mobile phase. Column oven temperature is maintained at 25°C and observations are recorded at 223 nm. The linearity range was found to be in the range of 5-15 µg/ml for Chlorthalidon and 20-60 µg/ml for Metoprolol Succinate. Correlation co-efficient for calibration curve of Chlorthalidon and Metoprolol Succinate was found to be 0.998 and 0.999 respectively. The method is simple, accurate, reproducible and short and can be used for simultaneous analysis of Chlorthalidon and Metoprolol Succinate.
Keywords:Chlorthalidon, Metoprolol Succinate, Buffer pH 4.5, Methanol and Acetonitrile.
Introduction
A study of the interaction of light (or other electromagnetic radiation) with matter is an important and versatile tool for the chemist. Indeed, much of our knowledge of chemical substances comes from their specific absorption or emission of light. In this experiment, we are interested in analytical procedures based on the amount of light absorbed (or transmitted) as it passes through a sample.1 Vinicor-D is available in 25mg and 50mg. Vinicor-D contains Metoprolol succinate and Chlorthalidone. Chlorthalidone is an antihypertensive /diuretic
tablets for oral use. It is a monosulfamyl diuretic that differs chemically from thiazide diuretics in that a double ring system is incorporated in its structure. Its IUPAC nname is 2-chloro-5-(1-hydroxy-3-oxo-1-isoindolinyl) benzene sulfonamide. Its Molecular formula and Molecular weight are C14H11ClN2O4S and
Page 2 of 14 continues for up to 72 hours. The drug produces
diuresis with increased excretion of sodium and chloride. The diuretic effects of Chlorthalidone and the Benzothiadiazine (thiazide) diuretics appear to arise from similar mechanisms and the maximal effect of Chlorthalidone and the thiazides appear to be similar. The site of the action appears to be the distal convoluted tubule of the nephron. The diuretic effects of Chlorthalidone lead to decreased extracellular fluid volume, plasma volume, cardiac output, total exchangeable sodium, glomerular filtration rate, and renal plasma flow.
Metoprolol succinate is a beta1-selective (cardio selective) adrenoceptor blocking agent, for oral administration, available as extended-release tablets. 2 TOPROL-XL has been formulated to provide a controlled and predictable release of Metoprolol for once-daily administration. The tablets comprise a multiple unit system containing Metoprolol succinate in a multitude of controlled release pellets. Each pellet acts as a separate drug delivery unit and is designed to deliver Metoprolol continuously over the dosage interval. Its chemical name is (±) 1(isopropyl amino)-3-[p-(2-methoxyethyl) phenoxy]-2-propanol succinate (2:1) (salt). Its Molecular formula- and molecular weight are (C15H25NO3)2 • C4H6O4 and 652.8 respectively. Metoprolol succinate is a white crystalline powder. It is freely soluble in water, soluble in methanol, sparingly soluble in ethanol, slightly soluble in dichloromethane and 2-propanol, practically insoluble in ethyl-acetate, acetone, diethyl ether and heptane. It is indicated for the treatment ofhypertension, to lower blood pressure. Lowering blood pressure lowers the risk of fatal and non-fatal cardiovascular events, primarily strokes and myocardial infarctions. These benefits have been seen in controlled trials of antihypertensive drugs from a wide variety of pharmacologic classes including Metoprolol.3
There are spectroscopic and Chromatographic methods developed on single Metoprolol Succinate and Chlorthalidon 4-25. But up to now there is no HPLC methods develop for simultaneous estimation Chlorthalidon and Metoprolol Succinate Analysis of the drug is important for development of drugs in their formulation and their use in therapies, for which we require standard analytical procedures. The USP has published specific guidelines for method
validation for compound evaluation. USP defines eight steps for validation: Accuracy, Precision, Specificity, Limit of detection, Limit of quantitation , Linearity and range, Robustness26-27 As quality control process is not static some form of validation/verification should continue till the validated procedure is in use. It should not be a concept that once the method is initially developed and validated it is forgotten.
Materials and methods:
Chromatographic methods offer an advantage in terms of sensitivity and selectivity. These methods can be used for routine analysis of dosage forms where two or more drugs are present together. HPLC method was developed for simultaneous estimation of Chlorthalidon and Metoprolol Succinate.
Reagents and Material
Metoprolol Succinate and Chlorthalidone were from Shreeji pharma International, Vadodara. Acetonitrile for HPLC, Methanol, Water for HPLC, Potassium Dihydrogen ortho phosphate AR grade,
Marketed formulation
The commercial formulation was purchased from Local pharmacy. Each Vinicor-D Tablet contains 12.5mg Chlorthalidon and 50mg Metoprolol Succinate.
Selection of Mobile Phase
After assessing the solubility of drugs in different solvents as well on the basis of literature survey, the standard solution of Chlorthalidon and Metoprolol Succinate were injected into the HPLC system by using different solvent systems. Different mobile phases were tried in order to find the best conditions for the separation of both the drugs. It was found that Buffer pH 4.5: Methanol: Acetonitrile give satisfactory results as compared to other mobile phases. Finally, the optimal composition of the mobile phase was determined to be Buffer pH 4.5: Methanol: Acetonitrile (50:25:25) which show in table no.1
Selection of Detection Wavelength
Raval Kashyap
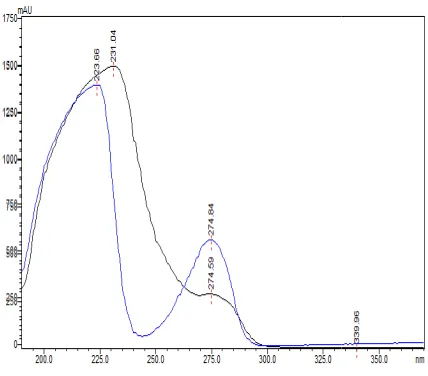
upon proper selection of detection wavelength. An ideal wavelength is the one that gives good response for the drugs that are to be detected. In the present study standard drug solutions of 5µg/ml Chlorthalidon and 20 µg/ml Metoprolol Succinate were, therefore, prepared in solvent mixtures of mixture of Buffer pH 4.5: Methanol : acetonitrile ( 50:25:25). This drug solution was than scanned in the UV region of 200-400 nm and the spec
recorded 223nm which is shown in figure no. 1
Figure 1: Detection of wavelength 223nm
Optimized Chromatographic Conditions
The HPLC used for the method was LC 100 UV DETECTOR and software used for the data extracted was WS 100 WORKSTATION SOFTWARE. To optimize the chromatographic conditions, the effect of chromatographic variables such as mobile phase pH, flow rate, and solven ratio were studied. The resulting chromatograms were recorded and the chromatographic parameters such as capacity factor, asymmetric factor and column efficiency were calculated. The conditions that gave the best resolution, symmetry and capacity factor were selected for estimation show in table no.1 and figure 2.
Buffer preparation (0.05M KH2PO4 pH4.5), Mobile phase: Buffer pH 4.5: Methanol: acetonitrile (50:25:25), Flow rate: 1.0 mL/min, Wavelength: 223nm, Column: 250*4.6mm C18, 5micron
Raval Kashyap et al; Vol: 1, Issue: 2, Page: 1 – 14
upon proper selection of detection wavelength. An ideal wavelength is the one that gives good response for the drugs that are to be detected. In the present utions of 5µg/ml Metoprolol Succinate were, therefore, prepared in solvent mixtures of mixture of Buffer pH 4.5: Methanol : acetonitrile ( 50:25:25). This drug solution was than scanned in 400 nm and the spectrum was recorded 223nm which is shown in figure no. 1
Detection of wavelength 223nm
Optimized Chromatographic Conditions
The HPLC used for the method was LC 100 UV DETECTOR and software used for the data extracted was WS 100 WORKSTATION SOFTWARE. To optimize the chromatographic conditions, the effect of chromatographic variables such as mobile phase pH, flow rate, and solvent ratio were studied. The resulting chromatograms were recorded and the chromatographic parameters such as capacity factor, asymmetric factor and column efficiency were calculated. The conditions that gave the best resolution, symmetry and capacity were selected for estimation show in table
pH4.5), Mobile phase: Buffer pH 4.5: Methanol: acetonitrile (50:25:25), Flow rate: 1.0 mL/min, Wavelength: 223nm, Column: 250*4.6mm C18, 5micron
(Hypersil BDS) and Injection volume: 20 micro liter.
Preparation of standard solutions
Preparation of buffer pH 4.5
Buffer preparation (0.05M Kh2po4 pH4.5):
6.8gm potassium dihydrogen phosphate was taken into a 1000ml beaker, added 800ml water and dissolved. Adjusted pH4.5 with 1% orthophosphoric acid. It was Made up volume with water upto 1000ml.
Preparation of mobile phase
500 ml of Buffer (pH 4.5), 250ml Methanol and 250 ml of Acetonitrile (HPLC grade) were mixed and filtered through 0.45µm filter, Sonicated for 10minutes to degas and used as mobile phase. Use mobile phase as a diluents.
Preparation of STD Stock solution of Chlorthalidon:
Stock solution of Chlorthalidon: 10mg of Chlorthalidon was taken as working standard into a 100ml volumetric flask. Added 60ml mobile phase and dissolve, make up volume with mobile phase (100 µg/ml)
Preparation of STD Stock solution of Metoprolol Succinate:
Stock solution of Metoprolol Succinate
Metoprolol Succinate was taken as working standard into a 100ml volumetric flask. Add 60ml mobile phase and dissolve, make up volume with mobile phase (400 µg/ml)
Calibration curve for Chlorthalidon and 20-60 Succinate
Appropriate volume of aliquots from standard Chlorthalidon and Metoprolol Succinate
solutions were transferred to same volumetric flasks of 10 ml capacity. The volume was adjusted to the mark with mobile phase give a solution containing 5, 7.5, 10, 12.5 and 15
Chlorthalidon and 20, 30, 40, 50, 60 Metoprolol Succinate. E
standard solutions was chromatographed for 10 minutes run time using mobile phase at 223nm at flow rate of 1 ml/min. The graphs were plotted for
Page 3 of 14 (Hypersil BDS) and Injection volume: 20 micro
Preparation of standard solutions
Preparation of buffer pH 4.5
reparation (0.05M Kh2po4 pH4.5):
6.8gm potassium dihydrogen phosphate was taken into a 1000ml beaker, added 800ml water and dissolved. Adjusted pH4.5 with 1% orthophosphoric acid. It was Made up volume with
Preparation of mobile phase
500 ml of Buffer (pH 4.5), 250ml Methanol and 250 ml of Acetonitrile (HPLC grade) were mixed and filtered through 0.45µm filter, Sonicated for 10minutes to degas and used as mobile phase. Use
Preparation of STD Stock solution of
Stock solution of Chlorthalidon: 10mg of Chlorthalidon was taken as working standard into a 100ml volumetric flask. Added 60ml mobile phase and dissolve, make up volume with mobile phase
Preparation of STD Stock solution of
Metoprolol Succinate: 40mg of was taken as working standard into a 100ml volumetric flask. Add 60ml mobile phase and dissolve, make up volume with
Calibration curve for the 5-15 µg/ml 60 µg/ml Metoprolol
Page 4 of 14 peak area vs. concentration for both the drugs. Data
is recorded in table no. 2 and figure no. 3, 4 and 5.
Analysis of marketed formulation:
Solution-1: Sample was taken equivalent to 10mg of Chlorthalidon (10ml sample) into a 100ml volumetric flask. Added 60ml of mobile phase and shaked for 15 minutes to dissolve. Made up with mobile phase. Filtered this solution with 0.45micron membrane filter (This solution contains 100 µg/ml of Chlorthalidon and 400 µg/ml of Metoprolol Succinate)
Solution-2: 1ml of solution-1 was taken into a 10ml volumetric flask and make up with mobile phase. (This solution contains 10 µg/ml of Chlorthalidon and 40 µg/ml of Metoprolol Succinate)
The prepared sample solution was chromatographed for 10 minutes run time using mobile phase at 223nm at flow rate of 1 ml/min. From the peak area obtained in the chromatogram, the amounts of both the drugs were calculated by fitting peak area responses into the equation of the straight line representing the calibration curves for Chlorthalidon and Metoprolol Succinate. And result shown in table no 3 and figure no. 6.
Validation of proposed HPLC method
6. System suitability
System suitability testing is an integral part of many analytical procedures. The tests are based on the concept that the equipment, electronics, analytical operations and samples to be analyzed constitute an integral system that can be evaluated as such. System suitability test parameters to be established for a particular procedure depend on the type of procedure being validated. System suitability test was carried out to verify that the analytical system is working properly to give accurate and precise results. Standard solution (5µg/ml Chlorthalidon and 20µg/ml Metoprolol Succinate) was injected six times and the chromatograms were recorded in table no. 4 and figure no. 7.
Acceptance Criteria
The % RSD for area response obtained from six replicate injections of Standard solution should be ≤ 2.0 %, Tailing factor should be ≤ 2.0, Theoretical
should be ≥ 2000 27 and Resolution should be ≥ 2.0 in Standard solution.
Solvent suitability:
Recorded in table no.5
Linearity
The linearity of analytical method is its ability to elicit test results that are directly proportional to the concentration of analyte in sample within a given range. The range of analytical method is the interval between the upper and lower levels of analyte that have been demonstrated to be determined within a suitable level of precision, accuracy and linearity.
The linearity peak area response was determined by analyzing solutions having concentrations in the range of 5-15 µg/ml and 20-60 µg/ml for Chlorthalidon and Metoprolol Succinate respectively from same solution. Peak area of each solution was measured using developed method. Calibration curve of peak area Vs concentration was plotted. The correlation coefficient and regression line equations for Chlorthalidon and Metoprolol Succinate were determined. Linearity is recorded in table no.6.
Precision
Repeatability
6 replicates of standard mixture solution having and Chlorthalidon (5 µg/ml) and Metoprolol Succinate (20µg/ml) were prepared and chromatograms were recorded and RSD was calculated and shown in table no. 7.
Intraday precision
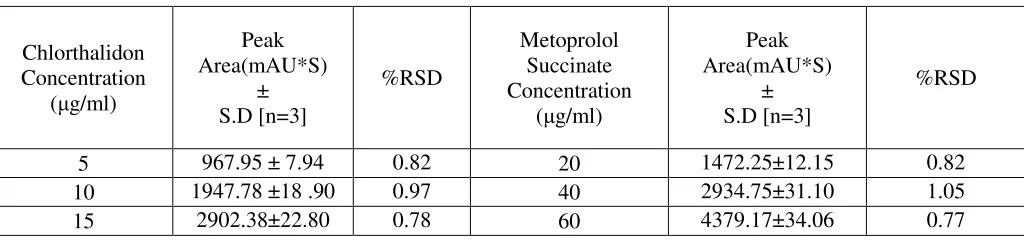
Standard solutions containing 5, 10, 15 µg/ml Chlorthalidon and 20, 40, 60 µg/ml Metoprolol Succinate were analyzed 3 times on the same day. Chromatogram of each sample was recorded. SD and RSD were calculated and shown in table no. 8.
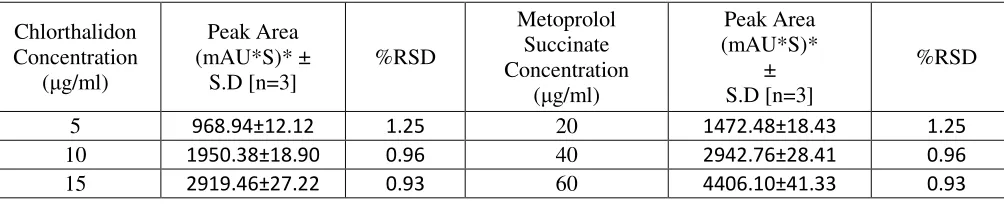
Interday precision
Raval Kashyap et al; Vol: 1, Issue: 2, Page: 1 – 14
Page 5 of 14 Accuracy
Accuracy is the closeness of the test results obtained by the method to the true value. Recovery studies were carried out by addition of standard drug to the pre analysed sample at 3 different concentration levels (80, 100 and 120 %) taking into consideration percentage purity of added bulk drug samples. It was determined by calculating the recovery Chlorthalidon and Metoprolol Succinate by standard addition method.
Preparation of sample solution for % recovery:
An accurately weighed powder equivalent to about 10 mg of Chlorthalidon and 4mg of Metoprolol Succinate was transferred to 100 ml volumetric flask; dissolved and the volume was made up to the mark using mobile phase. The solution was sonicated for 20 minutes. The solution was filtered through whatman Filter Paper No.42. First few ml of filtrate were discarded. 1 ml of the solution from above filtrate was diluted to 10 ml with mobile phase. The prepared sample solution was chromatographed for 10 minutes using mobile phase at flow rate of 1 ml/min. concentration of Chlorthalidon and Metoprolol Succinate is calculated which is known as pre-analyzed sample. In pre-analyzed sample 80, 100 and 120% of Chlorthalidon and Metoprolol Succinate was spiked. Chromatogram of each spiked solutions was taken and total amount of drug was calculated and from which % recovery was calculated. This is shown in table no. 10 and 11.
Limit of Detection (LOD)
The LOD is estimated from the set of 6 calibration curves used to determine method linearity. The LOD may be calculated as;
LOD = 3.3 x (SD / Slope)
Where, SD = the standard deviation of Y- intercept of 6 calibration curves.
Slope = the mean slope of the 6 calibration curves.
This is shown in table no. 12.
Limit of Quantification (LOQ)
The LOQ is estimated from the set of 6 calibration curves used to determine method linearity. The LOQ may be calculated as;
LOQ = 10 x (SD / Slope)
Where, SD = the standard deviation of Y- intercept of 6 calibration curves.
Slope = the mean slope of the 6 calibration curves.
This is shown in table no. 12.
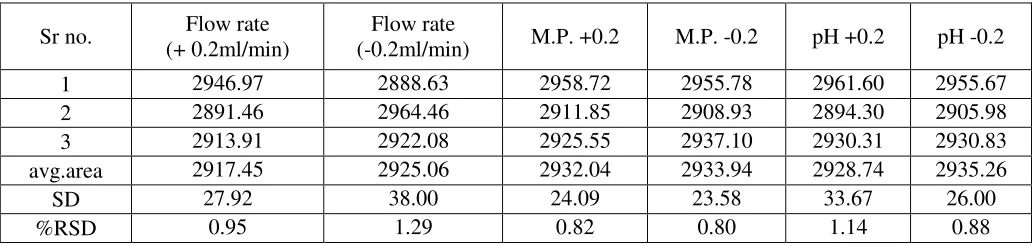
Robustness
The robustness of an analytical method was carried out to confirm that the method remained unaffected by small but deliberate variations in method parameters and provides an indication of its reliability during normal usage. The standard solution was injected five times for each varied conditions of flow, column temperature, pH, and mobile phase ratio and chromatograms were recorded in table no. 13 & 14. Change in Conditions for Robustness like Change in flow rate, M.P. and pH.
RESULT AND DISCUSSION:
High Performance Liquid Chromatographic (HPLC) method has been developed for simultaneous determination of Chlorthalidon and Metoprolol Succinate in bulk and dosage form. The linearity range was found to be in the range of 5-15 µg/ml for Chlorthalidon and 20-60 µg/ml for Metoprolol Succinate with using mobile phase Buffer pH 4.5: Methanol : acetonitrile ( 50:25:25).Correlation co-efficient for calibration curve Chlorthalidon and Metoprolol Succinate was found to be 0.998 and 0.999 respectively. The method is simple, accurate, reproducible and short and can be used for simultaneous analysis of Chlorthalidon and Metoprolol Succinate
Optimization of Mobile phase
Page 6 of 14
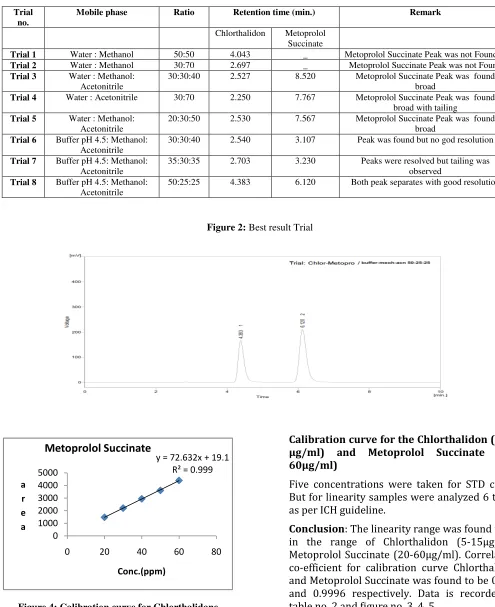
Table 1: Mobile Phase trial for Sample analysis
Trial no.
Mobile phase Ratio Retention time (min.) Remark
Chlorthalidon Metoprolol Succinate
Trial 1 Water : Methanol 50:50 4.043 _ Metoprolol Succinate Peak was not Found Trial 2 Water : Methanol 30:70 2.697 _ Metoprolol Succinate Peak was not Found Trial 3 Water : Methanol:
Acetonitrile
30:30:40 2.527 8.520 Metoprolol Succinate Peak was found
broad
Trial 4 Water : Acetonitrile 30:70 2.250 7.767 Metoprolol Succinate Peak was found broad with tailing
Trial 5 Water : Methanol: Acetonitrile
20:30:50 2.530 7.567 Metoprolol Succinate Peak was found
broad Trial 6 Buffer pH 4.5: Methanol:
Acetonitrile
30:30:40 2.540 3.107 Peak was found but no god resolution
Trial 7 Buffer pH 4.5: Methanol: Acetonitrile
35:30:35 2.703 3.230 Peaks were resolved but tailing was
observed Trial 8 Buffer pH 4.5: Methanol:
Acetonitrile
50:25:25 4.383 6.120 Both peak separates with good resolution
Figure 2: Best result Trial
Figure 4: Calibration curve for Chlorthalidone
Calibration curve for the Chlorthalidon (5-15 μg/ml) and Metoprolol Succinate (20-60μg/ml)
Five concentrations were taken for STD curve. But for linearity samples were analyzed 6 times as per ICH guideline.
Conclusion: The linearity range was found to be
in the range of Chlorthalidon (5-15μg/ml). Metoprolol Succinate (20-60μg/ml). Correlation co-efficient for calibration curve Chlorthalidon and Metoprolol Succinate was found to be 0.998 and 0.9996 respectively. Data is recorded in table no. 2 and figure no. 3, 4, 5.
y = 72.632x + 19.1 R² = 0.999
0 1000 2000 3000 4000 5000
0 20 40 60 80
a r e a
Conc.(ppm)
Raval Kashyap et al; Vol: 1, Issue: 2, Page: 1 – 14
Page 7 of 14
Fig-5: Linear calibration curve of Metoprolol
Analysis of marketed formulation:
Result shown in table no 3 and figure no. 6.
Table 3: Analysis of marketed formulation
Vinicor-D
Drugs
Label Claim (mg)
Amount Found(mg)
% Recovery
Chlorthalidon 12.5mg
12.613 100.90
Metoprolol
Succinate 50mg
50.193
100.38
System suitability:
Conclusion: The column efficiency was more than 2000 theoretical plates and the tailing factor was less than 2.0 for Chlorthalidon and Metoprolol Succinate drugs. Resolution is 5.196. The study concludes the suitability of the HPLC system being use. And data was recorded in table no.4 and figure no.7
Figure 3: STD curve linearity
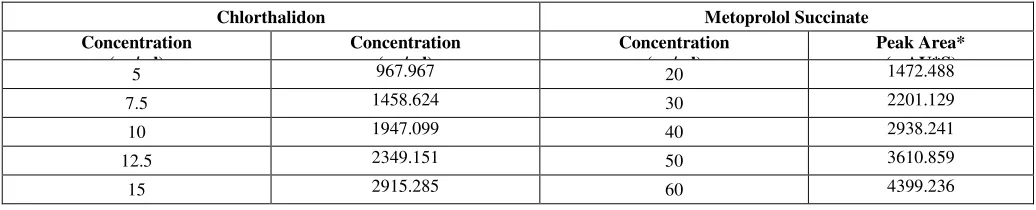
Table 2: STD curve data for Chlorthalidon and Metoprolol Succinate
Chlorthalidon Metoprolol Succinate
Concentration (µg/ml)
Concentration (µg/ml)
Concentration (µg/ml)
Peak Area* (mAU*S)
5 967.967 20 1472.488
7.5 1458.624 30 2201.129
10 1947.099 40 2938.241
12.5 2349.151 50 3610.859
15 2915.285 60 4399.236
y = 191.4x + 13.56 R² = 0.998
0 500 1000 1500 2000 2500 3000 3500
0 5 10 15 20
a r e a
Conc.(ppm)
Page 8 of 14 Figure 6: Chromatogram of marketed formulation
Table 4: System suitability data for Chlorthalidon and Metoprolol Succinate
Sr No. Standard Response (mAU*S)
Chlorthalidon (5 µg/ml) Metoprolol Succinate (20µg/ml) Average ± SD 971.23 ± 9.31 1471.33±6.49
%RSD 0.9588 0.4412
Retention Time 4.390 6.127
Theoretical plates 3295 4569
Tailing Factor 1.57 1.50
Resolution 5.196
Raval Kashyap et al; Vol: 1, Issue: 2, Page: 1 – 14
Page 9 of 14 Solvent suitability:
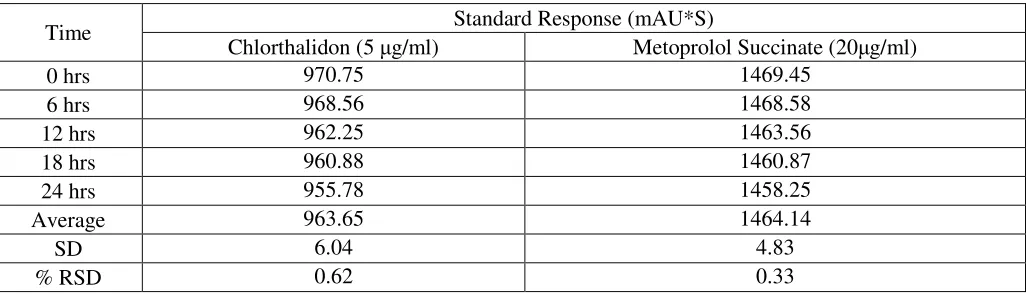
Conclusion: The % RSD of response for both drugs was found to be less than 2. So, it was concluded that proposed mobile phase Buffer pH 4.5: Methanol: acetonitrile (50:25:25) is suitable for estimation of Chlorthalidon and Metoprolol Succinate in combined dosage form and shown in table no 5.
VALIDATION
Linearity: 6 times chromatogram were taken for all five concentration and data were recorded table no.6
Precision
Repeatability:
Discussion: The % RSD for Repeatability of both the drugs was found to be less than 2. So, it was concluded that proposed method for estimation of Chlorthalidon and Metoprolol Succinate is précised in nature and shown in table no.7.
Intraday precision:
Discussion: The % RSD for Repeatability of both the drugs was found to be less than 2. So, it was concluded that proposed method for estimation of Chlorthalidon and Metoprolol Succinate is précised in nature and shown in table no.8.
Interday precision:
Discussion: The % RSD for Repeatability of both the drugs was found to be less than 2 so, it was
concluded that proposed method for estimation of Chlorthalidon and Metoprolol Succinate is précised in nature and shown in table no.9.
Accuracy:
Discussion: Result obtained reveals that % recovery of Chlorthalidon and Metoprolol Succinate was within acceptance criteria given in ICH guideline. And data for Accuracy Chlorthalidon and Metoprolol Succinate were recorded in table no. 10 and 11.
LOD and LOQ:
Discussion: The proposed method can detect Chlorthalidon and Metoprolol Succinate at very low level .So, it was concluded that the proposed method is very sensitive in nature which shown in table no. 12.
Robustness:
Discussion: The %RSD in both cases is less than 2.0. The study proves the reliability of test method for minor changes in chromatographic condition and which shown in table no. 13 and 14.
ACKNOWLEDGEMENT:
The author wishes to thanks mates who helped me lot for my work. And how can I forget U.Srinivas, my guide who suggests me in all way.
Table 5: Solvent suitability
Time Standard Response (mAU*S)
Chlorthalidon (5 µg/ml) Metoprolol Succinate (20µg/ml)
0 hrs 970.75 1469.45
6 hrs 968.56 1468.58
12 hrs 962.25 1463.56
18 hrs 960.88 1460.87
24 hrs 955.78 1458.25
Average 963.65 1464.14
SD 6.04 4.83
Page 10 of 14 Table 6: Linearity data for Chlorthalidon and Metoprolol Succinate
Chlorthalidon Metoprolol Succinate
Concentration (µg/ml)
Mean Peak Area [n=6] (mAU*S) ± SD
Concentration (µg/ml)
Mean Peak Area[n=6] (mAU*S) ± SD
5 964.99 ± 11.05 20 1467.10 ± 8.31
7.5 1460.70± 7.86 30 2202.26± 6.19
10 1951.68± 8.97 40 2941.87± 9.82
12.5 2349.70± 6.94 50 3614.77 ± 9.81
15 2916.48 ± 5.08 60 4394.30 ± 6.50
Table 7: Repeatability data for Chlorthalidon and Metoprolol Succinate
Chlorthalidon Metoprolol Succinate
Concentration ( µg/ml)
Peak Area (mAU*S)
Concentration (µg/ml)
Peak Area (mAU*S)
10 1947.09 40 2938.24
10 1950.12 40 2940.53
10 1966.69 40 2930.87
10 1950.84 40 2951.36
10 1960.47 40 2944.65
10 1938.74 40 2930.89
Mean 1952.32 Mean 2939.42
SD 9.91 SD 7.98
%RSD 0.50 %RSD 0.27
Table 8: Intraday precision data for estimation of Chlorthalidon and Metoprolol Succinate
Chlorthalidon Concentration
(µg/ml)
Peak Area(mAU*S)
± S.D [n=3]
%RSD
Metoprolol Succinate Concentration
(µg/ml)
Peak Area(mAU*S)
± S.D [n=3]
%RSD
5 967.95 ± 7.94 0.82 20 1472.25±12.15 0.82
10 1947.78 ±18 .90 0.97 40 2934.75±31.10 1.05
Raval Kashyap et al; Vol: 1, Issue: 2, Page: 1 – 14
Page 11 of 14 Table 9: Interday precision data for estimation of Chlorthalidon and Metoprolol Succinate
Chlorthalidon Concentration
(µg/ml)
Peak Area (mAU*S)* ±
S.D [n=3]
%RSD
Metoprolol Succinate Concentration
(µg/ml)
Peak Area (mAU*S)*
± S.D [n=3]
%RSD
5 968.94±12.12 1.25 20 1472.48±18.43 1.25
10 1950.38±18.90 0.96 40 2942.76±28.41 0.96
15 2919.46±27.22 0.93 60 4406.10±41.33 0.93
Table 10: Accuracy for Chlorthalidon
Sample amount
amount added
amount recovered
% recovery AVG SD %RSD
80% 10 8 7.93 99.22
99.69 0.49 0.49
80% 10 8 8.01 100.20
80% 10 8 7.97 99.66
100% 10 10 9.89 98.90
99.89 1.02 1.02
100% 10 10 10.09 100.93
100% 10 10 9.985 99.85
120% 10 12 11.88 99.07
99.75 0.90 0.90
120% 10 12 12.09 100.77
Page 12 of 14 Table 11: Accuracy for Metoprolol Succinate
Sample amount
amount added
amount recovered
% recovery AVG SD %RSD
80% 40 32 33.83 105.74
105.70 1.074 1.01
80% 40 32 34.16 106.75
80% 40 32 33.47 104.60
100% 40 40 42.13 105.33
105.41 0.95 0.90
100% 40 40 41.80 104.50
100% 40 40 42.56 106.40
120% 40 48 51.29 106.86
106.73 0.53 0.50
120% 40 48 50.95 106.14
120% 40 48 51.45 107.19
Table 12: LOD & LOQ data for Chlorthalidon and Metoprolol Succinate
Parameters Chlorthalidon Metoprolol Succinate
Mean Slope (n=6) 191.67 92.41
SD (n=6) 12.97 11.11
LOD (μg/ml) 0.22 0.39
LOQ (μg/ml) 0.67 1.20
Table 13: Robustness for Chlorthalidon (10µg/ml)
Sr no. Flow rate (+0.2 ml/min)
Flow rate
(- 0.2ml/min) M.P. +0.2 M.P. -0.2 pH +0.2 pH -0.2 1 1952.95 1914.28 1960.73 1958.78 1962.70 1958.77 2 1916.14 1964.57 1929.62 1927.68 1918.04 1925.81 3 1931.62 1939.371 1939.34 1947.12 1935.48 1947.12
avg.area 1933.57 1939.41 1943.23 1944.53 1938.74 1943.89
SD 18.48 25.14 15.91 15.71 22.50 16.71
%RSD 0.95 1.29 0.81 0.80 1.16 0.85
Table 14: Robustness for Metoprolol Succinate (40µg/ml)
Sr no. Flow rate (+ 0.2ml/min)
Flow rate
(-0.2ml/min) M.P. +0.2 M.P. -0.2 pH +0.2 pH -0.2
1 2946.97 2888.63 2958.72 2955.78 2961.60 2955.67 2 2891.46 2964.46 2911.85 2908.93 2894.30 2905.98 3 2913.91 2922.08 2925.55 2937.10 2930.31 2930.83 avg.area 2917.45 2925.06 2932.04 2933.94 2928.74 2935.26
SD 27.92 38.00 24.09 23.58 33.67 26.00
Raval Kashyap et al; Vol: 1, Issue: 2, Page: 1 – 14
Page 13 of 14
References:
1. Chemistry 111 Lab: Intro to Spectrophotometry. Spectrophotometry 2005: E1-8
2. Metoprolol-Succinate: http://dailymed.nlm.nih.gov/dailymed/drugInfo. cfm?id=16753#nlm34089-3 3. Chlorthalidone: http://dailymed.nlm.nih.gov/dailymed/drugInfo. cfm?id=49283
4. Vaijanath GD, Sweta BS, et al, Simultaneous determination of Metoprolol succinate and Amlodipine besylate in pharmaceutical dosage form by HPLC, Journal of Pharmaceutical and Biomedical Analysis, 2008, 46(3),583–586. 5. Alaa El-Gindy, Samy E, Ahmed M, HPLC and
chemometric-assisted spectrophotometric methods for simultaneous determination of Atenolol, Amiloride Hydrochloride and Chlorthalidone, II Farmaco, 2005, 60(3),269– 278.
6. Singh B, Patel DK and Ghosh SK, Development of Reverse-Phase HPLC Method for Simultaneous Analysis of Metoprolol Succinate and Hydrochlorothiazide in a Tablet Formulation, Tropical Journal of Pharmaceutical Research, 2009, 8(6),539-543. 7. Jain PS, Patel MK, Bari SB, and Surana SJ,
Development and Validation of HPTLC Method for Simultaneous Determination of Amlodipine Besylate and Metoprolol Succinate in Bulk and Tablets, Indian J Pharm Sci, 2012,74(2): 152– 156.
8. El- Gindy A, Sallam, S and Abdel SR. A, HPLC method for the simultaneous determination of Atenolol and Chlorthalidone in human breast milk, J. Sep. Science, 2008, 31(4), 677–682. 9. Brijesh S, Patel DK and Ghosh SK, A
reversed-phase high performance liquid chromatographic Method for determination of Chlorthalidone in Pharmaceutical formulation, International journal of pharmacy and pharmaceutical sciences, 2009, 1(2), 24-9.
10. Akiful HM, Nivedita G, et al, Simultaneous Estimation of Atenolol and Chlorthalidone as Bulk and In Tablet Dosage Form Using Uv- Spectrophotometry, Journal of Pharmacy and Biological Sciences, 2012, 1(4),20-23.
11. Liz Luiz M, Jose MG, et al, Simultaneous Determination of Chlorthalidone and Spironolactone with Univariate and Multivariate Calibration: Wavelength Range Selection. Journal of AOAC international, 1999, 82(5), 1054-63.
12. Rajamanickam V, Stephen RB, et al, A validated RP-HPLC method of Metoprolol Succinate and Amlodipine Succinate from bulk drugs, Scholars Research Library, Der Pharmacia Lettre 2010, 2(4), 40-6.
13. Jadhav AS, Tarkase KN and Deshpande AP, Quantitative Determination of Metoprolol Succinate in bulk and tablet Dosage form through comparative study of UV and derivative Spectroscopy, Scholars Research Library, Der Pharmacia Lettre, 2012, 4 (3), 763-7.
14. Arshad K, Sanjeev M, Onkar S, et al, Simultaneous Determination of Atenolol and Chlorthalidone by LC–MS–MS in Human Plasma, Chromatographia, 2008,68(9-10), 721- 9.
15. Azzam AKM, Saad B, Aboul-Enein HY, Simultaneous determination of Atenolol, Chlorthalidone and Amiloride in pharmaceutical preparations by capillary zone electrophoresis with ultraviolet detection, Biomed Chromatogr, 2010, 24(9),977-81. 16. Al ARM, Spoorthy N, et al, Simultaneous
estimation of Metoprolol succinate & Telmisartan in tablet dosage form by RP-HPLC, Journal of Pharmacy Research, 2012, 5(8), 4585.
17. Sunil LB, Ankit BP, Kashyap KB, et al, Simultaneous Estimation of Metoprolol Succinate and Olmesartan Medoxomil in Pharmaceutical Formulation by Thin-Layer Chromatographic-Densitometric Method, ISRN Analytical Chemistry, 2012,7.
18. Mitesh DP and Purnima DH, A Validated and Simplified RP-HPLC of Metoprolol Succinate from Bulk Drugs, Asian J. Research Chem, 2009,2(2),119-122.
19. Sainath K, Srinivasulu RT, et al, Ultra performance liquid chromatographic method development and Validation for the quantification of impurities and degradation products In the Metoprolol succinate ER tablets, IJPBS, 2012, 2(4), 247-255.
Page 14 of 14 21. Veereswara RR, Dr.Abhijit MD, et al,
Analytical Method Development and Validation of Metoprolol succinate and Hydrochlorothiazide in Pharmaceutical formulation by RP-HPLC method, International journal of pharma world research, 2012,3(3),1-13.
22. Bhargavi DK, Srinivasa rao N, et al, RP- HPLC method for estimation of Metoprolol in bulk drug, International Journal of Science Innovations and Discoveries, 2011, 1(2), 151-7. 23. Vachhani KH and Patel SA, Development and
validation of spectrophotometric method for simultaneous estimation of Metoprolol succinate and Olmesartan Medoxomil in tablet, Journal of Applied Pharmaceutical Science, 2011, 1(7),112-115.
24. Vora BN, Parmar RR, et al, Absorption Correction Method for Simultaneous Estimation of Metoprolol Succinate and Olmesartan Medoxomil in Combined Tablet Dosage Form, Journal of pharmaceutical science and bioscientific research, 2012, 2(2),54-57.
25. Hapse SA, Bhagat BV, Mogal SA, Kamod AC, Spectrophotometric Estimation and Validation of Metoprolol Succinate And Amlodipine Besylate By Different Method From Pure And Tablet Dosage Form, International Journal of Pharm Tech Research, 2013, 5(1), 126-131.
26. Ludwig H, Validation of Analytical Methods and Procedures; Labcompliance News, USA 2007