2776 DOI:10.21276/ijprhs.2018.05.05
Paul J Net al. CODEN (USA)-IJPRUR, e-ISSN: 2348-6465
Original Article
Sex Estimation by Discriminant Function Analysis of
Hand Dimensions of the Igbos in Nigeria
G S Oladipo, V C Amasiatu, A S Alabi, J N Paul
*, C V Maduabuchukwu
Department of Anatomy, Faculty of Basic Medical Sciences, College of Health Sciences, University of Port Harcourt, Nigeria.
A R T I C L E I N F O A B S T R A C T
______
1. INTRODUCTION
Sex determination without doubt is an important as well as the foremost criteria in establishing the identity of an individual 1. Discriminating sex could be complicated
International Journal of Pharma Research and Health Sciences
Available online at
www.pharmahealthsciences.net
Received:30 Jun 2018 Accepted:12 Oct 2018
The ability to discriminate sex is the number one criteria in establishing identity. This is especially so during a search for a missing individual. The study therefore employed discriminant function analysis to estimate sex from hand dimensions among the Igbos of South Eastern Nigeria. A total of 450 subjects were included in the study. Hand dimensions [Right Hand Length (RHL), Right Hand Breadth (RHB), Right Palm Length (RPL), Right Palm Width (RPW), Right Hand Index (RHI), Left Hand Length (LHL), Left Hand Breadth (LHB), Left Palm Length (LPL), Left Palm Width (LPW), Left Hand Index (LHI)] was measured using a digital Vernier caliper with 0.01 mm accuracy. T-test guided by Levene’s test for equality of mean and paired t-test was used to compare mean differences as well as side differences, while sex estimation was done using discriminant function analysis (DFA). Significance level was set at 95% confidence interval, hence p < 0.05 was considered significant. All these was done using statistical package for the social sciences (SPSS IBM ver 23.0 Armonk, New York, USA). Results were therefore as follows: the mean standard deviation of the right hand for males were 202.67 21.70 mm (RHL), 79.98 19.94 mm (RHB), 93.30 23.42 mm (RPL), 76.23 19.66 mm (RPW), 43.26 42.16 mm (RHI); while the left male values were 205.17 9.65 mm (LHL), 78.47 19.93 mm (LHB), 93.99 23.04 mm (LPL), 77.04 19.15 mm (LPW), 38.33 9.94 mm (LHI). The female values for the right hand were 190.74 10.66 mm (RHL), 79.96 11.28 mm (RHB), 97.81 17.99 mm (RPL), 76.40 15.48 mm (RPW), 42.08 6.39 mm (RHI), 191.57 20.72 mm, while those of the left includes: (LHL), 76.85 16.53 mm (LHB), 97.99 18.65 mm (LPL), 78.04 14.98 mm (LPW), 44.29 45.62 mm (LHI). The results however showed females to have higher mean values in most of the measured parameters except for RHL, RHB, RHI, LHL and LHB. However, mean values were generally not significant except for RHL (t= 4.94,P= 0.0001) and LHL (t= 5.95,P= 0.0002). DFA model showed a Wilk’s lambda predictability value of 0.667 and a significant F-likelihood ratio (P= 0.001), with a model accuracy of 70.5%, with a better prediction for female (72.4%) as compared to the males (69.8). Perhaps the prediction level as observed was quite low, but cannot be ignored in forensic investigations involving sex estimation, as the study will be relevant in forensic science as well as anthropology.
Key words:Hand Dimensions, Sex Estimation, Igbo, Discriminant Function Analysis.
Corresponding author *
J.N. Paul
especially in cases of intersex, bodies in advanced state of putrefaction, as well as mutilated and fragmented remains. Usually it is common to recover peripheral and dismembered parts of the body.
Dismembered body parts are frequently found in modern era, due to increased events of natural disasters like earthquakes, landslide etc. and man-made disasters like stampedes, building collapse, road traffic, air traffic and railway accidents, mining accidents, fire, explosions etc. Dismembered body parts are frequently found also due to increased murder events where body parts are being mutilated by a murderer in order to destroy all traces of identity as well as to facilitate the disposal of the dead2. However, in cases of mass disaster and assault where body parts are dismembered, mutilated and or fragmented to conceal the identity of the victim, identification becomes difficult2.
However, among the primary factors of identification (race, sex, age and stature), sex determination is one of the foremost criteria in establishing the identity of an individuals. Hence accurate sexing of the remains, primarily narrows down the pool of possible victim matches3. Age of epiphyseal fusion varies in both sexes 4. Therefore, sex determination from hand dimensions will be relevant in forensic science in the identification of human remains. Traditionally, the pelvic bone was the most common bone used in sexual dimorphism in combination with the cranium 5
. However, a number of authors have estimated sex from the bones of the appendages, especially the hand 6, 7, 2, 8, 9. Ibeachu et al. (2011) has observed sexual dimorphism using hand dimensions among Nigerians 10, while Kanchan and Rastogi, 2009 also observed considerable sexual dimorphism among Indians using the morphometric parameters of the hand. However, this study employed the best statistical model in sex determination being the Discriminant Function Analysis (DFA) designed by Fisher11, 12in other to estimate sex from hand dimensions among the Igbos of South Eastern Nigeria.
2. MATERIALS AND METHODS
Following Ethical clearance obtained from the University of Port Harcourt ethics and professional committee, two hundred (400) adult subjects of Igbo origin aged 18 to 65 years (200 males and 250 females) were involved in the study. A multistage stratified sampling technique was
adopted and sample size determined using Fisher’s formula
for infinite population after the population of the Igbos wereabinitio estimated from the total Nigerian population.
Population;
2.1 Inclusion Criteria
1. Subjects must be Igbos by both parents up to the second generation.
2. They must healthy be individuals without any form of deformity to the hands.
3. They must have had no injury, fracture, or any form of surgical procedure on either hand.
2.2 Exclusion Criteria
Subjects excluded from the study includes: 1. Those who are not of Igbo origin or hybrids. 2. Subjects with amputated hands.
3. Subjects below 18 and above 65 years of age.
However, a written informed consent was therefore obtained from the subjects who meet the inclusion criteria after the procedure and details of the research was verbally explained to them. Hand dimensions were thereafter obtained from these subjects using electronic digital Vernier caliper of 0.01 mm precision (Mitutoyo). Measurement taken includes: Right Hand Length (RHL), Right Hand Breadth (RHB), Right Palm Length (RPL), Right Palm Width (RPW), Right Hand Index (RHI), Left Hand Length (LHL), Left Hand Breadth (LHB), Left Palm Length (LPL), Left Palm Width (LPW) as well as Left Hand Index (LHI).
Subjects were made to sit comfortably on a back chair with their hand placed in supine position on a table with fingers extended. They were politely asked to remove their wrist watches, wrist bands as well as rings to avoid interference or alteration of values. Hand Length (HL) was measured as a straight distance between the mid-point of the distal crease of the wrist joint and the most anterior projecting part of the middle finger, while the breadth (HB) was measured as a straight distance from the most laterally placed point on the 2nd metacarpal to the most medially placed point on the fifth (5) metacarpal. Whereas Hand Index was obtained
mathematically as .
Palm Length (PL) was measured as the distance from the mid- point of the distal transverse crease of the wrist to the midpoint of proximal flexion crease of the middle finger. However, Palm Width (PW) was measured as a horizontal line along the point where the thumb and hand meet at the hypothenaeminence. The line must be perpendicular to a line dividing the 3rd(middle) finger into equal halves.
2778
Table 1: Descriptive Statistics of Hand Dimensions of the Igbos
Variables MALE (N = 200) FEMALE (N = 250) TOTAL (N = 200)
Min Max Mean S.D Min Max Mean S.D Min Max Mean S.D
Age (years) 19.00 36.00 25.75 3.63 18.00 40.00 24.61 3.28 18.00 40.00 25.18 3.50
Right Hand Length (mm) 19.20 259.00 202.67 21.70 164.00 216.00 190.74 10.66 19.20 259.00 196.71 18.07 Right Hand Breadth (mm) 22.10 109.60 79.98 19.94 41.10 129.90 79.96 11.28 22.10 129.90 79.97 16.16 Right Palm Length (mm) 10.90 132.60 93.30 23.42 14.20 160.10 97.81 17.99 10.90 160.10 95.56 20.95 Right Palm Width (mm) 15.40 100.90 76.23 19.66 18.70 130.90 76.40 15.48 15.40 130.90 76.31 17.65 Right Hand Index (mm) 11.76 448.96 43.26 42.16 20.55 66.62 42.08 6.39 11.76 448.96 42.67 30.08 Left Hand Length (mm) 185.00 228.00 205.17 9.65 17.50 219.00 191.57 20.72 17.50 228.00 198.37 17.51 Left Hand Breadth (mm) 23.30 103.50 78.47 19.93 17.90 126.80 76.85 16.53 17.90 126.80 77.66 18.28 Left Palm Length (mm) 12.30 133.00 93.99 23.04 15.10 161.80 97.99 18.65 12.30 161.80 95.99 21.01 Left Palm Width (mm) 22.60 100.00 77.04 19.15 23.20 129.40 78.04 14.98 22.60 129.40 77.54 17.15 Left Hand Index (mm) 11.44 53.08 38.33 9.94 8.91 487.43 44.29 45.62 8.91 487.43 41.31 33.06
Min = Minimum, Max = Maximum, S.D = Standard Deviation, N = Number of Subjects
Table 2: Independent sample T-test comparing male and female hand dimensions
Variables Levene's Test for Equality of Variances t-test for Equality of Means
F-value P-value Inference df 95% CI of the Difference
MD SEMD t-value P-value Inference
Lower Upper
Age (years) 1.80 0.18 EVA 198.00 0.18 2.10 1.14 0.49 2.33 0.02 Significant
Right Hand Length (mm) 0.44 0.51 EVA 198.00 7.17 16.70 11.93 2.42 4.94 <0.01 Significant Right Hand Breadth (mm) 14.69 0.00 EVNA 156.45 -4.51 4.54 0.02 2.29 0.01 0.99 Not Significant Right Palm Length (mm) 17.41 0.00 EVNA 185.69 -10.33 1.32 -4.51 2.95 -1.53 0.13 Not Significant Right Palm Width (mm) 5.70 0.02 EVNA 187.68 -5.11 4.76 -0.18 2.50 -0.07 0.94 Not Significant
Right Hand Index (mm) 2.17 0.14 EVA 198.00 -7.23 9.59 1.18 4.26 0.28 0.78 Not Significant
Left Hand Length (mm) 2.45 0.12 EVA 198.00 9.10 18.11 13.61 2.29 5.95 <0.01 Significant
Left Hand Breadth (mm) 3.77 0.05 EVA 198.00 -3.49 6.73 1.62 2.59 0.63 0.53 Not Significant
Left Palm Length (mm) 13.09 0.00 EVNA 189.76 -9.84 1.85 -4.00 2.96 -1.35 0.18 Not Significant
Left Palm Width (mm) 6.23 0.01 EVNA 187.18 -5.80 3.79 -1.00 2.43 -0.41 0.68 Not Significant
Left Hand Index (mm) 1.05 0.31 EVA 198.00 -15.17 3.24 -5.96 4.67 -1.28 0.20 Not Significant
M.D = Mean difference, S.E.M.D = Standard Error of Mean Difference, df = degree of freedom, F-value = Fischer’s value, P-value = Probability value, EVA = Equal Variance Assumed, EVNA = Equal Variance Not Assumed, CI = Confidence Interval
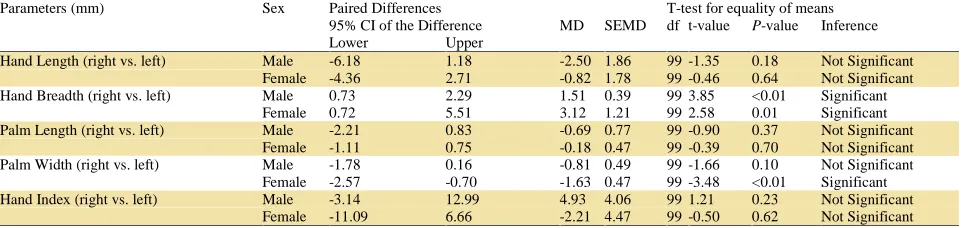
Table 3: Paired sample T-test comparing the right and left hand dimensions of the subjects
Parameters (mm) Sex Paired Differences T-test for equality of means
95% CI of the Difference MD SEMD df t-value P-value Inference
Lower Upper
Hand Length (right vs. left) Male -6.18 1.18 -2.50 1.86 99 -1.35 0.18 Not Significant
Female -4.36 2.71 -0.82 1.78 99 -0.46 0.64 Not Significant
Hand Breadth (right vs. left) Male 0.73 2.29 1.51 0.39 99 3.85 <0.01 Significant
Female 0.72 5.51 3.12 1.21 99 2.58 0.01 Significant
Palm Length (right vs. left) Male -2.21 0.83 -0.69 0.77 99 -0.90 0.37 Not Significant
Female -1.11 0.75 -0.18 0.47 99 -0.39 0.70 Not Significant
Palm Width (right vs. left) Male -1.78 0.16 -0.81 0.49 99 -1.66 0.10 Not Significant
Female -2.57 -0.70 -1.63 0.47 99 -3.48 <0.01 Significant
Hand Index (right vs. left) Male -3.14 12.99 4.93 4.06 99 1.21 0.23 Not Significant
Female -11.09 6.66 -2.21 4.47 99 -0.50 0.62 Not Significant
2.3 Statistical analysis
Descriptive statistics was used in establishing cutoffs, while paired and unpaired (independent) t-test was used to test for differences (side and sex) in the measured parameters. Discriminant function analysis (DFA) was used to classify the measured parameters into group membership with a prediction model established for sex determination (estimation). Confidence interval was set at 95%, hence P< 0.05 was considered statistically significant. All these were achieved with the aid of the statistical package for the social sciences (SPSS; IBM version 23, Armonk, New York, USA).
2.4 Data Analysis
This study considered sex estimation from hand dimensions using discriminant function analysis (DFA). Data obtained were presented according to type. Data was presented in
Table (1 – 10); with descriptive statistics (as mean SD) presented in Table 1, while the test of mean difference (MD) for sex and side differences using independent (guided by
Table 4: Tests of equality of group means Parameters Wilks'
Lambda
F df1 df2 P-valueInference
Right Hand Length (mm)
0.890 24.370 1 198 <0.001 Significant
Right Hand Breadth (mm)
1.000 0.000 1 198 0.994 Not Significant
Right Palm Length (mm)
0.988 2.330 1 198 0.129 Not Significant
Right Palm Width (mm)
1.000 0.005 1 198 0.943 Not Significant
Right Hand Index (mm)
1.000 0.076 1 198 0.782 Not Significant
Left Hand Length (mm)
0.848 35.415 1 198 <0.001 Significant
Left Hand Breadth (mm)
0.998 0.391 1 198 0.533 Not Significant
Left Palm Length (mm)
0.991 1.817 1 198 0.179 Not Significant
Left Palm Width (mm)
0.999 0.170 1 198 0.681 Not Significant
Left Hand Index (mm)
0.992 1.631 1 198 0.203 Not Significant
Table 5: Table tests of equality in population covariance matrices and canonical correlation
Box's M equality in covariance Eigen values Function Eigen value Canonical Correlation
Box's M 1782.317 1 0.500 0.577
F
Approximately 30.688
df1 55
df2 126,601.891
P-value <0.001
Table 6:Wilks' lambda test for predictability into group membership Test of
Function(s)
Wilks' lambda
X2
df P-value Inference
1 0.667 78.293 10 <0.001 Significant
Table 7: Canonical discriminant function coefficient structured, standardized and unstandardized
Box's M structure Matrix coefficients Standardized canonical discriminant function coefficients Unstandardized canonical discriminant function coefficients Variables (mm) Functiona
Function Functionb
Left Hand Length 0.598** 0.876 0.054 Right Hand
Length
0.496** 0.862 0.050
Right Palm Length
-0.153* -0.204 -0.010
Left Palm Length -0.135* 0.009 0.000 Left Hand Index -0.128* 0.615 0.019 Left Hand
Breadth
0.063* 0.608 0.033
Left Palm Width -0.041* -0.941 -0.055 Right Hand Index 0.028* 0.901 0.030 Right Palm Width-0.007* 0.537 0.030 Right Hand
Breadth
0.001* -0.566 -0.035
(Constant) -19.671
Variables that are making; ***strong predictions; **average prediction; *poor prediction.a
Function - Pooled within-groups correlations between discriminating variables and standardized canonical discriminant functions; b
Function - Coefficients used for computing group membership value
Table 8:Functions at group centroids
Sex Functiona
Male 0.704
Female -0.704
a
Unstandardized canonical discriminant functions evaluated at group means
Table 9: Classification function coefficients
Variables (mm) Sex
Male Female
Right Hand Length 0.920 0.849
Right Hand Breadth -0.023 0.026
Right Palm Length 0.221 0.235
Right Palm Width -0.029 -0.072
Right Hand Index 0.555 0.513
Left Hand Length 1.617 1.540
Left Hand Breadth -0.211 -0.258
Left Palm Length -0.071 -0.071
Left Palm Width -0.224 -0.147
Left Hand Index 0.692 0.665
(Constant) -273.073 -245.385
Table 10: Percentage predictability for group membership Prediction (%) Sex Predicted group
membership
Total
Male Female
Originala
Male 168 (74.7) 57 (25.3) 225 (100) Female 50 (22.2) 175 (77.8) 225 (100) Cross-validatedb
Male 157 (69.8) 68 (30.2) 225 (100) Female 62 (27.6) 163 (72.4) 225 (100) a
73.5% of original grouped cases correctly classified;b
70.5% of cross-validated grouped cases correctly classified
Data obtained from 200 subjects were analyzed as presented in Table 1–10. Subjects were of the same age bracket with a mean age of 25.75±3.63 years (male) and 24.61±3.28 years (female).
As obtained, the mean ± SD values of the Right Hand [Right Hand Length (RHL), Right Hand Breadth (RHB), Right Palm Length (RPL), Right Palm Width (RPW), Right Hand Index (RHI)] for males were 202.67±21.70 mm, 79.98±19.94 mm, 93.30±23.42 mm, 76.23±19.66 mm, 43.26±42.16 mm respectively; while the female values were 190.74±10.66 mm, 79.96±11.28 mm, 97.81±17.99 mm, 76.40±15.48 mm and 42.08±6.39 mm respectively.
Also the mean ± SD values of the Left Hand [Left Hand Length (LHL), Left Hand Breadth (LHB), Left Palm Length (LPL), Left Palm Width (LPW), Left Hand Index (LHI)] for male subjects were 205.17±9.65 mm, 78.47±19.93 mm, 93.99±23.04 mm, 77.04±19.15 mm and 38.33±9.94 mm respectively; while those of the female subjects were 191.57±20.72 mm, 76.85±16.53 mm, 97.99±18.65 mm, 78.04±14.98 mm and 44.29±45.62 mm respectively. Higher mean values were observed for male subjects in the following variables as compared to the female subjects (Right Hand Length, Right Hand Breadth, Right Hand Index, Left Hand Length and Left Hand Breadth); however, others were higher in female subjects compared to the males (Right Palm Length, Right Palm Width, Left Palm Length, Left Palm Width and Left Hand Index) [Table 1].
Using unpaired (independent sample t-test) for sex
differences, with Levene’s test for equality of variance
guiding the assumptions made. Thus Right Hand Length (F = 0.44, P = 0.51), Right Hand Index (F = 2.17, P = 0.14), Left Hand Length (F = 2.45, P = 0.12), Left Hand Breadth (F = 3.77, P = 0.05) and Left Hand Index (F = 1.05, P = 0.31) varied significantly as compared in box sex, thus unequal variance was assumed, while for the rest of the variables equal variance was assumed for the analysis of mean difference of the variables. However, in both sex, significant differences in hand dimensions were observed in the following parameters: Right Hand Length (t = 4.94,
P<0.01) and Left Hand Length (t = 5.95, P<0.01), while the
2780
Side differences were compared using a paired t-test. Left Hand Length was higher than Right Hand Length and the Left Palm Length was also higher than the Right Palm Length in both sex, however the differences were not statistically significant [t = -1.35; P = 0.18 (male), t = -0.46;
P = 0.64 (female)] and [t = -0.90; P = 0.37 (male), t = -0.39; P = 0.70 (female)] respectively. On the other hand, the Left
Palm Width was higher than the Right Palm Width in both sex, but this time the mean difference (MD) was significant in female subjects (t = -3.48; P< 0.01), but not significant in the males (t = -1.66; P = 0.10). On the contrary, the Right Hand Breadth was higher than the Left Hand Breadth in both sex with a significant MD [t = 3.85; P< 0.01 (male), t = 2.58;
P = 0.01 (female)], while for Hand Index, significant
difference was not observed in both sex [t = 1.21; P< 0.23 (male), t = -0.50; P = 0.62 (female)]; however, the Right was Higher than the Left in males and vice versa in the females. Discriminant function analysis (DFA) was carried out using ten (10) parameters. In Table 4, the test of equality of mean difference of male and female values were carried out, with two out of the eight (8) entered into the model being significant (P< 0.001). As presented in Table 5,the Box’s M
test of equality in population covariance matrices (which tests the null hypothesis of equal population covariance matrices) as well as the canonical correlation; provides an index of overall model fit. Significant difference was observed in the Box’s M covariance matrix; hence equal
group variance cannot be assumed. This suggests a larger discrepancy in the predictor variables. However, the magnitude or the actual effect size of the predictors (being the canonical coefficients) and the outcome becomes the square of the coefficient of the canonical correlation (0.577)2, suggests that the model can only explain 33.29% of the grouping (discriminating) variables (i.e. the sex of the individual). Similarly,Wilks' lambda test for predictability into group membership as presented in Table 6 showed that the predictor variables will make statistically significant
predictions (Wilk’s lambda = 0.667,P< 0.001). Standardized
and unstandardized coefficients were presented in Table 7, with the unstandardized coefficients used to generate the discriminant function equation. The discriminant function coefficient (unstandardized) indicates the partial contribution of each variable in the discriminant function equation. These values provide information on the relative importance of each variable and are therefore used to assess each
individual’s variables unique contribution to the discriminant
function equation; hence DF(eqn.)= (0.054 x RHL) + (0.050 x RHB) + (-0.010 x RPL) + (0.000 x RPW) + (0.019 x RHI) + (0.033 x LHL) + (-0.055 x LHB) + (0.030 x LPB) + (0.030 x LPW) + (-0.035 x LHI) -19.671. Table 8 examined the group centroids (the group mean of the predictor variables), which is a function of group membership or classification. As observed, the male have a group mean of 0.704, while the females have a group mean of -0.704. Hence functions at group centroids with a group mean near to a centroid is
predicted to belong to that group (i.e. close to 0.704 as male, while -0.704 as female). Once the discriminant functions are determined groups are differentiated, the utility of these functions can be examined via their ability to correctly classify each data point to their a priori groups. Again in Table 9, classification function coefficients also known as linear discriminant functions were presented. Classification functions derived from the linear discriminant functions are used to achieve this purpose. This is expressed as Ck= Ck0+
Ck1x1+ Ck2x2+...+ CkmXm. Where Ckis the classification score for group k and C is the Coefficient. These coefficients are presented for each parameters accordingto sex (Table 9). The Left Hand Length (0.60) as well as the Right Hand Length (0.50) are the variables with the highest prediction strength for group membership classification, with the least being Right Hand Breadth (0.001). According to the classification summary as presented in Table 10, 73.5% of the hand parameters measured were ab initio correctly classified according to sex; however, upon cross validation, 70.5% of the grouped cases therefore accurately classified.
3. RESULTS
The study has its focus on gender determination using hand parameters (dimensions) of males and females of Igbo origin, in South Eastern Nigeria. Often time, skull and pelvic bones are used in sex determination due to the fact that they give relatively more accurate predictions.
When a substantive amount of the human skeletal remains are available, sex can easily be determined especially when they are in good condition.5, 13
Findings made showed that male Igbos have longer hand length with a shorter hand breadth, while females on the contrary have shorter hand length with a wider hand breadth. Differences between sexwere significant at P< 0.05 between the male and female right as well as the left hand length using paired sample t-test.
Discriminant function analysis (DFA) as used evaluated the predictability of the model of which 70.5% of the measured parameters were correctly classified. This is relatively weak although can be used with caution considering other sex discriminating parameters that may be available aside hand parameters. However, the strength of any DFA model lies in its ability to classify over 80% of the measured parameters into group membership; with a better prediction for female (36.5%) compared to the males (34.0%). Previous studies by Eshak et al. (2011) also reported sexual dimorphism in hand bone length among many nationalities 14 . Kanchan and Rastogi (2009) also observed considerable sexual dimorphism in the morphometric parameters of the hand in Indian population. Also findings made was also in line with those of Manning et al. (2000)15 who observed differences in Hand Length, Hand Breadth, Palm Length and Hand Index between male and female15.
16
, Hausas as well as the Yorubas. However, with the advancement in modern technology, DNA analysis is employed in sex determination which has greatly simplified forensic investigations. Owing to the high cost of DNA technology, anthropometry therefore remains a cheaper and easily available alternative in forensic investigations especially in developing countries.
4. DISCUSSION
The current study evaluated the hand dimensions of male and female Igbo subjects. Hand length (HL), Hand Breadth (HB), Palm Length (PL), Palm Width (PW) and Hand Index (HI) were measured. The male right HL was significantly higher than those of the females, while the female left HL was significantly higher than those of the males. Other parameters measured showed varying degrees of differences, but were not significant at P< 0.05. However, with DFA (a better tool for sex categorization), 70.5% of the variables were successfully grouped according to sex (which is relatively low in its predictive power). Hence sex can be estimated among the Igbos of South Eastern Nigeria using hand dimensions. However, this research will be relevant to forensic science and physical anthropology. Hence in the absence of other body parts that can better predict sex, hand dimensions can offer preliminary identification.
5. REFERENCES
1. Paola M, Stefano D, Inmaculad L, Aleman K and Miquel C. Sex assessment from the carpal bone.Journal of Forensic Science International 2011; 23, 206–216. 2. Kanchan T, Krishan K, Personal Identification in
Forensic Examinations. Anthropology 2013; (1): 1–14. 3. Krishan K, Kanchan T, Sharma A. Multiplication Factor
versus regression analysis in stature estimation from hand and foot dimensions. Journal of Forensic Legal Medicine 2012; 19 (4): 211–4.
4. Okunribido O O, A survey of hand anthropometry of female rural farmworkers in Ibadan, Western Nigeria.Ergonomics 2000; 43: 282–292
5. Iscan, M.Y. Forensic anthropology of sex and body size.Forensic Science International 2005; 147: 107 –
112.
6. Case D T, Ross RH. Sex determination from hand and foot bone lengths. Journal of Forensic Science 2007; 52: 264–270.
7. Kanchan T, Rastogi P. Sex determination from hand dimensions of North and South Indians. Journal of Forensic Science 2009; 54 (3): 546–550
8. William T, Pepitone M, Christensen S, Cooke B, Huberman A, Breedlove N et al. Finger length ratios and sexual orientation. Nature 2000; 404; 455–456 9. Tanuj K, Kewal K, Abhilasha S and Ritesh G., A study
of correlation of hand and foot dimensions for personal identification in mass disasters. Forensic Science International 2010; 21: 112ei–112e6
10. Ibeachu PC, Abu E C and Didia, B.C. Anthropometric Sexual Dimorphism of Hand Length, Breadth and Hand Indices of University of Port-Harcourt Students. Asian Journal of Medical Sciences 2011; 3 (8): 146-150. 11. Fisher R A. The statistical utilization of multiple
measurements. Ann Eugen. 1936; 8: 376–86
12. Fisher R A. The precision of discriminant function. Ann Eugen 1940; 10: 422–9.
13. Krogman W M, Iscan Y M. The Human Skeleton in Forensic Medicine.2nd ed. Springfield, Illinos, U.S.A.; Charles C. Thomas Pub Ltd. 1986; P. 30–5
14. Eshak G, Ahmed H and Abdelgwad E. Gender determination from hand bone length and volume using multidirector computed tomography. Journal of Forensic and Legal Medicine 2011; 18(6): 246–252 15. Manning J T, Barley L, Walton J. The 2nd: 4th digit
ratio, sexual dimorphism, population differences and reproductive success: Evidence for sexually antagonistic genes? Evol Hum Behav 2000; 21(3): 163-183
16. Numan A I, Idris M O, Zirahei J V, Amaza D S. and Dalori B. Prediction of Stature from Hand Anthropometry: A Comparative Study in the Three Major Ethnic Groups in Nigeria. British Journal of Medicine and Medical Research 2013; 3(4): 10621073