Research on an Edge Detection Algorithm of
Remote Sensing Image Based on Wavelet
Enhancement and Morphology
Yu Xiong
Faculty of Land Resource Engineering, Kunming University of Science and Technology, Kunming China Email:[email protected]
Jun Li, Xiaoqing Zuo and Zhenting Chen
Faculty of Land Resource Engineering, Kunming University of Science and Technology, Kunming China Faculty of Computer Information, Kunming Metallurgy College, Kunming, China
Email: [email protected], [email protected] and [email protected]
Abstract—According to the basic features of high resolution remote sensing images, a novel edge detection algorithm based on wavelet enhancement and mathematical morphology is proposed. First, the remote sensing image is decomposed by a wavelet transform to get the low frequency part and high frequency part. Then a Laplacian sharpening operation is doing on the low frequency part to enhance the edge information. At the same time, the edge information of high frequency part is enhanced by means of linear enhancement after being denoised with threshold method. Last, the edge of image which has been enhanced is detected by using mathematical morphology. Experimental results indicate that our method can achieves better image processing effect than traditional method, has strong ability of eliminating noise and keeping clear image edge. It is more suitable for high resolution remote sensing image in edge detection and extraction.
Index Terms—high resolution remote sense image; edge
detection; wavelet enhancement; morphology
I. INTRODUCTION
With the rapid development of remote sensing technology, the amount of high resolution remote sensing data has a sharp increase. High resolution remote sensing image has the advantages of high spatial resolution, rich texture information and clear geometry of objects on earth [3, 4]. However, it is exactly the reason why the information of high resolution remote sensing image cannot be extracted automatically and effectively. As the edge focuses on the most information of an image, how to extract the edges effectively is extremely important for image-recognition [1,2].
Edge detection technology can not only keep the structural information of boundary, but also can reduce the amount of data in image processing and simplify image-processing analysis process. There are many researches on edge detection at home and abroad, most of them are the algorithms based on operators and mathematical morphology, such as Sobel operator [5], Robert operator, Log Operator and Canny operator [6], they have the advantages of small calculating amount and fast speed. But they are seriously affected by noise, the accuracy and anti-noise ability can not be fused well. Besides, they are less efficient for detecting very low contrast edges. Some algorithms involving wavelet computation[2] might yield better results, but can be computationally intensive, and may not be suitable for low cost implementations. Hence there is a need to develop edge detection algorithm tackling effectively varieties of images.
For the problems proposed above, a novel edge detection algorithm based on wavelet enhancement and mathematical morphology is put forward. First, the remote sensing image is decomposed by wavelet transform to get the low frequency part and high frequency part. Then a Laplacian sharpening operation is doing on the low frequency part to enhance the edge information. At the same time, the edge information of high frequency part is enhanced by means of linear enhancement after being denoised with threshold method. Then we do an inverse wavelet transform operation on the low and high frequency part that are enhanced to get the enhancement image. Last, the edge of high remote sensing image is detected by using the mathematical morphology. Experimental results indicate that the new edge detection achieves better image processing effect than traditional method, has strong ability of eliminating noise as well as keeping clear image edge. It is more suitable for high resolution remote sensing image in edge detection and extraction.
II.BASIC PRINCIPLE A Basic Theory of Wavelet Transform
When digital images are to be viewed or processed at multiple resolutions, wavelet transform is a mathematical tool of choice. The definition of a wavelet function is: assume ψ( )t is a square and integrable function,
thusψ( )t ∈L R2( ). If the Fourier transform of the function
ˆ ( )w
ψ satisfies the following conditions[8]:
( )
R
t
C
dw
w
ψ
=
∫
ψ
< ∞
(1)
Then we can call that
ψ
( )
t
is a basic wavelet. Thedefinition of wavelet transform of function f x( )is
1/2
( , ) (
)
( )
x b
f a b
C a
f x
dx
a
ψ
ψ
− +∞ψ
−∞
−
⎡
⎤
=
⎢
⎥
⎣
⎦
∫
(2)
The inverse wavelet transform is
1/2 1/2 2
( ) ( ) ( , )( x b )
f x C a f a b a dadb
a
ψ
ψ
ψ
+∞
− −
−∞
− ⎡ ⎤
= × ⎢ ⎥
⎣ ⎦
∫∫
(3) For an image which size is N N× , the wavelet
decomposition process of it is shown as follows[1,2,7]:
Fig.1 image wavelet decomposition schematic diagram
The image features that are described by 4 sub-bands LL,HL,LH,HH are shown as below:
(1) LL sub-band focuses on the original image of main energy and it mainly reflects low frequency part of the image.
(2) HL sub-band mainly reflects high frequency part of the horizontal direction of an image. As the edges of an image are focused on the high frequency part, HL sub-band has preserved the horizontal direction edge information well.
(3) LH sub-band mainly reflects high frequency part of the vertical direction of an image and it has preserved the vertical direction edge information well.
(4) HH sub-band mainly reflects high frequency part of the diagonal line direction of an image and it has preserved the diagonal line direction edge information well.
Fig.2 is a remote sensing image and Fig.3 is the result of doing a wavelet multi-resolution decomposition operation on Fig.2. Where the wavelet base type is ‘coif3’ and decomposition progression is ‘1’. Fig 3.(a),(b),(c),(d) are the low frequency information, high frequency
information of horizontal, vertical, diagonal line direction of the original image respectively.
Fig.2 A remote sensing image
Fig.3 Wavelet decomposition result
B Theory of Laplacian Sharpening
As wavelet transform will do a low-passing filtering operation on the low frequency part of an image, the edge of low frequency part is blurred. As a result, the low frequency part will be sharpened by using Laplacian algorithm to enhance the edge information. It is better for the following edge detection work[9].
In the following part, we will introduce the definition of Laplacian operator. The Laplacian of an image
( , )
f x y
, denoted∇
2f x y
( , )
, is defined as
2 2
2
2 2
( , )
( , )
( , )
f x y
f x y
f x y
x
y
∂
∂
∇
=
+
∂
∂
(4) Commonly used digital approximations of the second derivatives are
(a) (b)
2
2
(
1, )
( 1, ) 2 ( , )
f
f x
y
f x
y
f x y
x
∂
=
+
+
−
−
∂
(5) and 22
( ,
1)
( ,
1) 2 ( , )
f
f x y
f x y
f x y
y
∂
=
+ +
− −
∂
(6) so that
2
[ (
1, )
( 1, )
( ,
1)
( ,
1)] 4 ( , )
f
f x
y
f x
y
f x y
f x y
f x y
∇
=
+
+
−
+
+
+
− −
(7) Both derivatives sometimes are defined with the signs opposite to those shown here, resulting in masks that are the negatives of the preceding two masks. Enhancement using the Laplacian is based on the equation
2
( , )
( , ) [
( , )]
g x y
=
f x y
+ ∇
c
f x y
(8)where
f x y
( , )
is the input image,g x y
( , )
is the enhanced image, andc
is 1 if the center coefficient of themask is positive, or -1 if it is negative[1]. Because the Laplacian is a derivative operator, it sharpens the image[1,2]. In this paper, the Laplacian mask that we choose is [0, 1, 0; 1,-8, 1; 0, 1, 0].
C Theory of Wavelet Threshold Denoising
Noise and the edge information both focus on the high frequency part of an image, but we want to preserve the edge information when filtering the noise. For this, wavelet threshold denoising method is introduced to filter the noise exists in the high frequency part. Assume W and Wr are the values of the high frequency sub-band coefficients. W and Wr are before filtering and after filtering respectively. So we can define wavelet soft threshold function is [8]
, ,
,
sgn(
)(
)
ˆ
0
j k j k j k
w
w
T
w
=
⎧
⎪
⎨
−
⎪⎩
, , j k j kw
T
w
T
≥
<
(9)where
sgn(.)
expresses symbolic function.The threshold we choose is VisuShrink threshold. Method of VisuShrink was proposed in 1994 and it is also called the general threshold. The calculating formula for threshold T is [8]
2ln
n
T
=
σ
N
(10)Where,
σ
n is the standard deviation of noise andN
is the length or size of the signal.σ
n can beestimated by means of median estimation method that is put forward by Donoho and Johnstone[9]
ˆ
( ( , )
0.6745
nMedian Y i j
σ
=
(11)D Edge Detection Based on Morphology
Mathematical morphology is a tool of extracting the components of an image and the components are very useful to express and describe the edge and shape of areas of an image. The gray-scale dilation of
f
by structuring elementb
, denotedf
⊕
b
, is defined as[10,11](
)( , ) max{ (
,
)
( , ) ( , )
b}
f
b x y
f x
x y
y
b x y
x y
D
′
′
⊕
=
−
−
′ ′
′ ′
+
∈
(12)Where
D
b is the domain ofb
, andf x y
( , )
is assumed to equal−∞
outside the domain off
.Also, the gray-scale erosion of
f
by structuringelement
b
, is defined as(
)( , ) min{ (
,
)
( , ) ( , )
b}
f
b x y
f x
x y
y
b x y
x y
D
′
′
Θ
=
−
−
′ ′
′ ′
+
∈
(13)Where
D
b is the domain ofb
, andf x y
( , )
is assumed to equal∞
outside the domain of f .Thus we can define the following morphology edge detection operators
Grad
1= ⊕ −
f
b
f
(14)
Grad
2= − Θ
f
f
b
(15) The dilation type operator Grad1 is mainly extracted
the outside edge of an image. The realization process is first doing a dilation operation on the image and then getting the edge information by subtracting the original image from the image that is dilated. Similarly, the erosion type operator
Grad
2 is mainly extracted theinside edge of an image. The realization process is first doing an erosion operation on the image and then getting the edge information by subtracting the image that is dilated from t he original image.
Dilation and erosion can be combined to achieve a variety of effects. For instance, subtracting an eroded image from its dilated version produces a
“morphological gradient”[1], which is a measure of
local gray-level variation in the image. It can be expressed as
Grad
3= ⊕ − Θ
f
b
f
b
(16)Dilation and erosion type operator
Grad
3 is adefinitude.
Fig.4 shows the results of dilation and erosion and morphological gradient. Fig.4(b) is dilating Fig.4(a) using a flat 3*3 structuring element([0 1 0; 1 1 1; 0 1 0]). Fig. 4(c) is the erosion result. Fig.4 (d) is the morphological gradient of the image in Fig.4 (a).
(a) (b)
(c) (d) Fig.4 morphological experiment results
III.OUR METHOD
In order to get a better edge image of a high-resolution remote sensing image, according to the theory above, the paper proposed a novel edge detection algorithm based on wavelet enhancement and morphology. It mainly consists of six procedures.
1. The remote sensing image is wavelet transformed to get low and high frequency coefficients of the image. The wavelet base type is ‘coif3’ and decomposition progression is 3.
2. Enhance the low frequency coefficients with a Laplacian filter. The Laplacian filter is 3*3 with a -8center.
3. For the high frequency coefficients, firstly, we use wavelet threshold de-noising method that is introduced in 2.3 to remove noise. The threshold function we choose is Eq.(10) and threshold is Eq.(11).
4. After denoised process, a linear enhancement operation will be done on high frequency coefficients to enhance the edge information of the high part.
5. Compute the inverse transform with the low frequency coefficients and high frequency coefficients that are processed by step 2 and 4 respectively. Then we can get the image that is wavelet enhanced [12,13].
6. Extract the edge image from the wavelet enhancement image using dilation and erosion type operator
Grad
3. The flat structuring element is 3*3 ([0 10; 1 1 1; 0 1 0]).
Fig.5 shows a flow chart representing the algorithm above.
Fig.5 flow chart of our method
IV.EXPERIMENT VERIFICATION A. Verification of Performance of Our Method
To verify the performance of our method, we choose a Quick-bird multispectral image with a resolution of 0.61 m. The experimental area contains various features and the size is 456*456 pixels. Fig.6 (a) is the original remote sensing image, Fig.6(b) is the wavelet enhancement image. Fig.6(c) is the result of using our method. Fig.6 (d),(e),(f) are the results of using traditional Sobel operator, Log operator and Canny operator respectively.
(a) (b)
laplansharpenin threshold de-noising and
inearenhancement
inverse wavelettransform
waveletenhancementimage
morphologyedgedetection
edgeimage remote sensing image
wavelet transform
(a) (b)
(c) (d)
(e) (f) Fig.6 Experimental results
To further certify the performance of our method, we choose another Quick-bird multispectral experimental area with the resolution of 0.8m. Similarly, Fig.7(a) is the original remote sensing image, Fig.7(b) is the wavelet enhancement image. Fig.7(c) is the result of using our method. Fig.7(d),(e),(f) are the results of using traditional Sobel operator, Log operator and Canny operator respectively.
(a) (b)
(c) (d)
(e) (f) Fig.7 Experimental results
From the two experimental results we can see that the detection results (Fig.6 (d), Fig.7 (d)) of using Sobel operator have less integrated edges and a high rate of miss detection. Compared with Fig.6(d) and Fig.7(d), the results of using Log operator(Fig.6(e) and Fig.7(e)) are better, but there still exist some miss detection. Although Fig.6 (f) and Fig.7 (f) have good integrity, there exist some false detection. The results of using our method (Fig.6(c) and Fig.7(c)) have the best detection performance and least rate of miss detection. By contrast, they can detect some weak edge information. The method proposed by the paper has the highest location rate, the best edge connection degree and the clearest details of edges.
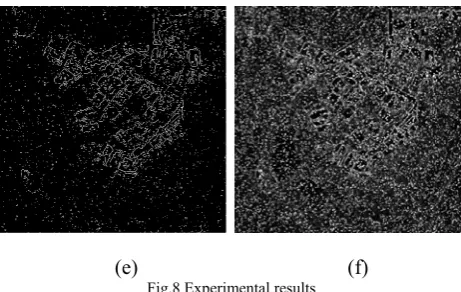
B. Verification of Anti-noise Property of Our Method To verify the anti-noise property of our method, we add salt-and-pepper noise with probability 0.05[15]. Fig.8
shows the results of the anti-noise property of our algorithm and some traditional algorithm. Fig.8 (a) is the image corrupted by salt-and-pepper noise with density 0.05. Fig.8 (b) is the result of extracting edge image from Fig.8 (a) by using our method. Fig.8(c), (d), (e) are the results of using Sobel, Log and Canny operator. Fig.8 (f) is the result of using morphological edge detection operator
Grad
3.(a) (b)
(e) (f) Fig.8 Experimental results
From the experimental results, we can clearly see that the results by using the traditional algorithms have been influenced by the noise by different degrees and have plenty of false detection, especially the method by using morphological edge detection operator
Grad
3(Fig.8 (f)). The results above show that our method has a good anti-noise property.C. Objective Evaluation of Our Method
The results above are all some subjective evaluation. The following we will give the objective evaluation of our method. The peak signal-to-noise ratio (PSNR) is usually used as a major quality assessment in the image processing system. Assume the size of an image is M*N, then PSNR can be expressed as[14]
2
1 1 2
1
[ ( , )
( , )]
255
10lg(
)
M N
i j
MSE
f i j
f i j
M
N
PSNR
MSE
= =′
=
−
×
=
∑∑
(17) where f i j′( , ) is the image after processing and
( , )
f i j is the original image.
The PSNR of different algorithms are shown in Table 1 as below:
TABLE 1. PSNR OF DIFFERENT METHODS
Experimental
figure Our method(dB) Sobel(dB) Log(dB) Canny(dB) Fig.6(a) 7.4936 5.0117 5.0211 5.023 Fig.7(a) 7.3737 5.1591 5.1623 5.1631 Fig.8(a) 7.5016 5.0214 5.0247 5.0266
From Table 1 we can learn that the PSNR value of our method is much higher than that of any other algorithms. It further proves our method has a good performance.
V.CONCLUSION
According to the basic features of high resolution remote sensing images, a novel edge detection algorithm based on wavelet enhancement and mathematical
morphology is presented. And some experiments were taken to validate it. The experimental results show that our method can achieve the better edge detection result and has a good anti-noise property. It is more suitable for high resolution remote sensing image edge detection. However, our method is only applicable to gray image, how to develop an algorithm that is available to color image is the focus of our future work.
REFERENCES
[1] C.Gonzalez, E.Woods, L. Eddins, “Digital image
processing using Matlab”, Publishing House of Electronics Industry. Beijing, 2011, pp.70-80. (in Chinese) [2] D Marr, E Hildreth., “Theory of edge detection”, In: proc
Roy Soc, London, 1980, pp.187-217.
[3] A. Panetta, J. Wharton, S. Agaian, “Logarithmic Edge Detection with Applications”, Journal of Computers, 2008,9(3), pp.11-19
[4] LI Hui,XIAO Peng-Feng,FENG Xue-Zhi,LIN
Jin-Tang, “Edge detection of high-resolution imagery by integrating spectral and scale characteristics”, Journal of Infrared and Millimeter Waves, 2012, 31(5),pp.469-474(in Chinese)
[5] Tyagi, Y, Runtambekar, T.A, Sexena, Preeti, Tanwani, Sanjay, “A Hybrid Approach to Edge Detection Using Ant Colony Optimization and Fuzzy Logic”, International Journal of Hybrid Information Technology, 2012, 5(1),pp.37-46.
[6] ZHU Chang-sheng,GUAN Jian,ZHOU Wei,HE
Dong-liang, “Parallel Feature Extraction for SAR Images Based
on Edge Detector”, Opto-Electronic
Engineering, 2010, 37(9),pp.44-50
[7] JIA Cheng-li, KUANG Gang-yao, “An Improved Edge Detection Algorithm for SAR Images”, Journal of Electronics & Information Technology, 2007, 29(2), pp.379-382.
[8] Donoho DL and Johnstone IM, “Adapting to unknown smoothness via wavelet shrinkage”, J. of American Statististic Assocciation, 1995,90(432),pp.1200-1224 [9] D.L.Donoho, I.M.Johnstone, “Ideal spatial adaptation by
wavelet shrinkage”, Biometrika, 1994,81(3),pp.425-455. [10]Yuanni Wang, Fei Ge, “Adaptive order morphology edge
detection”, Journal of Computers, 2012,4(7),pp.846-850 [11]Xun liu, Zhisheng You, “An Image Edge Detection
Method Based on Multi-Scale Morphology”, Opto-Electronic Engineering, 2003, 30(3),pp.56-58.( in Chinese) [12]GAO Li,LING Xiao-ming, “Color Edge Detection Based
on Mathematical Morphology in HSI Space”, Opto-Electronic Engineering, 2010, 37(4),pp.125-129.
[13]Hongjiu Tao, Jian Liu, Jinwen Tian, “Remote sense image edge detection based on wavelet transform and
mathematical morphology”, Infrared and Laser
Engineering, 2002, 31(2),pp. 154-157.( in Chinese) [14]S.D.Chen, and K.Z.Liu, “Color image edge features and
performance evaluation of face detection,” Journal of Software, 2005,8(5), pp.727-731.