Research Article
CODEN: IJPNL6
Antitumor activity of
Moringa Oleifera
leaf extract against Ehrlich solid tumor
Wagdy K. B. Khalil
†§, Inas S. Ghaly
†, Kawthar A. E. Diab
‡, Aida I. ELmakawy
††
Cell Biology Department,
§Center of Excellence for Advanced Sciences,
‡Genetics and
Cytology Department, National Research Centre, 12622 Dokki, Giza, Egypt
*Corresponding author e-mail:
[email protected]
ABSTRACT
Moringa oleifera Lam (Moringaceae) is promising plant for biomedicine applications because it has an impressive range of medicinal purposes with high nutritional value. Therefore, we investigated the therapeutic effect of
Moringa oleifera leaf extract (MOLE) on Ehrlich's solid tumor implanted mice (EST-mice). Swiss male albino mice were implanted intramuscularly with Ehrlich ascites carcinoma (EAC). Three doses of MOLE extract (125, 250 and 500mg kg-1) were administrated to EST-mice for 14 days. The standard drug vincristine (VCR) was i.p injected (0.1 mg kg1-) after the implantation of EST. The antitumor activity of MOLE was assessed using several tumor markers. Modulating activity of MOLE against EST was evaluated using comet assay, micronucleus test and morphological apoptotic changes as well as DNA fragmentation assay. The expression analysis of the inducible nitric oxide synthase (iNOS), vascular endothelial growth factor (VEGF) and apoptosis related genes (p53, p21 and bcl2) were evaluated. Treatment of EST-mice with the highest dose of MOLE exhibited inhibition of tumor growth and the tumor markers in solid tumor. MOLE inhibited the apoptotic/necrotic cells, decrease of micronucleus formation and DNA damage in EST-mice. Expression of iNOS, VEGF, p53 mutation, p21 and bcl2 genes in EST-mice were significantly over-expressed compared with control group. These observations were markedly inhibited with the highest dose of extract. Moringa oleifera leaf extract revealed antitumor, antigenotoxic and anticytotoxic activities in EST-mice. The biological activities of Moringa oleifera leaf extract were discussed.
Keywords: Moringa oleifera leaf extract, Ehrlich solid tumor, Micronucleus, Comet assay, Gene expression.
INTRODUCTION
Plants used in folk medicine have been considered an important source of molecules with pharmacological activity, including antitumor. Many studies have demonstrated that plants used in traditional medicine for treating cancer and tumors showed good pharmacological activity in vitro and/or in vivo
studies [1-4]. Moringa oleifera is an important tropical crop that is used in human nutrition, medicine and in oil production [5-7]. All parts of this plant are applied in traditional medicine for the treatment of human diseases such as asthma, spasm, enlarged liver and spleen, infection and nervous debility, ulcer, inflammation and for wound healing [8, 9]. The biological activities of this plant as hepatoprotective
[10]
, hypocholesterolemia [11], antifungal [12] and
anti-tumor [13] are documented. These biological activities
and others were reported using the leaf of the
Moringa oleifera [14- 16]. Ehrlich tumor is a transplantable neoplasia which corresponds to mammary adenocarcinoma in female mice. When implant intraperitoneally it grows as ascitic form and when implant subcutaneously it grows in the form of a solid tumor. This tumor has been used to develop a tumor model [17, 18]. Apoptosis a physiological process resulting in cellular self-destruction of unwanted cells. Apoptosis is accepted as the major mechanisms by which p53 suppress tumor formation
[19]. Bcl-2 family proteins determine whether a cell
lives or dies by controlling the release of mitochondrial apoptogenic factors (caspases) which are associated with death proteases [20]. The p53 gene is a tumor suppressor gene that acts as guardian of the genome. The p53 protein functions as a transcription factor, regulating downstream genes
International Journal of Pharmacy
involved in apoptosis. Loss of p53 function caused genomic instability, impaired apoptosis and diminished cell cycle restraint. Therefore, p53 mutations select for certain critical features of malignancy. Alteration of P53 is the most common mutation in human cancer [21].
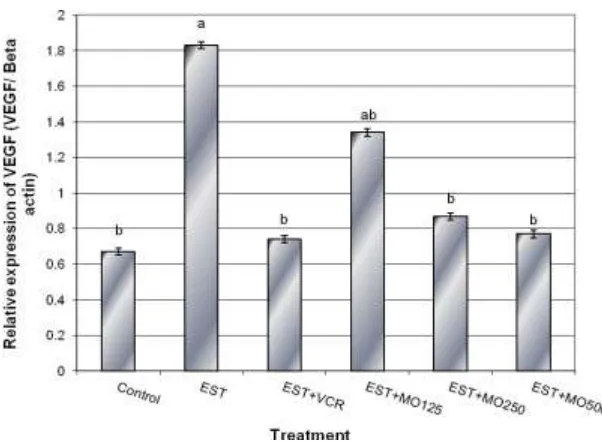
Apoptosis can be initiated by intracellular death signals that increase the level of p53, and also by extracellular signals mediated by bax/bcl–2, p21, myc, ras, and HER-2/neu complex [22-24]. Nitric oxide is a free radical that is generated in animals from L-arginine in a reaction catalyzed by nitric oxide synthase (NOS). This enzyme has four isoforms: (e-) endothelial, (n-) neuronal, (mit-) mitochondrial and (i-) induced [25, 26]. All the NOS isoforms were detected in tumor cells, and iNOS expression is correlated with malignancy grade and the degree of proliferation in breast cancer cells in humans [27, 28]. Increased vascularity may allow an increase in tumor growth and enhancement of hematogenous tumor embolization. Thus, inhibiting tumor angiogenesis may halt tumor growth and decrease the metastatic potential of tumors. The cytokine vascular endothelial growth factor (VEGF) is a key regulator of angiogenesis [29]. Among the numerous pathways contributing to the complex process of angiogenesis, the VEGF system is essential for both physiological and pathological angiogenesis [30]. Hence, the inhibition of VEGF expression by tumor cells has an impact on angiogenesis dependent tumor growth and metastasis.
Considering this, the present study was carried out to study the hypothesis that Moringa oleifera leaf extract have antitumor activity on mice bearing Ehrlich solid tumor (EST- mice) using tumor growth inhibition, apoptosis cells and DNA fragmentation assay in EST. In addition, the study was planned to evaluate potential protective activity of Moringa oleifera leaf extract against DNA damage induced in EST-mice using micronucleus and comet assay in bone marrow cells; DNA fragmentation and expression analysis of the iNOS, VEGF, and apoptosis related genes (p53, p21 and bcl2) in hepatocytes.
MATERIALS AND METHODS
Plant material: The leaves of Moringa oleifera
(MO) were collected from the farm of Egyptian Scientific Society of Moringa. The plant was identified by Prof. Dr. Aboelfetoh Mohammed Abdelalla, National Research Center; Giza, Egypt. The collected leaves was air-dried, powdered and kept for extraction.
Plant leaf extraction: Dry powdered Moringa
oleifera leaves (200 g) were extracted with 1L of 70% ethanol and shacked each 8 h by 24 h. After that the hydro-alcoholic extract was filtered using a cotton funnel and repeat four times. The extract was concentrated using a rotator evaporator under reduced pressure. The concentrated extracts were lyophilized and kept at -20°C.
Route of administration: The LD50 was found to be
more than 5000 mg kg-1 per oral in acute toxicity testing [31]. Based on this, three doses of 125, 250 and 500 mg kg-1 were selected in the current investigation. The doses of Moringa oleifera leaf extract were dissolved in DMSO and administrated by oral gavage (p.o).
Animals: Male Swiss albino mice were obtained
from National Research Center, Dokki, Giza, Egypt. The animals were maintained under standard environmental conditions and were fed with standard pellet diet and water ad libitum. The mice were housed in polypropylene cages containing paddy husk as bedding and were acclimatized to laboratory condition for 10 days before commencement of experiment. All procedure described were reviewed and approved by the Institutional Animal Ethical Committee of National Research Centre, Dokki, Giza, Egypt.
Experimental design
250 and EST+MOLE 500. At the end of treatment, the animals were sacrificed, and samples of solid tumor, bone marrow and hepatocytes were collected for different assays.
Tumor growth inhibition: The antitumor potential of MOLE was accessed by change in the tumor volume, and tumor growth inhibition rate. Tumor bearing thigh of each animal was shaved and longest and shortest diameters of the tumor were measured with the help of vernier caliper. The tumor volume of each animal was calculated as following formula: (length (mm) x width (mm) 2)/2.
The tumor-growth-inhibition ratio (I.R.) was calculated using the following formula:
I.R. (%) = (Average tumor volume of control -
Average tumor volume of treated group) x100 Average tumor volume of the control
Apoptosis analysis
Morphological study with fluorescence
microscope: Apoptotic changes in EST[33] and bone marrow cells[34] were determined morphologically by fluorescent microscope after labeling with acridine orange/Ethidium Bromide (AO/EB). Briefly, EST was washed in PBS, chopped finely and centrifuged at 7000 rpm for 5 min. The pellet obtained was suspended in trypsin-EDTA (0.25%, 53 mM) in PBS for 1 h at 37ºC and smeared on clean glass slides. Finally, ETS and bone marrow cells smears were air-dried and fixed in a solution of methanol/acetic acid (3:1). The slides were stained with AO/ EB mixture 25 μl of dye mixture (4μg/ml AO and 4μg/ml EB in PBS, pH 7.4). The cells were divided into four categories as follows: living cells with normal green nucleus, apoptotic cells with orange-stained nuclei and necrotic cells with red nuclei. In each group, a total of 100 cells were examined under fluorescent microscope using B2A filter and the apoptotic/necrotic ratio was calculated as number of apoptotic and necrotic cells /total cell count (× 100).
Detection of internucleosomal DNA fragmentation by electrophoresis: DNA was isolated from solid tumor and hepatocytes by phenol chloroform extraction method [35]. Briefly, frozen samples of liver were homogenized in lysis buffer containing 100 µg/ml DNase-free RNase and incubated at 37ºC for 90 min followed by incubation with proteinase K (200 µg ml-1) at 50ºC for 2 h. The DNA were extracted with phenol: chloroform: isoamyl alcohol (25:24:1) and once again with chloroform: isoamyl alcohol (24:1). DNA was precipitated with chilled alcohol and 0.3 M sodium acetate at 20ºC overnight. The precipitate was centrifuged at 15.000 rpm for 10 min. the DNA pellet was washed in 80% alcohol,
dried, dissolved in a mixture of TE and loading buffer, then, electrophoretically separated on a 1% agarose gel containing 1mg ml-1 ethidium bromide for 1.5 h at 100V. After electrophoresis gel was studied under gel doc system and was photographed.
DNA Damage Evaluation
Comet Assay: The comet assay was performed
according to the method developed by Singh[36], with a few modifications. Briefly, bone marrow cells were mixed with low-melting point agarose at a ratio of 1:10(v/v) and pipette onto normal-melting-point agarose precoated slides. Slides were maintained flat at 4°C in the dark for 30 min. Third layer of low-melting point agarose was pipette on the slides and allowed to solidify at 4°C for 30 min. Slides were then placed in pre-chilled lysis solution at 4°C for 60 min. Slides were then immersed in freshly prepared alkaline unwinding solution for 60 min at room in the dark. Slides were then placed in a horizontal electrophoresis tank and electrophoreses for 30 min at 0.8 V/cm, 300mAmps at 4°C. After electrophoresis, the slides were rinsed in neutralizing solution, immersed in 70% ethanol and air-dried. Slides were stained with ethidium bromide and visualized using Zeiss epifluorescence microscope (510–560 nm, barrier filter 590 nm) with a total magnification of ×400. 100 cells per animal were scored and analyzed using DNA damage analysis software (CometScore, TriTek corp., Sumerduck, VA22742).
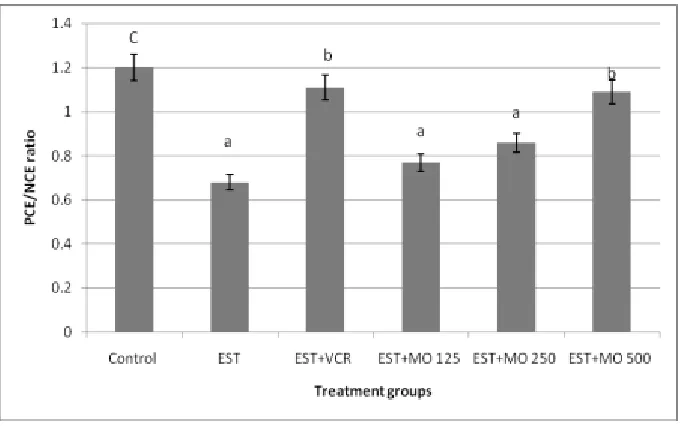
Micronucleus (MN) assay: The micronucleus assay was performed in the OECD guideline[37]. Briefly, the bone marrow was flushed from both femurs with fetal calf serum into a Microfuge tube using a 1ml syringe. Marrow was gently pulled up and down the syringe to prepare a uniform cell suspension. The smears were prepared and allowed to air dry, prior to fixation with methanol, and staining with May-Grunwald/Giemsa protocol. To evaluate the frequency of micronucleus, 2000 PCE per each mouse were analyzed for the presence of micronuclei by light microscopy. To evaluate the toxicity of bone marrow, the ratio of polychromatic erythrocytes to normochromatic erythrocytes (PCE/NCE) was calculated by counting a total of 500 erythrocytes.
Semi-quantitative RT-PCR:
DEPC-water. Purity of RNA was assessed by the 260/280 nm ratio (between 1.8 and 2.1). Additionally, integrity was confirmed with ethidium bromide-stain analysis of 28S and 18S bands by formaldehyde- agarose gel electrophoresis. Aliquots were used immediately for reverse transcription (RT).
Reverse transcription: Poly (A)+ RNA isolated from hepatocytes was reverse transcribed into cDNA in a total volume of 20 µl using RevertAidTM First Strand cDNA Synthesis Kit. An amount of total RNA (5µg) was used with a reaction mixture, termed as master mix (MM). The MM was consisted of MgCl2, 5x
reverse transcription buffer, dNTPs, oligo-dT primer, ribonuclease inhibitor and M- MuLV reverse transcriptase. The reverse transcription (RT) reaction was performed at 25 °C for 10 min, followed by 1 h at 42 °C, and the reaction was stopped by heating for 5 min at 99 °C. Afterwards the reaction tubes containing RT preparations were flash-cooled in an ice chamber until being used for DNA amplification through semi-quantitative real time-polymerase chain reaction(sqRT-PCR).
Semi-Quantitative Real Time-Polymerase Chain
Reaction (sqRT-PCR): QIAGEN's real-time PCR
cycler (Rotor-Gene Q, USA) was used to determine the cDNA copy number. PCR reactions were set up in 25 L reaction mixtures containing 12.5 L 1× SYBR® Premix Ex TaqTM, 0.5 L 0.2 M sense primer, 0.5 L 0.2 M antisense primer, 6.5 L distilled water, and 5 L of cDNA template. At the end of each sqRT-PCR a melting curve analysis was performed at 95.0°C to check the quality of the used primers. Each experiment included a distilled water control.
The semi quantitative values of RT-PCR (sqRT-PCR) of iNOS (iNOS-F: 5′-cac ctt gga gtt cac cca gt-3′, iNOS-R: 5′-acc act cgt act tgg gat gc-gt-3′, NCBI: NM-010927.3); VEGF (VEGF-F: 5′-gct ctc cac gat ttg acc at3′, VEGFR: 5′ atc cac cca cta ggc aac ag -3′, NCBI: NM-001110268.1); p53 mutation (p53-F: 5′- GCG GTA CCC CAG GTC GGC GAG AAT CC-3′, p53-R: 5′- GGG CTC GAG TCT AGA CTT TTG AGA AGC-3′, Qin et al [38] ; p21 (p21-F: 5′-ACC TCT CAG GGC CGA AAA C-3′, p21-R: 5′- TAG GGC TTC CTC TTG GAG AA-3′, Rasmy et al[39] and Bcl2 (Bcl2-F: 5′- CTC AGT CAT CCA CAG
GGC GA-3′, Bcl2-R: 5′-AGA GGG GCT ACG AGT
GGG AT-3′, Khalil and Booles [40] genes were normalized on the bases of -actin (-actin-F: 5′-CAC GTG GGC CGC TCT AGG 5′-CAC CAA -3′, -actin-R: 5′- CTC TTT GAT GTC ACG CAC GAT TTC -3′, Khalil and Booles [40] expression.
Calculation of Gene Expression: First the
amplification efficiency (Ef) was calculated from the slope of the standard curve using the following formulae (Bio-Rad 2006):
Ef = 10-1/slope Efficiency (%) = (Ef – 1) x 100
The relative quantification of the target to the reference was determined by using the ΔCT method if Ef for the target (iNOS, VEGF, p53, p21 and bcl2) and the reference primers (β-Actin) are the same (Bio-Rad 2006):
Ratio (reference/ target gene) = EfCT(reference) – CT(target)
Statistical analysis: The data were expressed as means ± SE. Differences between the groups were determined by one-way Analysis of Variance (ANOVA) using the SPSS (Version 11.0; SPSS, Chicago, IL, USA). The level of statistical significance was set at P≤0.05. The comparisons among the groups were performed using Duncan’s multiple range tests. Furthermore, gene expression data were analyzed using the General Liner Models (GLM) procedure of Statistical Analysis System (SAS) followed by Scheffé-test to assess significant differences between groups.
RESULTS
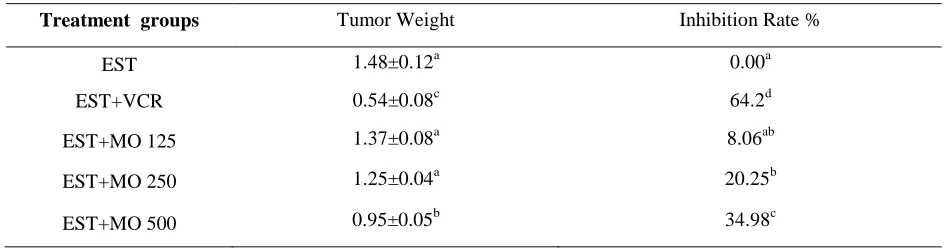
Tumor growth Inhibition: Table (1) summarizes
the results of administration of Moringa oleifera leaf extract on solid tumor volume of EST inoculated in male mice. The tumor volume mean were significantly decreased by VCR drug and Moringa oleifera leaf extract (at the doses 250 and 500mg kg-1 b.w). However, the dose 125mg kg-1 was ineffective in decreasing the tumor volume. Moringa oleifera
leaf exhibited dose dependent manner in tumor growth inhibition. Moringa oleifera leaf extract at the doses 250 and 500 mg kg-1 achieved 20.25 and 34.4 % tumor growth inhibition, whereas, the dose of 125 mg kg-1 achieved 8.06 % tumor growth inhibition. The maximal value of tumor growth inhibition was 64.2 % that achieved with VCR.
Detection of Apoptosis in Ehrlich Solid Tumors and Bone Marrow Cells
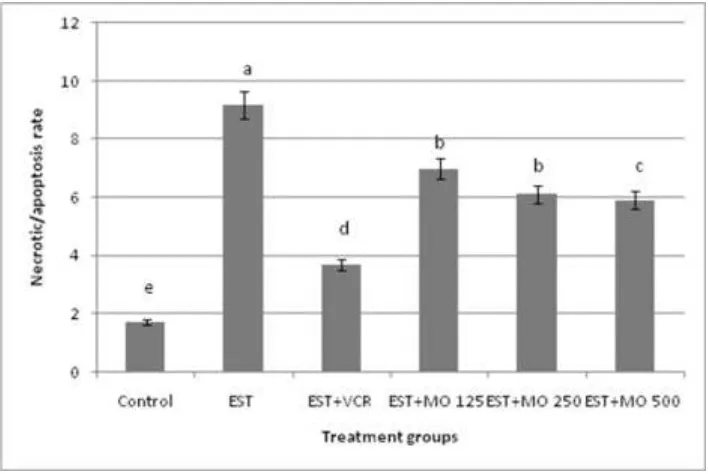
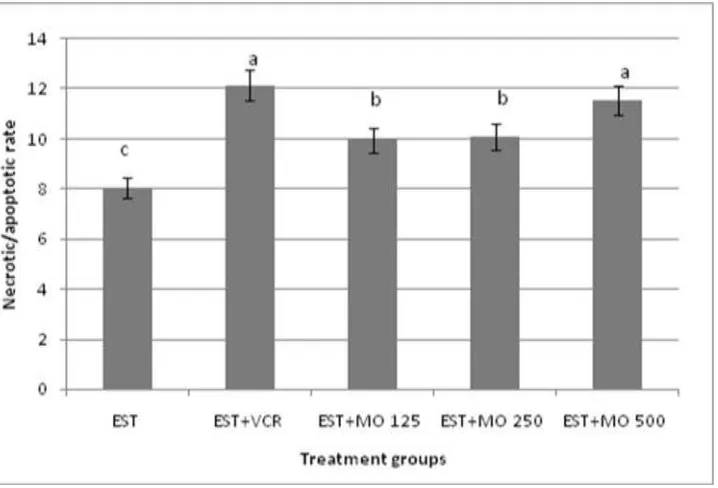
Morphological study with fluorescence microscope: To evaluate the type of cell death induced by
significantly increased the apoptotic cells percentage in solid tumor of EST- mice. This result indicated that Moringa oleifera leaf extract and VCR kill solid tumor cells by induction of apoptosis compared to control group. In bone marrow cells (Fig 2), EST- mice induced an increase in necrosis / apoptotic ratio in bone marrow cells compared with negative control. However, treatment with different doses of
Moringa oleifera leaf extract caused dose dependent reduction in the necrosis/apoptotic ratio compared with the EST-mice. No significant differences were observed in necrosis/apoptosis value between the groups of VCR and Moringa oleifera leaf extract high dose.
Detection of internucleosomal DNA fragmentation: To assess the efficiency of MOLE leaves extract in induction the necrosis or apoptosis which associated with the internucleosomal DNA fragmentation in solid tumor and hepatocytes of EST- mice, the quality of extracted DNA was investigated on the agarose gel. Genomic DNA isolated from solid tumor of EST-mice treated with VCR or with the high dose of MOLE exhibited DNA bands separated by multiple of ~200bp which are considered to be biochemical markers of apoptotic cells (Fig 3). These results are compatible with the results of morphological observations. However, DNA isolated from hepatocytes treated with VCR or different doses of MOLE displayed a smear typical of non-specific degradation i.e necrosis.
DNA Damage detected by Comet assay: The
results obtained in the comet assay after treatment of mice bearing EST with different doses of MOLE are presented in Table (2). Computed parameters include primary and derived measurements of comet images. Primary measurements are obtained from primary densitometry analysis of the comet images (DNA profile across the comet) including (1) comet length, (2) tail length measured from the centre of the head to the end of the tail, (3) percentage of DNA in tail, (4) %DNA in head. While, derived measurements are obtained from geometric analysis of the comet image including tail moment (% tail DNA×tail length) and olive moment (% Tail DNA×Tail moment length). All these parameter were used as an indicator for DNA damage in mice bearing EST bone marrow cells. The current findings exhibited dramatic increase in DNA damage in bone marrow cells of EST-mice compared with untreated control. On the other hand, MOLE induced dose dependent decrease in all parameters of DNA damage as compared with their corresponding values to group bearing EST. As shown in Fig 4, relatively undamaged cells give comets consisting of a compact head with or without
very short tail, indicating double-stranded DNA. Comets originating from damaged cells have a distinct head with a tail.
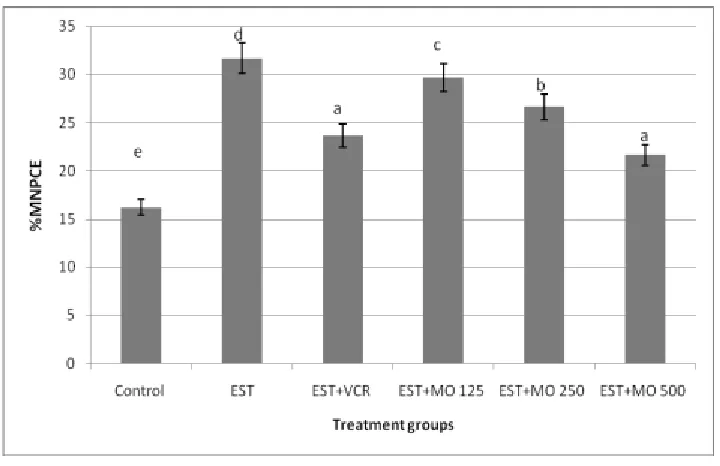
Micronucleus assessment: Dramatic increase in the frequency of MNPCE in bone marrow cells was observed in mice implanted EST compared with the control group (Fig. 6). This finding indicated that EST had potential effect to induce DNA damage in bone marrow cells. Treatment mice inoculation EST with different doses of Moringa oleifera leaf extract result a reduction in the occurrence of MNPCE. Such reduction reached its maximum decline after treatment with the highest dose of Moringa oleifera
leaf extract. This finding implies that the increasing dosages of Moringa oleifera leaf extract afforded significant moderating against genotoxicity induced by EST. Insignificant reduction in the occurrence of MNPCE was observed after treatment mice bearing EST with VCR compared with the highest dose of
Moringa oleifera leaf extract leaves extract (Fig. 6).
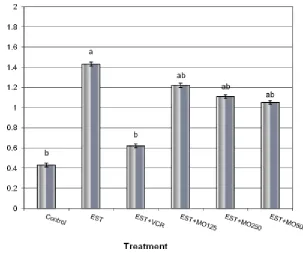
and bcl2) in the hepatocytes of EST- mice compared with those in mice bearing EST (Figures 10-11, respectively).
DISCUSSION
Moringa oleifera Phytochemical properties play an important role in its mode of action against diseases[41]. In the present investigation, the antiproliferative activity of Moringa oleifera leaf extract was estimated by determining its ability to reduce tumor growth and induce apoptosis in solid tumor of EST-mice. An in vivo study on the anticancer activity of Moringa oleifera leaf extract on B16 F10 melanoma tumors in mice revealed that treatment at 500 mg kg-1bw could delay tumor growth[42]. The anticancer activity was attributed to the phytochemicals quercetin, niazimicin and niaziminin[43]. Moringa oleifera leaf extracts have been shown to disrupt proliferation of cancer cells [44] and induced apoptosis in ovarian cancer cells [45], KB carcinoma cells[46] and A549 lung cells [47]. Antiproliferative effect of Moringa oleifera extract may be due to the phytochemicals (e.g., isothiocyanates, niazimicin, niaziminin and quercetin) in the plant leaves [47].Our results showed that Moringa oleifera leaf extract produced a significant reduction of tumor volume and increase the incidence of apoptosis/necrosis in a dose-dependent manner. To confirm the apoptotic action of Moringa oleifera leaf extract DNA agarose gel electrophoresis followed by AO/EB staining was conducted to discriminate between apoptotic, internucleosomal DNA fragmentation which resulting in the so-called DNA ladder. Internucleosomal DNA fragmentation are represented by DNA fragments of 180 bp and multiples thereof (360, 540, etc) and necrotic, nonspecific DNA degradation resulting in a smear of randomly degraded DNA [48]. In the present study,
Moringa oleifera leaf extract at the dose 125 and 250 mg kg-1 exhibited degradation of EST-mice genomic DNA, which was visible as DNA smear that is hallmark of necrosis. However, 500 mg kg-1Moringa oleifera leaf extract exhibited internucleosomal DNA fragmentation into a 200 bp ladder which is considered a biochemical hallmark of apoptosis. These results indicated that MOLE exerts in vivo
antitumor activity through cytostatic and cytotoxic effect. Indeed, cell division was active in the solid tumor group than in the groups of Moringa oleifera
leaf extract, a fact probably due to the blocking of the progression of the cell cycle and possibly associated to the activation of the P21 gene which together with the inactivation of the bcl-2, induce to apoptosis[49]. Similar results revealed that MOLE exhibited in vitro
antitumor activity against human liver cancer cell[50], leukemia [51] and human tumor (KB) cell line[52].
Additional objective of the present study is assessment of the antigenotoxic activity of Moringa oleifera leaf extract against DNA damage induced by EST model. Many cancer chemopreventive agents possess antioxidant potential due to their bioactive phytochemicals that may play a vital role in protecting the cell from oxidative stress [53]. Moreover, the effectiveness of potential antioxidants in tumor treatment may depend on the nature of the antioxidant, the type and stage of cancer being treated[54, 55]. Quantitative analysis of comet assay and micronucleus test showed high degree of DNA damage in bone marrow cells of EST-mice. These findings imply that EST caused loss in chromatin as results of a damage to either chromosome structure (fragmentation) or dysfunction of the spindle apparatus or centromere kinetochore complexes [56]. Significant reduction in all parameters of DNA damage was observed after treatment with VCR and the two highest doses of Moringa oleifera leaf extract. Sathya et al.[57] showed that M. oleifera leaf ethanolic extract have a dose dependent modulatory effect on CP-induced DNA damage. The protective effect may be attributed to the potential involvement of the phytomolecules of the extract to interfere with the enzymes participating in the biotransformation of CP to cytotoxic metabolites.
One of our prominent finding is that a decrease in the expression levels of apoptosis related genes (p53 mutation, p21 and bcl2) due to supplementation with
VEGF genes to the values approximating these observed in normal cells. Nitric oxide participates not only in gene expression regulation, especially those transcription factors[67], but it also participates in the process of nitrosylation of cysteine, glutathione (GSH) and proteins [68, 69]. The chemotactic effects of VEGF-A are mediated through binding of VEGF receptor 2 (VEGFR2) and stimulation of a signaling pathway involving phosphatidyl inositol-3-kinase (PI3K), Akt, and activation of eNOS and nitric oxide (NO) formation[70, 71]. Langston[72] suggested that VEGF induces angiogenesis and eNOS activity via modulation of intracellular GSH status. Therefore, the role of Moringa oleifera leaf extract in decreasing the tumor activity through down-regulation the expression of apoptosis related genes (p53 mutation, p21 and bcl2) as well as iNOS and VEGF genes in the current study may be attributed to increase the antioxidant enzymes activity and/or regulation the intracellular calcium.
Based on our findings, it was clear that, tumor cells are capable to generation of DNA damage inducing-singles. There are several possible explanations by which the presence of a tumor may lead to elevated levels of DNA damage in distant tissues. The tumors were found to be infiltrated with matured macrophages and lymphocytes which could be activated by contact with the tumor cells to secrete substances in various tissues that induce DNA damage[73]. In addition, the tumor cells themselves are known to be capable of secreting a variety of
cytokines and other factors such as ROS which may also activate resident or distant immune cells that move throughout the body and secretes substance in various tissues and induce DNA damage are responsible for the distant DNA damage[74].
The mechanism of action of Moringa Oleifera leaf extract is unclear and, possibly, multiple compounds in the extract are involved. The preliminary phytochemical profile of MO indicated presence of various phytochemicals like carotenoids, vitamins, minerals, glycosides, alkaloids, flavonoids, moringine, moringinine, and polyphenols [75, 5]. These compounds are known to exhibit strong antioxidant activities which help in radical scavenging and prevention of oxidative cell damage[57, 76]. The extract could have exerted its actions by some unknown mechanism either alone or in combination. The crude extract has compounds that would work synergistically and thus result in weaker anti-carcinogenic activity when separated than when used together in the intact crude extract.
Basically, there are two main groups of protective mechanisms for DNA, desmutagenic and bio-antimutagenic according to mode of action. Desmutagenesis could be detected with pre-treatment, while bio-antimutagenicity could be better detected with post-treatment[77]. According to our results, Moringa oleifera leaf extract exerts its ability to reduce the DNA damage induced by EST suggesting act as bio-antimutagenic agents.
Table (1): Antitumor activity of Moringa oleifera leaves extract against Ehrlich solid tumor mice model
Treatment groups Tumor Weight Inhibition Rate %
EST 1.48±0.12a 0.00a
EST+VCR 0.54±0.08c 64.2d
EST+MO 125 1.37±0.08a 8.06ab
EST+MO 250 1.25±0.04a 20.25b
EST+MO 500 0.95±0.05b 34.98c
Values followed by different superscript letters are significantly different from one another within the same columns
Table (2): Assessment of DNA damage by comet assay in mouse bone marrow cells after exposure mice bearing
Ehrlich solid tumor to Moringa oleifera leaves extract
Treatment groups Comet Length (µm)
%DNA in
Head
Tail Length
(µm) %DNA in Tail Tail Moment Olive Moment
Control 130.0±4.14d 93.5±0 .50c 1.5±0.54c 6.5±0.50d 1.3 ±0.21c 1.2 ± 0.12d
EST 194.8±5.93a 71.9 ±0.96c 48.3 ±2.97a 28.1±0.96a 10.1±0.85a 11.7±0.61a
EST+VCR 181.8±6.66a 83.6±0.96 a 27.2±2.50 b 16.4±0.96c 4.1±0.56 b 5.5±0.48c
EST+MO125 190.1±5.42 a 73.0 ±1.05c 43.1±2.69a 27.0±1.04a 8.5±0.78a 10.0±0.54b
EST+MO250 142.1±3.61b 78.7±1.16b 25.6±4.19b 21.3±1.16b 4.4±0.49 b 5.1±0.36c
EST+MO500 17.9±4.23c 82.3±1.06 a 20.2±1.54 b 17.7±1.06c 3.4±0.34b 4.2±0.33c
Data expressed as mean%±SE. Values followed by different superscript letters are significantly different from one another
within the same columns (p≤0.05).
Figure (2): Induction of necrotic/apoptotic rate by Moringa oleifera leaf extract in bone marrow cells of EST-mice model. Data expressed as mean ±SE. Means with different letters are significantly different from one another
(p≤0.05).
Figure (3). Agarose gel electrophoresis of DNA extracted from solid tumor of EST-mice after exposure to different
Figure (4). Fluorescence photomicrographs of bone marrow cells showing undamaged and damaged nuclei:
A) nuclei without damage; B) moderated damage; C) highly damaged nucleus (hedgehog appearance).
Figure (5). Evaluation of DNA damage by induction of MNPCE in bone marrow cells of mice after exposure EST-
Figure (6). Effect of Moringa oleifera leaf extract on the PCE/NCE ratio in the bone marrow of EST-mice model. Data expressed as mean mean ± SE. Means with different letters are significantly different from one another (p≤
0.05).
Figure (7). Effect of different doses of Moringa oleifera leaf extract on the expression of iNOS gene in hepatocytes of EST- mice using semi-quantitative Real Time-PCR analysis. Means with different letters, within tissue, differ
Figure (8). Effect of different doses of Moringa oleifera leaf extract on the expression of VEGF gene in hepatocytes of EST- mice using semi-quantitative Real Time-PCR analysis. Means with different letters, within tissue, differ
significantly (P ≤ 0.05). VC: vincrystine.
Figure (9). Effect of different doses of Moringa oleifera leaf extract on the expression of p53 gene in hepatocytes of EST using semi-quantitative Real Time-PCR analysis. Means with different letters, within tissue, differ significantly
Figure (10). Effect of different doses of Moringa oleifera leaf extract on the expression of p21 gene in hepatocytes of EST-mice using semi-quantitative Real Time-PCR analysis. Means with different letters, within tissue, differ
significantly (P ≤ 0.05).
Figure (11). Effect of different doses of Moringa oleifera leaf extract on the expression of Bcl2 gene in hepatocytes tissues of EST-mice using semi-quantitative Real Time-PCR analysis. Means with different letters, within tissue,
REFERENCES:
1. Ashidi JS, Houghton PJ, Hylands PJ, Efferth T. J Ethnopharmacol, 2010; 128: 501-512.
2. Yang SF, Chu SC, Liu SJ, Chen YC, Chang YZ, Hsieh YS. J Ethnopharmacol, 2007; 110: 483-489.
3. Itharat A, Houghton PJ, Eno-Amooquaye E, Burke PJ, Sampson JH, Raman A. J Ethnopharmacol, 2004; 90: 33-38.
4. Liu RH. J Nutr, 2004; 134: 3479S– 3485S.
5. Anwar F, Ashraf M, Bhanger MI. J Am Oil Chem Soc, 2005; 82: 45-51.
6. Soliva CR, Kreuzer M, Foidl N, Foidl G, Machmüller A, Hess HD. Anim Feed Sci Technol, 2005; 118: 47-62. 7. Hamza AA. Food Chem Toxicol, 2010; 48: 345-355.
8. Mishra G, Singh P, Verma R, Kumar S, Srivastav SK, Jha K, Khosa RL. Der Phamacia Lett, 2011; 3: 141-164. 9. Promkum C, Kupradinun P, Tuntipopipat S, Butryee C. Asian Pac J Cancer Prev, 2010; 11: 627-632.
10. Pari L, Kumar NA. J Med Food, 2002; 5: 171-177.
11. Mehta K, Balaraman R, Amin AH, Bafna PA, Gulati OD. J Ethnopharmacol, 2003; 86: 191-195. 12. Chuang PH, Lee CW, Chou JY, Murugan M, Shieh BJ, Chen HM. Biores Technol, 2007; 98: 232-236. 13. Bharali R, Tabassum J, Azad MRH. Asian Pac J Cancer Prevent, 2003; 4: 131-139.
14. Chumark P, Khunawat P, Sanvarinda Y, Phornchirasilp S, Morales NP, Phivthongngam L, Ratanachamnong P, Srisawat S, Pongrapeeporn KS. J Ethnopharmacol, 2008; 116: 439-446.
15. Iqbal S, Bhanger MI. J Food Compost Anal, 2006; 19: 544–551.
16. Jaiswal D, Kumar Rai P, Kumar A, Mehta S, Watal G. J Ethnopharmacol, 2009; 123, 392–396. 17. Silva LA, Nascimento KA, Maciel MC, Pinheiro MT, Sousa PR, Ferreira SC, Azevedo AP, Guerra RN, Nascimento FR. Chemotherapy, 2006; 52: 91-94.
18. Sakai M, Ferraz-de-Paula V, Pinheiro ML, Ribeiro A, Quinteiro-Filho WM, Rone MB, Martinez-Arguelles DB, Dagli ML, Papadopoulos V, Palermo-Neto J. Eur J Pharmacol, 2010; 626: 131–138.
19. Wyllie AH. Br Med Bull, 1997; 53: 451-465.
20. Oltval ZN, Milliman CL, Korsmeyer SJ. Cell, 1993; 74: 609-619.
21. Smith ND, Rubenstein JN, Eggener SE, Kozlowski JM. J Urol, 2003; 169: 1219-1228. 22. Skirnisdottir I, Sorbe B, Seidal T. Int J Gynecol Cancer, 2001; 11: 147-158.
23. Fauvet R, Dufornet C, Poncelet C, Uzan C, Hugol D, Darai E. J Surg Oncol, 2005; 92: 337–343. 24. Kim DJ, Lee MH, Park TI, Bae HI. J Korean Med Sci, 2006; 21: 81–85.
25. Delledonne M, Xia YJ, Nixon RA, Lamb C. Nature, 1998; 394: 585-588. 26. Crawford NM, Guo FQ. Trends Plant Sci, 2005; 10: 195-200.
27. Lind DS. J Nutr, 2004; 134: 2837S-2841S.
28. Porembska Z, Nyckowski P, Skwarek A, Mielczanek M, Barańczyk-Kuźma A. Pol Merkuriusz Lek, 2002; 13: 286-288.
29. Ferrara N. Arterioscler Thromb Vasc Biol, 2009; 29: 789-791.
30. Gaur P, Bose D, Samuel S, Ellis LM. Semin Oncol, 2009; 36: 2 Suppl 1, S12-19. 31. Rathi BS, Bodhankar SL, Baheti AM. IJEB, 2006; 44: 898-901.
32. Unger E. Strahlenther Onkol, 1987; 163: 803-806.
33. Thakur P, Sanyal SN. Am J Biomed Sci, 2010; 2: 275-288.
34. Nyati KM, Feng YF, Kanade VD, Nayak R. Mol Imaging, 2006; 5.
35. Sambrook J, Fritsch EF, Maniatis T. 2nd ed., Cold Spring Harber Laboratory Press, Cold Spring Harber; New York: 1998; P. 192
36. Singh NP, McCoy MT, Tice RR, Scheneider EL. Exp Cell Res, 1988; 175: 184-191. 37. OECD. OECD, Paris, France, 1997; pp: 1–10.
38. Qin C, Nguyen T, Stewart J, Samudio I, Burghardt R, Safe S. Mol Endocrinol, 2002; 16: 1793-1809. 39. Rasmy GE, Khalil WKB, Moharib SA, Ahmed KA, Jwanny EE. Grasas y Aceites, 2011; 62: 253-267. 40. Khalil WKB, Booles HF. Arh Hig Rada Toksikol, 2011; 62: 121-129.
41. Fahey JW. Trees Life J, 2005; 1-5.
42. Purwal L, Pathak AK, Jain UK. Pharma, 2010; 1:655-665.
43. Adedapo AA, Mogbojuri OM, Emikpe BO. J Med Plants Res, 2009; 3:585-591. 44. Goyal BR, Agrawal BB, Goyal RK, Mehta AA. Nat Prod Rad, 2007; 6:347-353. 45. Kalkunte S, Swamy N, Dizon DS, Brard L.J Exp Ther Oncol, 2006; 5(4):287-300. 46. Phulukdaree A, Moodley D, Chuturgoon AA. S Afri J Sci, 2010; 106:1–5.
48. Galluzzi L, Aaronson SA, Abrams J, Alnemri ES, Andrews DW, Baehrecke EH, Bazan NG, Blagosklonny MV, Blomgren K, Borner C, et al. Cell Death Differ, 2009; 16(8): 1093-10107.
49. Costa-Lotufo LV, Khan MT, Ather A, Wilke DV, Jimenez PC, Pessoa C, de Moraes, ME, de Moraes MO. J Ethnopharmacol 2005; 99(1): 21-30.
50. Waiyaput W, Payungporn S, Issara-Amphorn J, Panjaworayan NT. BMC Complement Altern Med, 2012; 12: 246.
51. Khalafalla MM, Abdellatef E, Dafalla HM, Nassrallah AA, Aboul-Enein KM, Lightfoot DA, Deeb FE, El-Shemy HA. Afr J Biotechnol, 2010; 9: 8467-8471.
52. Sreelatha S, Jeyachitra A, Padma PR. Food Chem Toxicol, 2011; 49(6): 1270-1275. 53. Ozben T. J Pharm Sci, 2007; 96(9): 2181-2196.
54. Akbas HS, Timur M, Ozben T. Expert Rev Clin Immunol, 2006; 2(6): 931-939. 55. Borek C. Integr Cancer Ther, 2004; 3(4): 333-41.
56. Fenech M. Mutat Res, 2000; 455: 81-95.
57. Sathya TN, Aadarsh P, Deepa V, Balakrishna Murthy P. Int J Phytomed, 2010; 2: 147-154. 58. Abo-Elwafa HA, Attia FM, Sharaf AEA. Diagn Pathol, 2011; 6: 58.
59. Barısık NO, Keser SH, Gul AE, Sensu S, Kandemir NO, Kucuk HF, Gumus M, Karaday N. Med Oncol, 2011; 28: 703-708.
60. Reed JC, Cuddy M, Haldar S, Croce C, Nowell P, Makover D, Bradley K. Proc NatI Acad Sci USA, 1990; 87: 3660-3664.
61. Reed JC. J Cell Biol, 1994; 124: 1-6.
62. Thompson CB. Science, 1995; 267: 1456-1462.
63. Shimizu S, Eguchi Y, Kosaka H, Kamiike W, Matsuda H, Tsujimoto Y. Nature, 1995; 374: 811-813. 64. Jacobson MD, Raff MC. Natur, 1995; 374: 814-816.
65. Distelhorst CW, Lam M, Mc Cormick TS. Oncogene, 1996; 12: 2051-2055.
66. Marin MC, Fernandez A, Bick RJ, Brisbay S, Buja LM, Snuggs M, et al. Oncogene, 1996; 12: 2259-2266. 67. Kruncke KD, Carlberg C. FASEB J, 2000; 14: 166-173.
68. Kruncke KD. FASEB J, 2001; 15: 2503-2507.
69. Lindermayr C, Saalbach G, Durner J. Plant Physiol, 2005; 137: 921-930. 70. Zeng H, Dvorak HF, Mukhopadhyay D. J Biol Chem, 2001; 276: 26969- 26979. 71. Dimmeler S, Dernbach E, Zeiher AM. FEBS Lett, 2000; 477: 258–262.
72. Langston W, Chidlow JH Jr, Booth BA, Barlow SC, Lefer DJ, Patel RP, Kevil CG. Free Radic Biol Med, 2007; 42: 720-729.
73. Redon CE, Dickey JS, Nakamura AJ, Kareva IG, Naf D, Nowsheen S, et al. PNAS, 2010; 107(42): 17992-17997.
74. Novakova Z, Hubackova S, Kosar M, Janderova-Rossmeislova L, Dobrovolna J, Vasicova P, et al. Oncogene, 2010; 29(2): 273-84.