Research Article
CODEN: IJPNL6
MODULATION OF NITRIC OXIDE SYNTHASE AND SUPEROXIDE DISMUTASE
GENE EXPRESSION BY ALTERED THYROID LEVELS IN ADULT RAT BRAIN
Mariam G. Eshak
1and Wafaa A. Hassan
21
Cell Biology Department, National Research Center, Dokki, Giza, Egypt
2
Hormone Department, National Organization for Drug Control and Research (NODCAR),
Giza, Egypt
*Corresponding author e-mail:
[email protected]
ABSTRACT
The effects of altered thyroid hormones level (through induction of Hypothyroidism or Hyperthyroidism) on oxidative stress and antioxidant biomarkers as well as on gene expression of neuronal nitric oxide synthase and superoxide dismutase of adult male rat brain were studied. Hypothyroidism was induced by daily intraperitoneal (i.p.) injection of propylthiouracil (PTU, 10 mg/kg body weight) for 4 weeks. Hyperthyroidism was elicited by daily i.p. injection of L-thyroxine (L-T4, 300 µg/kg body weight) for 3 weeks. In hypo- or hyperthyroid rats, significant
increases in malondialdehyde and nitric oxide concentrations associated with significant decreases in reduced glutathione content, superoxide dismutase and catalase activities were recorded compared to the controls. Activity of glutathione peroxidase was increased in hypo- and hyperthyroid rats compared to control rats. Augmentation in the gene expression of neuronal nitric oxide synthase and decline in the gene expression of superoxide dismutase was observed in both hypo- and hyperthyroid rat brain. DNA damage of brain was higher in the two thyroid hormone states compared to the control groups. The random amplified polymorphic DNA- polymerase chain reaction (RAPD-PCR) analysis indicated the presence of 48 % new bands (polymorphic) in hypothyroid (PTU) and hyperthyroid (L-T4) treated brain samples and the absence of such bands in the control groups. Marked
histopathological alterations were also observed in brain sections of either hypo- or hyperthyroid rats. These results provide evidence that the changes in the oxidative stress and antioxidant status in altered thyroid hormone levels are exerted through modulation of neuronal nitric oxide synthase and superoxide dismutase gene expression in adult rat brain.
Keywords: Propylthiouracil, L-thyroxine, Oxidative stress, Antioxidant enzymes, gene expression, DNA
fingerprinting.
INTRODUCTION
Thyroid hormones have been shown to play crucial roles in the development and physiological functioning of the central nervous system (CNS), not only during brain maturation but also in adult vertebrate brain [1 -6]. Disorder of the thyroid states during later life appears to contribute to a variety of CNS-related pathologies [7]. Various studies have established definite role of thyroid hormone in adult brain such as neurogenesis [8, 9], expression of genes
[10, 11] and phosphorylation of calmodulin dependent
synaptosomal protein [12]. Several reports also suggest that adult-onset thyroid dysfunction is associated with both neurological and behavior abnormalities [13,
14], emphasizing the importance of thyroid hormones
for normal brain function. Thyroid hormone receptors (TR) are widely expressed in the adult brain, and particularly the TRα1 isoform that has been implicated in the control of pathways regulating behavior [15]. Although the mechanisms involved in cell injury is still unknown, it has been suggested that
International Journal of Pharmacy
oxidative stress may participate, as thyroid hormone influences mitochondrial activity [16]. The clinical symptoms manifested in the patients during thyroid dysfunction could be attributed to the oxidative stress-induced changes at the cellular level [17]. Studies conducted in rat models have also demonstrated an increase in free radical production and lipid peroxide levels during experimental hypo- and hyperthyroidism in adult brain [18 – 21].
The genomic effect of thyroid hormone has been also identified in cell injury. Thyroid hormone influences gene expression, either positively or negatively, by binding to nuclear thyroid hormone receptors that are associated with important biological functions. Among the processes triggered by nuclear hormone receptor it is worth mentioning protein expression during the development of the CNS [22], expression of sarcoplasmic endoplasmatic reticulum Ca2+-ATPase 1 in heart [23], and Bcl2 family genes [24]. The brain pocesses a great amount of oxygen per unit tissue mass as it consume 20% of the entire oxygen consumed by the body although its weight is only 2% of the total body weight [25]. Most of the oxygen consumed by cells is tetravalently reduced to water during mitochondrial respiration. Nevertheless, about 1-2 % of the total oxygen consumed by the mitochondria during respiration is incomplete and is one of the major sources for the production of superoxide radicals in cells. If superoxide radicals are not neutralized immediately, they in turn produce hydroxyl radicals by reacting with hydrogen peroxid in the presence of free iron by classical Fenton reaction [26]. Superoxide and hydroxyl radicals along with non-radical oxygen species hydrogen peroxide are commonly known as reactive oxygen species (ROS). If ROS are not quickly disposed of from cellular environment, they can push cells to oxidative stress situation by attacking almost all biomolecules in their vicinity including membrane lipids [26]. Nevertheless, cellular system has evolved efficient mechanisms, both enzymatic as well as non-enzymatic, to counteract ROS. The enzymatic antioxidants comprise superoxide dismutase (SOD), glutathione peroxidase (GPx), glutathione reductase (GR) and catalase (CAT). Non-enzymatic small molecules that act as antioxidants include vitamin E and C, glutathione (GSH), thiol groups (SH) and coenzyme Q [26].
Another important molecule involved in the oxidative pathway inducing cell damage is nitric oxide (NO). Under pathological conditions, NO may promote oxidative damage, through the formation of the highly reactive metabolite peroxynitrite. The NO is synthetized from L-arginine by the nitric oxide
synthase (NOS) [27]. In the CNS, the neuronal nitric oxide synthase (nNOS) was confined to discrete neurons, with predominant localization in the cerebellar cortex, basal ganglia, hypothalamus and hippocampus [27]. There are only limited number of studies dealing with the possible interaction between thyroid hormone and NO signaling in the nervous system [20, 28, 29, 30].
One of the major effects of thyroid hormones is to increase mitochondrial respiration which results in increased generation of ROS [16]. Of great interest is that the rates of mammalian gene expression are strongly modulated by only slight variations in ROS
[31]. Reactive oxygen species are known to play
important roles in regulating proliferation and differentiation by modulating various growth factors as well as signaling molecules like HIF, AP-1, NFkB, MAP kinases, cell cycle and apoptotic proteins [32].
Knowledge of thyroid hormones action on the adult brain at the molecular and physiological levels is still limited, despite its importance in brain function. Nevertheless, the effect of thyroid hormones on antioxidant capacity of adult brain is poorly understood. However, it was stated that under normal physiological state, there exist a delicate balance between the rates of production of reactive oxygen species and their breakdown in adult rat brain. This delicate balance is under the fine control of thyroid hormones. Any alteration in the thyroid state of the body will influence the antioxidant status of mitochondrial and post-mitochondrial fractions of adult brain, thereby, impairment of the central nervous system functions [16].
Thus the main objective of the present study is to find out whether the changes in oxidative stress and antioxidant systems in response to altered thyroid hormone levels are exerted through modulation of gene expression. Therefore, this study was designed to evaluate the effect of hypothyroidism or
hyperthyroidism induced by PTU or LT4,
respectively, on the oxidative stress (MDA and NO) and antioxidant (GSH, GPx, SOD, and CAT) biomarkers as well as the expression of nNOS and SOD genes of adult male rats' brain. Furthermore, analysis of RAPD-PCR was also evaluated as DNA damage marker due to hypo- or hyperthyroid state.
MATERIALS AND METHODS
Animals: Ninety adult male Wistar albino rats
in plastic cages at room temperature, maintained at 23±2C0 and controlled 12:12 light and dark cycles and allowed to adjust to the new environment for two weeks before starting the experiment. Rats were fed on rodent chow and allow free access of drinking water. Animal care, maintenance and experiments were performed under the supervision of the Animal Ethics of NODCAR.
Experimental design: Animals were randomized
into five groups, each group consists of eighteen animals placed as triplicates (three cages for each group and each cage contains six rats).
Group (1): Negative control, animals received no injection.
Group (2): Control (hypo), animals received a daily i.p. injection of alkaline saline, (0.9% Nacl adjusted to pH 7.5 by NaoH) for 4 weeks.
Group (3): Hypothyroid, animals received a daily i.p. injection of PTU (10 mg/kg body wt.) for 4 weeks [33].
Group (4): Control (hyper), animals received a daily i.p. injection of alkaline saline, (0.9% Nacl adjusted to pH 8.5 by NaoH) for 3 weeks.
Group (5): Hyperthyroid, animals received a daily i.p. injection of L-T4 (300 µg/kg body wt.) for 3 weeks [19]. Animals were scarified after 24 hours from the last injection for biochemical and genetical analysis and histopathological examination.
Body and brain weights: The body weights were
recorded on the first day before treatment (initial) and on the day of sacrifice (final). Body weight was averaged for each week until the end of the treatment. The whole body weight and the brain weight were measured to the nearest gram.
Blood samples and brain tissues preparation:
Twenty four hours following the last treatment, Rats were sacrificed by decapitation and the trunk blood was collected and allowed to clot, centrifuge and separated serum samples were stored at -20 C° for determination of thyroid hormone levels. Thereafter, the brain was rapidly excised and plotted dry on filter paper to remove the excess fluid then weighed and stored at -20 C0 until used for oxidative stress and antioxidant parameters determination. Brain samples used for RNA extraction were stored at -80 C0, while that used for DNA extraction were stored at -20 C°. Another brain sections were kept in 10% formalin for the histopathological examination.
Biochemical analysis:
Thyroid hormones estimation: The levels of free T3 (fT3), free T4 (fT4), thyroid stimulating hormone
(TSH) were determined in serum samples by using
ELISA kits (diagnostic systems laboratories INC.) supplied from (Monobind Inc., USA) according to the manufacturer’s recommended protocol.
Oxidative stress parameters: Lipid peroxidation
was quantified as malondialdehyde (MDA) [34] method and expressed as nm/g tissue. The nitric oxide content was quantified indirectly as nitrite concentration according to the method of Miranda et al. [35], which depends on the reduction of nitrate to nitrite by vanadium chloride. The released nitrites were colorimetrically detected by Griess reagent. The NO levels were expressed as μm/g tissue.
Antioxidant status assay: The content of reduced glutathione (GSH) was evaluated by using the method of van Doorn et al. [36] which is based upon the development of relatively stable yellow color when DTNB is added to sulfhydryl compounds. Superoxide dismutase (SOD; EC 1.15.1.1) activity was determined by measuring the inhibition of auto-oxidation of pyrogallol at pH 8.5 [37]. The catalase (CAT; EC 1.11.1.6) activity was estimated from the ability of the tissue to decompose hydrogen peroxide (H2O2). Its concentration was determined at 240 nm
[38]. Glutathione peroxidase (GPx; EC 1.11.1.9)
activity was assayed by measuring oxidation rate of NADPH in the presence of H2O2, GSH and GR
[39].
The protein content of the different tissue homogenates was determined according to the Lowry
et al. [40] method, using bovine serum albumin as standard.
Genetical assay:
Gene expression analysis:
a. Extraction of total RNA: Brain tissues of male rats of all groups were used individually to extract total RNA using TRIzol® Reagent (Invitrogen, Germany). Total RNA of each tissue was treated individually with 1 U of RQ1 RNAse-free DNAse (Invitrogen, Germany) to digest DNA residues, re-suspended in diethyl pyrocarbonate (DEPC)-treated water and photospectrometrically quantified at A260. Purity of total RNA was assessed by the 260/280 nm ratio (between 1.8 and 2.1). Additionally, integrity was assured with ethidium bromide-stain analysis of 28S and 18S bands by formaldehyde-containing agarose gel electrophoresis. Aliquots were used immediately for reverse transcription (RT), otherwise stored at -80°C.
b. Synthesis of the cDNA using reverse
transcription (RT) reaction: The complete
as master mix (MM). The MM was consisted of 50 mM MgCl2, 5x reverse transcription (RT) buffer (50 mM KCl; 10 mM Tris-HCl; pH 8.3), 10 mM of each dNTP, 50 µM oligo-dT primer, 20 U ribonuclease inhibitor (50 kDa recombinant enzyme to inhibit RNase activity) and 50 U M-MuLV reverse transcriptase. The mixture of each sample was centrifuged for 30 sec at 1000 g and transferred to the thermocycler. The RT reaction was carried out at 25°C for 10 min, followed by 1 h at 42°C, and finished with a denaturation step at 99°C for 5 min
[41]. Afterwards the reaction tubes containing RT
preparations were flash-cooled in an ice chamber until being used for DNA amplification through sqRT-PCR.
c. Semi Quantitative Real Time-Polymerase Chain
Reaction (sqRT-PCR): PCR reactions were set up in
25 L reaction mixtures containing 12.5 L 1× SYBR® Premix Ex TaqTM (TaKaRa, Biotech. Co. Ltd.), 0.5 L 0.2 M sense primer, 0.5 L 0.2 M antisense primer, 6.5 L distilled water, and 5 L of cDNA template. The reaction program was allocated to 3 steps. First step was at 95.0°C for 3 min. Second step consisted of 27, 23 and 20 cycles for the nNOS,
SOD and glyceraldehydes-3-phosphate
dehydrogenase (GAPDH genes, housekeeping genes or reference primers), respectively. Each cycle was divided to 3 steps: (a) at 95.0°C for 15 sec; (b) at 55.0°C for 30 sec; and (c) at 72.0°C for 30 sec. The third step consisted of 71 cycles which started at 60.0°C and then increased about 0.5°C every 10 sec up to 95.0°C. At the end of each sqRT-PCR a melting curve analysis was performed at 95.0°C to check the quality of the used primers. Each experiment included a distilled water control.
The quantitative values of RT-PCR of nNOS (nNOS-F: 5′- gtgttccaccaggagatgttg -3′, nNOS-R: 5′- tggggcagtctccattgcca -3′, (Rawal et al., [42] ; and SOD (SOD-F: 5′- tctaagaaacatggcggtcc -3′, SOD-R: 5′- cagttagcaggccagcagat -3′, [42] genes were normalized on the bases of GAPDH (GAPDH -F: 5′-
ccacccatggcaaattccatggca -3′, GAPDH-R: 5′-
tctagacggcaggtcaggtcaacc-3′, [42]expression.
At the end of each sqRT-PCR a melting curve analysis was performed at 95.0°C to check the quality of the used primers.
d. Calculation of gene expression: The
amplification efficiency (Ef) was calculated from the slope of the standard curve using the following formula [43]: Ef = 10-1/slope
Efficiency (%) = (Ef – 1) x 100
The relative quantification of the target to the reference was determined by using the ΔCT method if
E for the target (nNOS, SOD) and the reference primers (GAPDH) are the same [43].
Ratio (reference/ target gene) = EfCT(reference) – CT(target)
DNA extraction: The genomic DNA was isolated
from the rats' brain tissues using phenol/chloroform extraction and ethanol precipitation method with minor modifications [44]. The purity of the DNA was evaluated by absorbances at 230, 260, and 280 nm
[44]. When impurities were present (pure DNA has a
ratio A260/A230=1.7–2.2), the DNA sample was passed
through the commercial UltraClean Soil kit until satisfactory purity was reached.
RAPD-PCR analysis: Five oligodecamers (10-mer
random primers: D01: 5'-ACCGCGAAGG-3' and
D03: 5'-GTCGCCGTCA-3' from the Operon
Technologies were used to generate RAPD profiles from rats DNA. DNA amplification reactions were performed under the conditions reported by Khalil et al. [45, 46]. PCR amplification was conducted in 20 µl reaction volume containing 100 ng genomic DNA; 100 µM dNTPs; 40 nM primer (Operon, Almeda, CA, USA); 2.5 units of Taq DNA polymearse and 5 µl promega 10X Taq DNA polymearse buffer. The DNA marker used was A 100-bp DNA ladder (Invitrogen, USA). The reactions were carried out in Thermocycler (Perkin-Elmer 9700) programmed with a first denaturation of 5 min at 94 °C, followed by 45 cycles of 0.5 min at 94 °C , 1 min at 36 °C and 2 min at 72 °C and finally, one cycle at 72 °C for 5 min. The PCR product was analyzed by electrophoresing 15 µl of the amplified mixture on agarose gel. The Gel-Pro Analyzer (Media Cybernetics) was used to document ethidium bromide DNA gels.
Histopathological examination: Brain samples were
taken from the different groups and fixed in 10% formalin saline overnight and then embedded with paraffin. When analyzed, all paraffin-embedded tissue was sectioned at 4 µm, deparaffinized in xylene, dehydrated by ethyl alcohol in decreasing concentrations (100%, 95% and 70%), and stained with haematoxylin (Merck KGaA, Darmstadt, Germany) and eosin (Sigma, St. Louis, MO, USA). These specimens were examined under bright-field optical microscopy using a light microscope and×40 magnification powers. Corresponding digital images were captured for later analysis [47].
Statistical analysis: All data were analyzed as a one-way analysis of variance using the SAS software [48]. Data are expressed as means ± SEM. Mean values were separated, when significance is present, using Duncan′s Multiple Range Test [49]. Significance level
RESULTS
Hypo- or hyperthyroidism states induced by PTU and L-T4, respectively are shown in Table (1). The values
indicate the effectiveness of both PTU-induced hypothyroidism and L-T4-induced hyperthyroidism.
There were no differences in initial body weight among the studied groups. However, after 4 weeks of
PTU administration or 3 weeks of L-T4
administration, the final body weights were lower than that of the control (hypo) (-11.4 %) and control (hyper) (-15.9 %). There was no significant difference in the final body weight between the three control groups. A significant (P≤0.05) decrease in the average weight of the whole brain was observed in response to either hypothyroidism (-12.2%) or hyperthyroidism (-15.5%) in comparison to their control groups. There was no significant difference in the brain weight between the three control groups. Significant (p≤0.05) decrease in fT3 (-39.1%) and fT4
(-68.4%) and significant increase (p≤0.05) in TSH (18.4%) concentrations of PTU-treated rats are consistent with hypothyroidism. In the L-T4-treated
rats, also, elevation in fT3 (63.0%, p≤0.05) and fT4
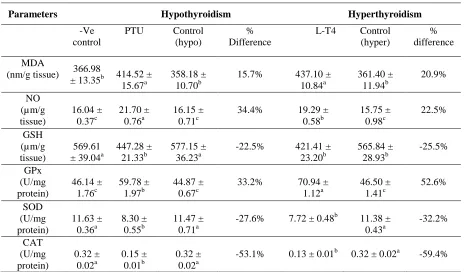
(73.7 %, p≤0.05) and decline in TSH (-16.7%, p≤0.05) levels confirmed hyperthyroidism. The effects of the different thyroid state levels (hypo-or hyperthyroidism) on the oxidative stress biomarkers and antioxidant status in the whole brain of rats are presented in Table (2). The levels of MDA and NO in the crude homogenate of whole brain of PTU-treated rats were significantly elevated by 15.7 % and 34.4%, respectively in comparison to the relative controls. The same pattern of increase took place in response to hyperthyroidism induced by L-T4. These include
elevations in MDA by 20.9%, and NO by 22.5%, relative to the control values. Both the hypo- and hyperthyroidism resulted in significant pronounced decline in the content of GSH (-22.5% and -25.5%, respectively) and the activities of SOD (27.6% and -32.2%, respectively) and CAT (-53.1% and -59.4%, respectively), of rats brain. A reverse pattern of effects on GPx activity took place in response to the different thyroid hormone levels. This includes a significant elevation in GPx activity in both the
hypothyroidism (33.2%) and hyperthyroidism
(52.6%) groups compared to the respective controls (Table 2).
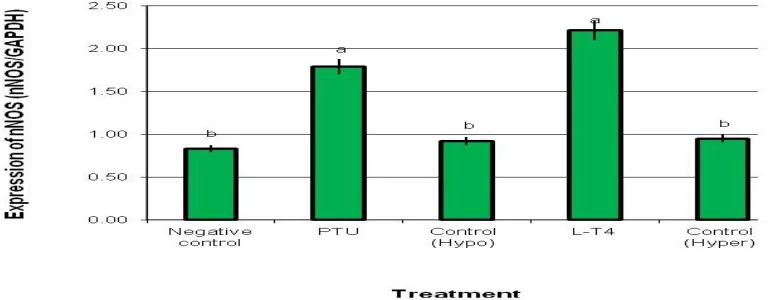
Expression of nNOS and SOD genes: Effect of
hypothyroidism or hyperthyroidism induced by PTU or L-T4, respectively, on the expression changes of
nNOS and SOD genes in brain of male rats are summarized in Figures 1 and 2 respectively. The results indicated significant increases in the gene expression levels of nNOS gene in the brain tissues
of male rats treated with PTU or L-T4 compared with
those of the three control groups (Figure 1). As for the expression of the SOD gene, the results showed that the expression levels of SOD in male rats treated with PTU or L-T4 were significantly lower than those
found in the three control groups (Figure 2).
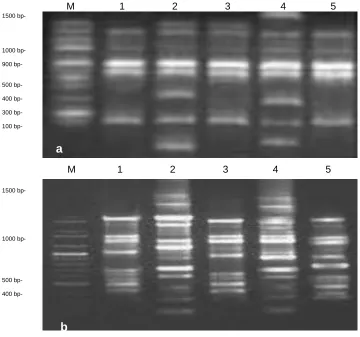
RAPD-PCR profile: Two primers D01 and D03 (each consists of 10-mer base pair) were used to
evaluate the genetic variability due to
hypothyroidism and hyperthyroidism induced by PTU and L-T4 treatments in male rat brain genomes
and their controls, to determine DNA fingerprinting. Both primers used gave positive and detectable bands (Figure 3). These random primers amplified a total of 96 different bands, ranging from 102 to 1986 base pairs. Overall samples, the number of RAPD bands generated per primer varied between 18 and 42 bands, with an average of 29.4 ± 3.1 bands per primer. Nearly the same results were obtained when the PCR assay was performed for each sample within each group (n=5 rats).
The bands obtained from the brain tissues of rats treated with PTU and L-T4 alkaline saline [control
(hypo) and control (hyper), respectively] were similar when compared with the negative control (untreated) rats. Where, of the most scorable bands (62%) were similar “monomorphic” for the control samples (Figure 3). However, the DNA of the brain samples of rats treated with PTU or LT4 showed the presence
of 48% new bands (polymorphic) that did not appear in the samples of other three control groups (Figure 3). Although these new bands resulted from PTU or LT4 treatment using primers D01 and D03 were different compared with the control groups, they were relatively similar compared to each other. These new bands could be considered as new markers attributed to PTU or L-T4 treatments.
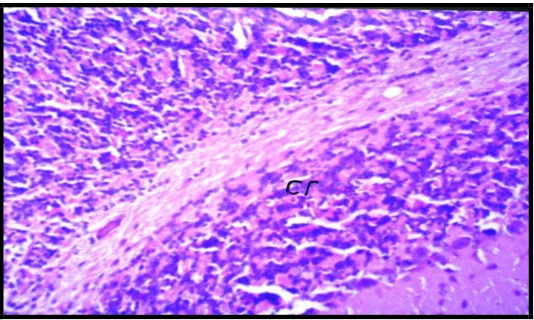
Histopathological examination: Figures (4 to 8) show that there were no histopathological alterations observed in the negative control and the controls of (hypo) and the (hyper), where the normal histological structure of the meninges, cerebral cortex, cerebrum and cerebellum were observed in the three control groups. Pathological examination of the brain tissue of the hypothyroid rats, showed focal gliosis in the
cerebrum (Fig 9). Moreover, pathological
DISCUSSION
The results obtained from the present study have
shown that, the induced hypothyroidism or
hyperthyroidism through administration of PTU or L-T4, respectively affect the thyroid status of the treated
animals and these are reflected in the changes of both serum fT3 and fT4. The TSH serum level changed in
the opposite direction compared to fT3 and fT4.
Several studies have demonstrated induction of hypothyroidism by PTU injection that resulted in decline in T3 and T4 levels accompanied by increase
in TSH level [50, 51]. Propylthiouracil has been shown previously to inhibit thyroid hormones synthesis effectively in the rat [33]. In addition to blocking synthesis, PTU also inhibits the peripheral deiodination of T4 to T3 [52]. Other studies reported
induction of hyperthyroidism by L-T4 treatment.
They observed increased T3 and T4 concentrations
along with lower TSH concentration in rats serum
[53-55]. The decrease in body and brain weights following
PTU or L-T4 administration confirmed the induction
of hypo- and hyperthyroidism and corrdoborates other findings [56, 57]. In our study, the increased levels of MDA and NO in the rat brain by the administration of PTU or L-T4 suggest induction of
oxidative stress. It has been suggested that the increase in ROS, induced by either low (hypothyroid state) or high (hyperthyroid state) thyroid hormones level, can lead to an oxidative stress condition in the brain with the consequent lipid peroxidative response
[21, 50, 51, 54].
The induction of oxidative stress, in the tissue, might have resulted from acceleration of tissue cellular respiration due to increase generation of ROS. It is a well-established fact that mitochondrial respiration in vertebrate is accelerated by altered thyroid hormones
[16]. The enhancement of cellular respiration is
generally associated with increased production of superoxide radicals at the site of ubiquinone. Superoxide radicals can lead to the formation of many other reactive species, including hydroxyl radicals, which can start the free radical-dependent process of lipid peroxidation. Formation of hydroxyl radical by Fenton reaction can threaten tissues with oxidative injury by affecting almost all biological macromolecules [16].
In the current study, the observed elevation of brain NO level in both hypo- and hyperthyroid rats is in agreement with other studies, where it has been observed a high level of NO in brain of hypothyroid
[58]
and hyperthyroid [54] rats. Nitric oxide (NO) is synthesized from L-arginine by NOS in an NADPH-requiring reaction [27]. Nitric oxide modulates
neuronal activity via facilitation of cyclic guanosine monophosphate-induced signal cascades, and by S-nitrosylation of specific protein [59]. Furthermore, NO may be converted to a number of more reactive derivatives, known collectively as reactive nitrogen species. Thus, reacting with superoxide, NO produces peroxynitrite (ONOO), a powerful oxidant, able to damage many biological molecules and both decompose releasing small amounts of hydroxyl radicals [60]. Moreover, NO causes mitochondrial dysfunction due to damaging complexes of respiratory chain, (complex I-III, II-III and cytochrome c oxidase), leading to more formation of superoxide radical[16, 61]. Our data are in agreement with above ideas, since the increase observed in NO and MDA-induced ROS could be the factors that determine the histopathological alteration observes in
the brain of hypo- and hyperthyroid rats.
Interestingly, it has been proposed that NO, which is mainly produced by nNOS in the mammalian brain, acts a negative regulator of cell proliferation in the adult brain [62]. Furthermore, the increase in ROS could be the trigger for free radicals chain-reactions leading to oxidative damage to membrane lipids, proteins, nucleic acid and carbohydrates [16].
In the current study, Hypo- or hyperthyroidism induction leads to a significant decline in brain GSH level. This result is coincided with previous findings
[51, 54, 63, 64, 65].
The GSH is present in all mammalian tissue [66] and plays an important role in many biological processes of cells, including synthesis of proteins, DNA and against oxidative damage [67]. Thyroid hormone is known to play a helpful role in maintaining GSH homeostasis in astrocytes thereby protecting the brain from oxidative stress induced pathophysiological conditions [1]. Reduction in specific activity of cerebral glutamate cysteine ligase and gamma glutamyl transpeptidase, key enzymes in synthesis of GSH, was reported as a response to hypothyroidism [63, 64]. The observed decrease in GSH level by hypo- and hyperthyroidism induction could be a consequence of decreased synthesis of GSH or increased consumption of GSH due to their interaction with the ROS [1].
The results of the present study also noticed that hypo- or hyperthyroidism induction caused a significant reduction in SOD and CAT activity and a significant elevation in GPx activity in brain of adult male rats. Several authors have reported alterations in antioxidant status in various tissues including brain of adult rats in response to altered thyroid states [18, 21, 50,
54, 68, 69]
superoxide radicals to hydrogen peroxides, which are then degraded to water by CAT and GPx enzymes of the cells [70]. Decrease in activities of SOD and CAT in brain in response to hypo-and hyperthyroidism may be contributed to increase in the oxidative stress which exceeds cellular antioxidant enzyme activities
[21, 51, 54]. These previous results agree well with our
findings that showed an elevation in MDA and NO levels along with a reduction in SOD and CAT activities. It was also stated that, activity of SOD and CAT in hypothyroid rats was lower than control rats
[51]. This may be a crucial factor in protection of
neurons from oxidative stress induced injury. Superoxide dismutase acts as a double edged sword; it scavenges superoxide radical by dismutating it to hydrogen peroxide which can freely move across cell membranes and cause oxidative modification [26]. The authors also showed an increased activity of GPx in PTU-treated rats. The enzymes (CAT and GPx) have been shown to have complementary functions for catalyzing their substrate [26]. In the current investigation an increase in GPx activity has been observed which may be in response to increased lipid peroxidation in brain of hypo- and hyperthyroid rats. Collectively, the present study suggested that the decline in SOD and CAT activities in brain of hypo- or hyperthyroid adult rats may impair the capacity of the brain to neutralize superoxide radicals and hydrogen peroxide generated as a consequence of
hyper-metabolic state due to hypo- or
hyperthyroidism.
The results of the present study also suggest that both
hypo- and hyperthyroidism induction caused
upregulation of nNOS and downregulation of SOD gene expression of adult rat brain. Thyroid hormone influence gene expression, either positively or negatively, by interaction with transcriptionally active nuclear thyroid hormone receptors [71].
Few studies indicated that altered thyroid hormone induces upregulation of nNOS gene expression in cerebral cortex of postnatal rat [30], hypothalamus [28] and hippocampus [20] of adult rat. These studies suggested a possible physiological link between thyroid hormone and nNOS in the brain. The role of metabolic and oxygen gradients in modulating ROS induced gene expression was discussed in detail [31]. It has also been suggested that thyroid hormone may play a role in direct regulation of expression of some antioxidant genes and various other genes associated with cell growth and proliferation [72]. Several important reports strongly indicate that thyroid hormones are significant regulators of nNOS [30, 61, 73]. It was shown that low T3
levels induce three fold increases in mRNA and one fold increase in protein expression of liver nNOS
accompanied by its selective translocation to mitochondria [61]. Translocation of nNOS resulted in enhanced mitochondrial active oxygen species and peroxynitrite yields leading to tyrosine nitration of complex 1 protein that reduced complex activity, lowering the metabolic rate. Up-regulation of nNOS gene expression in hyperthyroidism and down-regulation in hypothyroidism in the rat cerebral cortex at early postnatal development could lead to changes in metabolic activity, synaptic efficacy and development [30].
Similar studies by Sinha et al., [73] showed that maternal thyroid hormone deficiency during early
gestational period causes massive premature
elevation in the expression of nNOS with an associated neuronal death in embryonic rat neocortex. However, it was indicated that PTU retarded the development of cerebellum by decreasing nNOS concentration and slowing down layer formation [74]. Thyroid hormone induces up-regulation of nNOS gene expression in the supraoptic and paraventricular hypothalamic nuclei which are involved in the control of the osmotic change evoked by salt loading
[28]. Up- regulation of nNOS gene can be interpreted
as a defense response against thyroid dysfunction-induced oxidative stress by protecting the brain from ROS toxicity. This can be achieved by the rather large NO production that is expected in conditions of NOS expression, which may scavenge ROS to reduce the oxidation potential that oxidizes biomolecules [74].
In the current study a decline in the SOD gene expression of adult male hypothyroid rat brain was similar to other results where reduction in the expression of SOD1 and SOD2 were confirmed in the cerebellum of developing rats [50], cerebral cortex of postnatal rats [51] and cerebral cortex and cerebellum of adult rats [21] in response to hypothyroidism using western blotting and semi-quantitative RT-PCR. Decreased activities of SOD1 and SOD2 in hypothyroid rats reflect their respective transcriptional and translational levels [21].
Our results also demonstrated a significant reduction in SOD gene expression in the brain of male adult hyperthyroid rats. To our knowledge, this is the first report evaluate the SOD gene expression in adult rat brain following induction of hyperthyroidism. Several reports studied the effect of hyperthyroidism on antioxidant enzyme gene expression in different tissues other than brain. Hyperthyroidism induced by administration of T3 caused significant changes in
hyperthyroidism to rats resulted in decrease in activity levels and protein expression levels of SOD1, SOD2 and CAT in liver as reported by Subudhi and Chainy, [75]. The authors also added that, the decrease in SOD activity could be related to reduction in the transcription of SOD in hyperthyroid rats either due to the oxidation of the transcription factors or due to the decrease in the half lives of mRNA [75]. Decline of SOD and CAT activities in renal cortex rats in response to hyperthyroidism may be due to down expression of their respective gene as a consequence of oxidative stress [76].
It is apparent, from the results of the current study, that the decline in the activity of SOD in the brain of adult rats, in response to either hypo- or hyperthyroidism, has a strong correlation with the expression of respective gene level. The altered expression of antioxidant enzymes in the brain tissues of the hypothyroid or hyperthyroid rat may be responsible for the inadequacy of the antioxidant defences in combating ROS-mediated damage [21, 75,
76].
Our data also showed that, induction of hypo-or hyperthyroidism caused damage in DNA of rat brain, represented by the appearance of 48% new bands (polymorphic), which did not appear in the samples of other three control groups. These new bands proved that the DNA damage could be considered as
new markers attributed to the induced
hypothyroidism or hyperthyroidism status of the adult rats. In accordance with our finding, increased DNA damage was found in Hypothyroid [24, 77] and hyperthyroid [54] rats brain. Studies investigating the possible effect of thyroid states on oxidative DNA damage are limited [78]. The authors indicated that, increased DNA damage in hypo- and hyperthyroid rats could be due to increased damage and/or
decrease repair [78]. It has been well documented that ROS induced by thyroid dysfunctions would lead to oxidative damage of biological macromolecules, including lipid, protein, and DNA [53, 79]. It was also suggested that thyroid hormone-induced superoxide and NO generation likely leads to peroxynitrite (ONOO-) formation that may contribute to the enhanced pro-oxidant condition elicited by thyroid dysfunction [16]. Moreover, ONOO- has been shown to induce oxidative DNA damage [80]. The above finding could explain the increased DNA damage observed in our study in both hypo- and hyperthyroid rats brain. DNA degradation is a critical event in the mechanism of cell death [81].
CONCLUSION
From the results of the current study, it can be
concluded that the hypothyroidism or
hyperthyroidism status induced by PTU or L-T4 administration, caused significant alterations in the oxidative stress parameters (MDA and NO), antioxidant status (GSH, GPx, SOD and CAT) and gene expression of nNOS and SOD as well as DNA damage and histopathological changes in brain tissues of male adult rats. These results provide evidences that, the increased NO level and decreased SOD activity induced by hypo-or hyperthyroidism in adult rat brain may be exerted through the modulation of nNOS and SOD gene expression as a consequence of oxidative stress-induced by thyroid dysfunction.
ACKNOWLEDGMENT
The authors are highly thankful to Dr. Adel Bakir Khlossy, Professor of Histopathology, Faculty of Veterinary Medicine, Cairo University, Egypt, for his help in the histopathological study.
Figure (1): Expression of nNOS mRNA in brain tissues of male rats treated with PTU and L-T4 and analyzed by the
Figure (2): Expression of SOD mRNA in brain tissues of male rats treated with PTU and LT4 and analyzed by the
semi-quantitative Real Time-PCR. A, b Means with different superscripts differ significantly (p ≤ 0.05).
Figure 3: Comparison of RAPD-PCR profiles of different rat brain genomic DNA. (a) and (b) agarose gels represent PCR products with primer D01 and D03, respectively. M: represents DNA marker, Lane 1: represents the negative control rats, Lanes 2: represents rats treated with Propylthiouracil (PTU), Lanes 3: represents control (Hypo), rats treated alkaline saline (pH 7.5), Lanes 4: represents rats treated with L-thyroxine (L-T4), and Lanes 5:
represents control (Hyper), rats treated with alkaline saline (pH 8.5). 1500 bp-
1000 bp-
900 bp-
500 bp-
400 bp-
300 bp-
100 bp-
a
a
a
a
B
M 1 2 3 4 5
1500 bp-
1000 bp-
500 bp-
400 bp-
b
a
a
a
Fig. 4: Showing normal histological structure of Fig. 5: Showing normal histological structure meninges (m), cerebral cortex (cc) and of striatum (cs) and hippocampus (hp) of negative
cerebrum (c) of negative control rats (H&Ex 40). control rats (H&Ex 40).
Fig. 6: Showing normal histological structure of the cerebellum (cr) of negative control rats (H&Ex 40).
Fig. 7: Showing normal histological structure of Fig. 8: Showing normal histological structure of
Fig. 9: Showing congestion in blood vessels (v) with Fig. 10: Showing focal gliosis (g) in cerebrum of vacuolization and encephalomalacia (→) of hypothyroid rats (H&Ex 40).
cerebral matrix of hyperthyroid rats (H&Ex 40).
Table 1: Final body weight, brain weight and serum thyroid hormone levels in hypo- and hyperthyroid rats (Means ± SEM).
Parameters Hypothyroidism Hyperthyroidism
-Ve control
PTU Control
(hypo)
% difference
L-T4 Control
(hyper) % difference Final body
Weight (g) n=10
312.40 ± 10.32a
285.53 ± 4.61b
322.38 ± 5.8a
-11.4% 265.09 ±
4.59b
315.19 ± 4.45a
-15.9%
Brain weight(g) n=10
1.95 ± 0.06a
1.65 ± 0.02b
1.88 ± 0.05a
-12.2% 1.63 ±
0.03b
1.93 ± 0.05a
-15.5%
fT3 (pg/ml) n=8
2.18 ± 0.10b
1.37 ±0.09c
2.25 ± 0.13b
-39.1% 3.52 ±
0.19a
2.16 ± 0.16b
63.0%
fT4 (ng/dl) n=8
2.52 ± 0.13b
0.81 ± 0.07c
2.56 ± 0.14b
-68.4% 4.22 ±
0.31a
2.43 ± 0.08b
73.7%
TSH(µlU/ml) n=8
0.48 ± 0.03b
0.58 ± 0.03a
0.49 ± 0.02b
18.4% 0.40 ±
0.02c
0.48 ± 0.02b
-16.7%
a, b and c Means, between treatments within parameter and followed by different superscripts differ significantly (p≤ 0.05).
Table 2: Oxidative stress and antioxidant status in brain samples of hypo-and hyperthyroid rats.
Parameters Hypothyroidism Hyperthyroidism
-Ve control
PTU Control
(hypo)
% Difference
L-T4 Control (hyper)
% difference
MDA
(nm/g tissue) 366.98
± 13.35b 414.52 ± 15.67a
358.18 ± 10.70b
15.7% 437.10 ±
10.84a
361.40 ± 11.94b
20.9%
NO (µm/g tissue)
16.04 ± 0.37c
21.70 ± 0.76a
16.15 ± 0.71c
34.4% 19.29 ±
0.58b
15.75 ± 0.98c
22.5%
GSH (µm/g tissue)
569.61 ± 39.04a
447.28 ± 21.33b
577.15 ± 36.23a
-22.5% 421.41 ±
23.20b
565.84 ± 28.93b
-25.5%
GPx (U/mg protein)
46.14 ± 1.76c
59.78 ± 1.97b
44.87 ± 0.67c
33.2% 70.94 ±
1.12a
46.50 ± 1.41c
52.6%
SOD (U/mg protein)
11.63 ± 0.36a
8.30 ± 0.55b
11.47 ± 0.71a
-27.6% 7.72 ± 0.48b 11.38 ±
0.43a
-32.2%
CAT (U/mg protein)
0.32 ± 0.02a
0.15 ± 0.01b
0.32 ± 0.02a
-53.1% 0.13 ± 0.01b 0.32 ± 0.02a -59.4%
a, b and c Means, between treatments within parameter and followed by different superscripts differ significantly (p≤ 0.05).
% difference represents a comparison between controls and their respective treated values. (Means ±SEM), n=10.
REFERENCES
1. Ahmed OM, El-Gareib AW, El-bakry AM, Abd El-Tawab SM Ahmed RG. Int. J. Dev. Neurosci, 2008; 26 (2):
147-209.
2. Sigrun H, Heike H.Cell Endocrinol, 2010; 315: 19-26.
3. Wang Y, Zhong J, Wei W, Gong J, Dong J, Yu F, Wang Y, Chen J. Biol. Trace. Elem. Res, 2011; 144(1-3): 1039-1049.
4. Artis AS, Bitiktas S, Taskin E, Dolu N, Liman N, Suer C. J. Neuroendocrinol, 2012; 24(3): 422-433. 5. Hassan WA, Aly MS, Abdel Rahman T, Shahat AS. Int. J. Dev. Neurosci., 2013a; 31: 225-233. 6. Hassan WA, Abdel Rahman T, Aly MS, Shahat AS. Int. J. Dev. Neurosci., 2013b; 31: 311-318. 7. Smith JW, Evans AT, Costall B, Smythe JW. Neurosci. Biobehav. Reviews, 2002; 26: 45-60.
8. Montero-Pedrazuela A, Venero C, Lavado-Autric R., Fernandez-Lamo I., Garcia-Verdugo J. M., Bernal , Guadano-Ferraz A., Mol. Psychiatry, 2006; 11: 361-371.
9. Zhang L, Blomgren K, Kuhn HG, Cooper-Kuhn CM, Neurobiology of Disease, 2009; 34:366-374.
10. Diez, D, Grijota-Martinez C, Agretti P, De Marco G, Tonacchera M, Pinchera A, de Escobar GM, Bernal J , Morte B. Endocrinol. 2008; 149: 3989-4000.
11. Sharlin DS, Gilbert ME, Taylor M, Ferguson D, Zoeller RT. J. Neuroendocrinol., 2010; 22: 153–165. 12. Sarkar PK, Morris JJ, Martin JV. Indian J. Exp. Biol., 2011; 49: 169-176.
13. Bauer M, Whybrow PC. Hormones, brain and behavior, vol 2. Elsevier, USA, 2002; 239-264. 14. Boelaert K, Franklyn JA. J. Endocrinol., 2005; 187: 1-15.
16. Venditti P, Di Meo S, Cell Mol. Life Sci., 2006; 63: 414-434.
17. Sarkar M, Varshney R, Chopra M, Sekhri A, Adhikari JS, Dwarakanath BS. Cytometry Part B (Clinical Cytometry), 2005; 70B: 20-23.
18. Das K, Chainy GBN, Neurochem. Res., 2004; 29 (9): 1755-1766.
19. Mogulkoc R, Baltaci AK, Oztekin E, Aydin L, Sivrikaya A, Life Sci., 2006; 79: 311-315.
20. Cano-Europa E, P'erez-Severiano F, Vergara P, Ortiz-Butron R, Rios C, Segovia J, Pacheco-Rosado J, Metab. brain Dis., 2008; 23: 275-287.
21. Jena S, Anand C , Chainy GBN , Dandapat J, Neurol. Sci., 2012a; 33:869-873.
22. Aniello F, Couchie A, Bidox A, Gripois D , Nunez J, Proc Natl Acad Sci USA., 1991; 88: 4035-4039.
23. Simonides WS, Brent GA, Thelen MHM, van der Linden CG, Larsen PR, van Hardeveld C, J. Biol. Chem., 1996; 271: 32048-32056.
24. Singh R, Upadhyay G, Kumar S, Kapoor A, Kumar A, Tiwari M, Godbole MM. J. Endocrinol., 2003; 176 (1): 39-46.
25. Halliwell B.. J. Neurochem., 2006; 97: 1634-1658.
26. Halliwell B, Gutteridge JMC. Free radicals in biology and medicine, 3rd edn. Oxford University Press, New York, 2001.
27. Brown LA, Key BJ, Lovick TA. J. Neurosci. Methods, 1999; 92: 101-110. 28. Ueta Y, Levy A, Chowdrey HS, Endocrinology, 1995; 136: 4182-4187. 29. Chakrabarti N, Ray AK. Neuropsychopharmacol., 2000; 22: 36-41.
30. Serfozo Z, Kiss PB, Kukor Z, Lontay B, Palatka K, Varga V, Erdodi F, Elekes K. Neurochem. Res., 2008; 33: 569-578.
31. Allen RG, Tresini M, Free Radic. Biol. Med., 2000; 28:463-499.
32. Hancock JT, Desikan R , Neill SJ, Biochem. Soc. Trans., 2001; 29: 345-350. 33. Parmar HS, Kar A. Chemico-Biological Interactions, 2009; 177:254-258. 34. Uchiyama M, Mihara M, Anal. Biochem., 1978, 86: 271-278.
35. Miranda KM, Espey MG, Wink DA.Nitric Oxide, 2001; 5(1): 62-71.
36. van Doorn R, Leijdekkers CM , Henderson PT. Toxicol., 1978: 11(3): 225-233. 37. Nandi A, Chatterjee, IB., J. Biosci., 1988; 13(3): 305-315.
38. Aebi H. Catalase in vitro. In: methods enzymology Packer (1st ed), New York, Academic Press, 1984; pp: 121-126.
39. Paglia DE, Valentine WN. J. Lab. Clin. Med., 1967; 70: 158-169.
40. Lowry OH, Rosebrough NJ, Farr AL, Randall RJ. J. Biol. Chem., 1951; 193: 265-275. 41. Assaf N, Shalby AB, Khalil WK, Ahmed HH. J. Physiol. Biochem., 2012; 68(1): 77-90.
42. Rawal AK, Muddeshwar MG , Biswas SK. BMC Compl. Altern. Med., 2004; 13:4-11.
43. Bio-Rad Laboratories, Inc. Real-Time PCR applications guide. Bulletin 5279, 2006; pp. 101.
44. Aquardo CF, Noom WA, Begun SJ. RFLP analysis using heterologous probes. In: Hoelzel, A.R., (ed.), molecular genetic analysis of populations, a practical approach. IRL press, Oxford., 1992; pp: 115-157.
45. Khalil WKB, Mahmoud MA, Zahran MM, Mahrous KF. Journal of Applied Toxicology, 2007; 27: 380-390.
46. Khalil WKB, Ahmed KA, Park MH, Kim YT, Park HH, Abdel-Wahhab MA. Arch. Toxicol., 2008; 82: 183-195.
47. Banchroft JD, Steven A, Turner DR. Theory and practice of histological techniques. 4th edn. Churchill Livingstone, New York - San Francisco – Tokyo; 1996.
48. SAS, SAS user’s guide: statistics, 1982 edn. SAS Institute Inc., Cary, NC, 1982. 49. Duncan, DB, Multiple Range and Multiple F Tests. Biometrics, 1955; 11(1): 1-42. 50. Bhanja S, Chainy GBN, Int. J. Dev. Neurosci., 2010; 28: 251-262.
51. Bhanja S, Jena S. Neurochem. Res., 2013; 38: 42-49.
52. Yi X, Yamamoto K, Shu L, Katoh R, Kawaoi A. Endocrine Pathology, 1997; 8: 315-325.
53. Messarah M, Boumendjel A, Chouabia A, Klibet F, Abdennour C, Boulakoud MS, El Feki A. Exp. Toxicol. Pathol., 2010; 62(3): 301-310.
54. Elazazy DAS, Rizk SM, Barakat MA H, Hussein RM. Global J. Biochem., 2012; 3(10): 1-9.
55. Ourique GM, Finamor IA, Saccol EMH, Riffel APK, Pes TS, Gutierrez K, Goncalves PBD, Baldisserotto B, Pavanato MA, Barreto KP. Reprod. Toxicol., 2013; 37: 31-39.
56. Pamplona R, Portero-Otin M, Ruiz C, Bellmunt MF, Requenta JR, Thorpe SR, Baynes JW, Romero M,
Lopez-Torres M, Barja G. Free Radic. Biol. Med., 1999; 27: 901-910.
58. Hosseini M, Dastghaib SS, Rafatpanah H, Hadjzadeh MA, Nahrevanian H, Farrokh I. Clinics, 2010; 65(11): 1175-1181.
59. Guix FX, Uribesalgo I, Coma M, Munoz FJ. Prog. Neurobiol., 2005; 76: 126-152.
60. Radi R, Cassina A, Hodara R, Quijana C, Castro L. Free Radic. Biol. Med., 2002; 33: 1451-1464.
61. Franco MC, Arciuch VGA, Peralta JG, Galli S., Levisman D, Lopez LM, Romorini L, Poderoso JJ, Carreras MC. J. Biol. Chem., 2006; 281: 4779-4786.
62. Packer MA, Stasiv Y, Benraiss A, Chmielnicki E, Grinberg A, Westphal H, Goldman SA, Enikolopou G. Proc. Natl. Acad. Sci. USA, 2003; 100: 9566-9571.
63. Dasgupta A, Das S, Sarkar PK. J. Neurosci. Res., 2005; 82: 851-857. 64. Dasgupta A, Das S., Sarkar PK. Free Radic. Biol. Med., 2007; 42: 617-626. 65. Kim SM, Kim SC, Chung IK, Cheon WH, Ku SK. Article ID 578497, 2012; p. 12. 66. Shelly CL. Mol. Aspects Med., 2008; 30: 42-59.
67. Sies H, Free Radic. Biol. Med., 1999; 27: 916–921.
68. Chattopadhyay S, Sahoo DK, Subudhi U, Chainy GBN. Com. Biochem. Physiol., 2007; 146: 383-391. 69. Jena S, Chainy GBN, Dandapat J, Gen. Comp. Endocrinol., 2012b, 178: 8-18.
70. Schmatz R, Perreira LB, Stefanello N, Mazzanti C, Spanevello R, Gutierres J, Biochimie., 2011; 30: 1-10. 71. Bernal J. Nat. Clin. Pract. Endocrinol. Metab., 2007; 3: 249-259.
72. Santos GM, Afonso U, Barra G, Togashi MP. Webb, F. A. R. Neves, N. Lomri and A. Lomri, 2006. Mol. Pharmacol., 70: 793-800.
73. Sinha RA, Pathak A, Mohan V, Bandyopadhyay S, Rastogi L, Godbole MM. Endocrinol., 2008; 149(9):
4396-4401.
74. Serfozo Z, Jan de Vente J, Elekes K. Neuroendocrinol., 2009; 89: 337-350. 75. Subudhi U, Chainy GBN. Chem. Biol. Interact., 2010; 183: 304-316. 76. Jena S, Chainy GBN. Mol. Biol. Rep., 2011; 38: 1047-1054.
77. Xuang XW, Zhao ZY , Ji C. Zhonghua Er Ke Za Zhi., 2005; 43(1): 48-52.
78. Andican G, Gelisgen R, Civelek S, Seven A, Seymen O, Altug T, Yigit G, Burcak, G. J. Toxicol. Environ. Health, 2004; 67: 413-420.
79. Das, K. and G. B. N. Chainy, 2001. Biochim. Biophys. Acta., 1537: 1-13.
80. Levrand, S., C. Vannay-Bouchicne, B. Pesse, P. Pacher, F. Feihl, B. Waeber and L. Liaudet, 2006. Ferr. Radic. Biol. Med., 41: 886-895.