Effects of solidification cooling rate on the
microstructure of nickel based superalloy
GTD222
Bo Gaoa, Yanfei Suia, Hongwei Wanga, Chunming Zoua, Zunjie Weia, R. Wangb*, Yanle Sunb,c*
a) National Key Laboratory for Precision Hot Processing of Metals, School of Materials
Science and Engineering,Harbin Institute of Technology, Harbin 150001, China
b) Shanghai Key Laboratory of Advanced High-temperature Materials and Precision
Forming, School of Materials Science and Engineering, Shanghai Jiao Tong University,
Shanghai 200240, China
c) School of Materials Science and Engineering, Shanghai Jiao Tong University,
Shanghai 200240, China
Abstract:
The microstructure and solidification behavior of nickel based GTD222 superalloy at
different cooling rates are studied. The solidification of the GTD222 superalloy
proceeds as follows: L→L+γ, L→L+γ+MC, L→L+(γ/γ ′)-Eutectic and L→η phase.
The temperature of liquidus of GTD222 superalloy is 1360 °C while the solidus is
slightly lower at 1310 °C, which due to the alloying elements redistribution. It was
found that the dendrite arm spacing of the alloy decreased with the increase of cooling
rate (From 200 μm at 2.5 K/min to 100 μm at 20 K/min).
Keywords: GTD222; nickel based superalloy; solidification behavior; cooling rate.
* Correspondence address: [email protected]
Corresponding author: Dr. Sun Yanle
Address: School of Materials Science and Engineering, Shanghai Jiao Tong University,
Number 800, Dongchuan Road,
Minhang District,
Shanghai 200240,
1 Introduction
Casting superalloys are widely applied in industrial areas like gas turbine,
aerospace and chemical process industries owing to its excellent mechanical properties
and thermal corrosion resistance [1, 2]. In order to develop more efficient advanced
solidification technology, the data of superalloys on thermophysical properties are
increasingly needed [3]. From a theoretical and industrial perspective, knowledge of
superalloy solidification behavior is crucial for the controlling of superalloy casting
process [4]. For the nickel based superalloys, the matrix of alloy named gamma phase
(γ) and the precipitate phase is known as gamma prime phase (γ′). The excellent
mechanical properties of nickel based superalloys are due to the microstructures
combining γ and γ′ phases. The shape and volume fraction of γ′ precipitates critical to
the mechanical properties of nickel based superalloys and it is dependent on the service
temperature [5]. The volume of γ′ phase depends on the temperature no matter the
materials are casting or wrought and the materials keep reacting when the superalloys
serviced under elevated temperature [6]. The distribution of γ′ precipitates is also
important and it is an outcome of the processing used [7]. So for any certain superalloys,
the optimum mechanical properties can be obtained only by applying suitable heat
treatment [3].
For nickel based superalloys, the solidus temperature (the temperature at which
incipient begin to melt) and the solvus temperature (the onset of precipitate γ′ phase)
are very important. Because the heat treatment of the nickel based superalloys must be
carried out in this temperature range (the temperature range is named heat treatment
window). For heat treatment after casting, the incipient melting temperature is very
important due to that a balance has to struck between maximize the volume of γ′
precipitates and not introducing the interdendritic liquid phase. Even hence amounts of
liquid phase appearing cause the workability of superalloys decrease dramatically.
Therefore, for any nickel based superalloy, solvus temperature and solidus temperature
must be accurate measured in order to optimize the mechanical properties of superalloy.
keep increasing. The casting system of the hot-end parts are intricacy and this leads to
the difficulty of controlling the segregation of the components. The cooling rate has a
significant effect on segregation. Numerous studies have shown that cooling rate and
material microstructure have a tight relevance. Chen et al. [8] studied the compositional
changes of micro-scale precipitates of an advanced Ni-base superalloy at different
cooling rates. It was found that the chemical composition of the precipitates of different
sizes is very different. This study has important implications for understanding the
microstructure and precipitation behavior of Ni-based superalloys. Zheng et al. have
testified that the cooling rate significantly influence the morphology of dendrites [9].
The dendrite arm spacing of both primary and secondary dendrite decline and the
morphology of dendrite transforms from coarse to fine and well developed. In the other
side, the morphology of γ′ precipitates turns different and the distribution of γ′
precipitates becomes more uniform with the decrease of cooling rate [10,11]. It also has
been find that the MC carbide morphologies transformed [12].
GTD222 is a nickel based precipitation hardened isometric crystal superalloy which
is extensively applied in steam turbine area because of its superior thermal resistance
and chemical corrosion resistance. Compared to similar nickel based superalloys,
GTD222 is considered to be one of the most suitable alloys that can be processed into
guide vane of steam turbine under the service temperature of 1000 oC [13]. Some
researches focus on identify the optimized chemistry of GTD222 superalloy [14].
However, little attention have been focused on the solidification behavior of GTD222
superalloy. In this study, an empirical research was carried out to understand the
solidification behavior and microstructural evolution of GTD222 superalloy. The
liquidus temperature and solidus temperature of GTD222 superalloy are also be
measured.
2 Experimental procedures
Table 1. The materials were firstly prepared in a vacuum induction melting furnace, and
then casted into ingots (100×100×150 mm). All specimens used in this work were cut
from the ingot using a spark cutting machine.
The solidification procedure of GTD222 superalloy was revealed by the differential
scanning calorimetry (DSC). Using instrument namd DSC 404 F3 Pegasus, NETCH,
all DSC testes were carried out by alumina crucibles in the argon protection
environment with sample size of 2.5 mm in diameter and 2 mm in height. The cooling
rates of samples were 2.5 K/min, 5 K/min, 10 K/min and 20 K/min respectively.
Microstructural evolution and phase constitutions of GTD222 samples were carried
out on optical microscope (OM), X-raydiffraction (XRD), X-ray energy-dispersive
spectroscopy (EDS) and scanning electronmicroscope (SEM). The samples for OM and
SEM were grinding to 2000 grit, and then polished by the diamond polishing paste (1
μm). The etchant for samples was 45ml CuSO4, 100ml H2O and 50 HCl. Phase
constitutions of the alloy were determined with X-ray diffraction (XRD) technique,
using CuKα (𝜆 = 0.1540562 nm) radiation on a Shimadzu XRD-6000 diffraction
instrument, operating at 40 kV and 30 mA between 30 and 80 deg (2θ) at a step of 0.02 °
and a counting time of 0.6 s per step.
3 Results and discussion
3.1 Microstructure of as-cast alloy
Fig. 1 shows the microstructure of as-cast GTD222 superalloy with different
cooling rate. The microstructure of GTD222 superalloy are typical dendritic structure
in the as-casting samples and no equiaxed grains were found in the Fig. 1. The dendritic
structures in Fig. 1 (b) are coarser than dendritic structures in Fig. 1(a). The secondary
dendritic arm spacing have the same tendency. According to V. Kavoosi, the secondary
dendritic arm spacing is relate to the local cooling rate [15]. The size of the secondary
dendrites directly affects the composition segregation, the second phase and the
alloy is closely related to the tensile strength and elongation. Generally, the smaller the
distance between secondary dendritic arms, the better the mechanical properties. The
high cooling rate refinement of the material grain and dendrite arm spacing, making the
material at ambient temperature performance is improved. In the elevated temperature
environment, the grain boundary becomes weak phase, more grain boundaries will
make the mechanical properties of materials decreased dramatically. Fine dendritic arm
spacing and fine grains make the controlling of cooling rate a contradiction. Fine
dendritic arm spacing promotes the high temperature mechanical properties of the
material. However, the grain refinement weakens the high temperature mechanical
properties of the material. Therefore, it is important to find a suitable cooling rate to
optimize the potential of the material to control the microstructure of the material and
thus to optimize the properties of the superalloy.
3.2 Solidification process
Fig. 2 shows the heating DSC curves of the GTD222 superalloy sample cutting
from the as-casting ingot, the heating rate of the sample is 2.5 K/min. The solidus
temperature of the matrix γ phase can be identified from the heating curve. The value
of γ phase solidus temperature is 1310 °C. The ending temperature of the endothermic
peak correspond to the matrix γ phase is 1380 °C. It is hard to determine the solvus
temperature of the γ′ phase from the heating curve. When the ramp rate is small enough,
for example 2.5 K/min applied in this paper, the measurements of DSC are impossible
to retrieve the melting range values of γ′ phase from the heating curve owing to the
noisy background [3].
All the DSC samples were heated to 1500 °C with the heating rate 2.5 K/min and
held this temperature for 10 minutes, then the samples were cooled to 700 °C with the
cooling rate 2.5 K/min, 5 K/min, 10 K/min and 20 K/min respectively. The relating
DSC curves are shown in Fig. 3. The shape of curves are similar. However, the
intensity of the peak are different. Taking the curve of cooled at 20 K/min as example,
the solidification process will be interpreted in details. As shows in figure 3, there are
three obviously exothermic peaks when the samples were cooling to 700 °C. The first
and largest exothermic peak is relating to the solidification of the matrix phase primary
γ phase. This process can be described as the following formula, L-L+γ. The initiating
temperature of this exothermic peak is 1360 °C, which is close to the other three curves.
However, the ending temperatures of those three exothermic peak curves exist tiny
different. The end temperature of the first exothermic peak of 20 K/min cooling DSC
curve is about 1293 °C, this value is slightly lower than the other curves. The first
exothermic peak followed by a second exothermic peak followed by the end of the
second exothermic peak at about 1281 °C. Then, it is an unobvious exothermic peak
starting at 1122 °C. The heating curve was used to obtain the solidus, and the cooling
curve was used to quote the liquidus [3]. Therefore, from the curves shown in Fig. 2
and Fig. 3, the solidus of GTD222 superalloy can be determined as 1310 °C and the
liquidus can be determined as 1360 °C. Fig. 3 also shows that the exothermic peak of γ
phase is becoming sharper when the cooling rate increased to 10 K/min and 20 K/min
than that the cooling rate is 2.5 K/min, and the non-equilibrium phase transition
temperature decline slightly.
The undercooling of the material increasing as the cooling rate increased. The
enhanced undercooling release large latent heat rapidly and, hence leads to the
recalescence effect, which will remelt the primary γ phase. The re-melted primary γ
phase will solidification again and release the heat [19]. This is why the exothermic
peak of γ phase is becoming sharper. The enhanced undercooling also increases the
driving force of the formation of non-equilibrium phase, promotes the precipitation of
non-equilibrium phase, and the non-equilibrium phase begin to compete with the
primary γ phase. Therefore, dendrites at larger cooling rates are finer than dendrites
obtained at small cooling rates as shown in Fig. 1.
On account of the phases complexity of the GTD222 superalloy, it is arbitrary to
identify what the exothermic peak is refer to merely base on the curve itself. Therefore,
combination with other analytical methods. The phase analysis was carried out using
XRD. The microstructure examination of the DTA samples were implemented and more
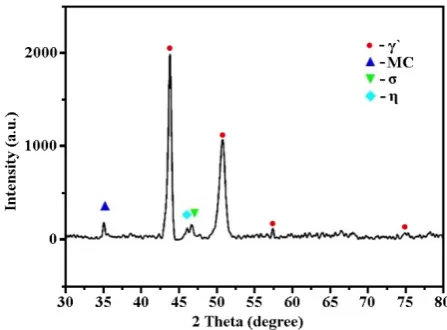
details were found. Fig. 4 is the XRD pattern of GTD222 superalloy cooling at 20
K/min. Figure 4 shows the phases of the GTD222 superalloy, including the γ′ phase,
MC phase and σ phase. Figs. 5-8 show several types of phases discovered in
interdendrite areas of the samples. Fig. 5 is the morphology of γ+γ′ eutectic phase,
which is a typical microstructure of GTD222 superalloy. This phase is densely
distributed in the interdendritic. In fact, only the γ′ phase can be observed in the Fig.5,
because the γ phase was too fragile to resist the corrodent so that the γ phase disappeared
at all. Detecting the chemical composite of the γ/γ′ eutectic phase and primary γ′ phase,
the difference is apparent. It is the segregation that cause the difference of Ti/Al atom
ratio. The morphology of the γ′ phase also varied when the Ti/Al atom ratio changed
[16]. The γ′ phase in γ/γ′ eutectic phase is needle like while the primary γ′ phase is cube
like.
4. Discussion
4.1 Formation of the γ/γ′ eutectic phases
The γ/γ′ eutectic phase is not thermodynamic equilibrium, emergence of this phase
can be attribute to the solution segregation of elements happened during the
solidification of GTD222 superalloy [18]. The segregation behavior of the elements in
alloys is usual although there are differences in element types and content. During the
solidification of GTD222 superalloy, the Al is rejected into the liquid phase
continuously. At last, the content of Al is high enough to form γ/γ′ eutectic phase. The
formation process of γ/γ′ eutectic phase of GTD222 could be depicted as following: the
first emerging phase γ is precipitated in the liquid phase while the Al in the liquid is
rejected into the residual liquid phase; with the increasing of Al content the γ/γ′ eutectic
phase and the Ti is continuously rejected into liquid phase. The formation of the γ/γ′
eutectic phases and γ′ phase during the solidification of GTD222 superalloy should
those two phases completely.
The third phase found in the as casting samples of GTD222 superalloy is the
carbide. Fig. 6(a) is the typical morphology of carbide, which can be identified by the
EDS. The EDS pointing was carried out on the carbide of the DTA samples to give the
elements composition, the results was shown in Fig. 6(b). The elements composition in
Fig. 6(b) represents a typical components of carbide, which is rich in Ti, Nb and Ta
elements. The molar ratio of the metal element (the sum of Ti, Nb and Ta) to the carbon
element is about 1: 1. Based on the outcomes of EDS, the carbide can be as the
MC-type carbide. It is hard to find out the exothermic peak of carbide on the cooling curve
of DSC but the endothermic peak of carbide on the heating curve of DSC can be easily
confirmed.
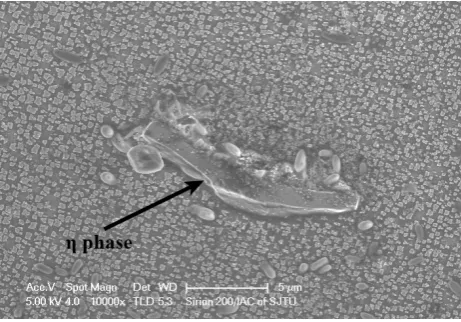
4.2 Formation of the η phase
Some researches confirm that the ultimately formation phase of nickel based
superalloy with B element is boride phase, which is rich of Mo and Cr elements [17].
However, in the present study no Mo or Cr rich phase was found and no exothermic
peak corresponding to boride was found on the DTA curve of GTD222 superalloy. The
distribution mapping of B element is hard to trace owning to its low content. The
formation of η phase marks the end of the solidification process of the GTD222
superalloy.
During the subsequent cooling, the γ′ precipitates start to precipitate from the
matrix γ phase, which corresponds to the third unconspicuous exothermic peak on the
cooling DSC curve. The onset temperature of the third exothermic peak is almost
impossible to determine. This is due to the difference in elements solute distribution
between dendrite area and interdendritic area. As a result, the precipitation temperature
of the γ′ phase is different in different areas. The stack of the exothermic heat of all the
γ′ phases in the different regions forms the third exothermic peak on the cooling DSC
curve and that is why the third exothermic peak temperature range is so large.
Based on the discussion above, the formation sequence of phase during the
solidification of GTD222 superalloy can be summarized as follows: liquid translate into
liquid and γ/γ′ eutectic phase, liquid translate into η phase. The onset temperature of
precipitation of all these phase vary when the cooling rate of alloy changed. When the
cooling rate is 20 K/min, the onset temperature of the second exothermic peak is
1293 °C. Compared with sample cooling at 10 K/min, it can be find that the solidus of
20 K/min sample is slightly lower than the solidus of sample cooling at 10 K/min. The
transformation laws of GTD222 superalloy solidification behavior under different
cooling rates, the solidus temperature and the liquidus temperature are important
components of GTD222 superalloy thermophysical data. Those thermophysical data
are the basis for the design of the alloy casting process and the exploring potential
capacity of superalloy by heat treatment when the GTD222 superalloy are used in parts
having large wall thickness differences.
5. Conclusion
1. The solidification of the GTD222 superalloy proceeds as follows: L→L+γ, L→
L+γ+MC, L→L+(γ/γ′)-Eutectic and L→η phase. Owing to the alloying elements
redistribution, the solidificationthe solidus will be slightly lower. The liquidus of
GTD222 superalloy is 1360°C and the solidus 1310°C.
2. As the cooling rate of increasing from 2.5 K/min to 50 K/min, the dendrite arm
References
[1] Chinnapat Panwisawas, Harshal Mathur, Jean-Christophe Gebelin, Duncan Putman,
Catherine M.F. Rae, Roger C. Reed. Prediction of recrystallization in investment cast
single-crystal superalloys. Acta Materialia, 61 (2013) 51-66.
[2] Bai Kun, Hu Rui, Li Jinshan, Zhou Lian. Grain Refinement of Ni-Cr-W Based
Superalloy by Near Liquidus Casting. Rare Metal Materials and Engineering, 2014,
43(1):0001-0005.
[3] L. A. Chapman, Application of high temperature DSC technique to nickel based
superalloys. Journal of Materials Science, 39 (2004) 7229-7236.
[4] C. Sun, M. Kirk, M. Li, K. Hattar, Y. Wang, O. Anderoglu, J. Valdez, B.P. Uberuaga,
R. Dickerson, S.A. Maloy. Microstructure, chemistry and mechanical properties of
Ni-based superalloy Rene N4 under irradiation at room temperature. Acta Materialia, 95
(2015) 357-365.
[5] F. Zupanic, T. Boncinaa, A. Krizmana, F.D. Tichelaar. Structure of continuously cast
Ni-based superalloy Inconel 713C. Journal of Alloys and Compounds, 329 (2001)
290-297.
[6] Mau-Sheng Chiou, Sheng-RuiJian, An-ChouYeh, Chen-MingKuo, Jenh-YihJuang.
High temperature creep properties of directionally solidified CM-247LC Ni-based
superalloy. Materials Science and Engineering: A, 655(2016)237-243.
[7] P. Kontis, H.A. Mohd Yusof, S. Pedrazzini, M. Danaie, K.L. Moore, P.A.J. Bagot,
M.P. Moody, C.R.M. Grovenor, R.C. Reed. On the effect of boron on grain boundary
character in a new polycrystalline superalloy. Acta Materialia, 103 (2016) 688–699.
[8] Y.Q. Chen, E. Francis, J. Robson, M. Preuss and S.J. Haigh. Compositional
variations for small-scale gamma prime (γ`) precipitates formed at different cooling
rates in an advanced Ni-based superalloy. Acta Materialia, 85 (2015) 199–206.
[9] L. Zheng, C.Q. Gu, Y.R. Zheng. Investigation of the solidification behavior of a new
Ru-containing cast Ni-base superalloy with high W content. Scripta Materialia,
50(2004)435-439.
treatment on γ′ morphological instability in a new Ni-Cr-Co-based powder metallurgy
superalloy. Journal of Alloys and Compounds, 582 (2014) 515-521.
[11] Yongjun Zhang, Yujin Huang, Lin Yang, Jianguo Li. Evolution of microstructures
at a wide range of solidification cooling rate in a Ni-based superalloy. Journal of Alloys
and Compounds 570 (2013) 70-75.
[12] X.W. Li, L. Wang, J.S. Dong, L.H. Lou. Effect of Solidification Condition and
Carbon Content on the Morphology of MC Carbide in Directionally Solidified
Nickel-base Superalloys. Journal of Materials Science and Technology, 2014, 30(12),
1296-1300.
[13] D. W. Seaver, A. M. Beltran. Nickel-Base Alloy GTD-222, a New Gas Turbine
Nozzle Alloy. Journal of Engineering for Gas Turbines and Power, 115, (1993)155-159.
[14] T. Banik, T. C. Deragon, and F. A. Schweizer. The Effects of Ingot Composition
and Conversion on the Mechanical Properties and Microstructural Response of
GTD-222. The Minerals, Metals and Materials Society, 1996, 607-611.
[15] V. Kavoosi, S.M. Abbasi, S.M. Ghazi Mirsaed, M. Mostafaei. Influence of cooling
rate on the solidification behavior and microstructure of IN738LC superalloy. Journal
of Alloys and Compounds, 680 (2016) 291-300.
[16] Litao Change, Hao Jing, Wenru Sun. Solidification behavior of Ni-base superalloy
Udimet 720Li. Journal of Alloys and Compounds, 653(2015) 266-270.
[17] S.M. Seo, I.S. Kim, J.H. Lee, C.Y. Jo, H. Miyahara, K. Ogi. Eta Phase and Boride
Formation in Directionally Solidified Ni-Base Superalloy IN792 + Hf, Metallurgical
and Materials Transactions A, 38(2007) 883-893.
[18] J. Mao, K.M. Chang, W. Yang, K. Ray, S.P. Vaze, D.U. Ferrer, Cooling
precipitation and strengthening study in powder metallurgy superalloy U720LI, Metall.
Mater. Trans. A 32 (2001) 2441-2452.
[19] W. Zhai, W.L. Wang, D.L. Geng, B. Wei, A DSC analysis of thermodynamic
properties and solidification characteristics for binary Cu–Sn alloys, Acta Materialia 60
List of Table Captions
Table 1 Chemistry (wt.%) of GTD222 superalloy.
Table 1 Chemistry (wt.%) of GTD222 superalloy.
C Cr Co W Al Ti Nb B Ta Ni
0.08-0.12 22.2-22.8 18.5-19.5 1.8-2.2 1.0-1.4 2.1-2.5 0.7-0.9 0.002-0.007 0.9-1.1 Bal.
List of Figure Captions
Fig.1. Fig.1. OP and SEM image of as-cast GTD222 superalloy with solification different colling rate, (a) (b) cooling at 2.5 K/min, (c) (d) cooling at 5 K/min, (e) (f) cooling at 10 K/min, (g) (h) cooling at 20 K/min.
Fig. 2. Heating DSC curve of the as-cast GTD222 superalloy with heating rate of 2.5
K/min.
Fig. 3. DSC curves of the alloy cooled from super-solidus temperature, the cooling rates
are 2.5 K/min, 10 K/min and 20 K/min.
Fig. 4. The XRD pattern of as-cast GTD222 superalloy with solification cooling rate at
20K/min.
Fig. 5. Petal γ/γ′ eutectic phases in the interdendritic area of the DSC sample.
Fig. 6. Carbide phase in the solidified DSC sample. (a) is the SEM morphology of
carbide and (b) is the EDS spectrum of carbide in the DSC sample.
Fig.1. OP and SEM image of as-cast GTD222 superalloy at solification different colling rate, (a) (b) cooling at 2.5 K/min, (c) (d) cooling at 5 K/min, (e) (f) cooling at
Fig. 2. Heating DSC curve of the as-cast GTD222 superalloy with heating rate of 2.5
K/min.
Fig. 3. DSC curves of the alloy cooled from super-solidus temperature, the cooling rates are 2.5 K/min, 10 K/min and 20 K/min.
Fig. 5. Petal γ/γ′ eutectic phases in the interdendritic area of the DSC sample.
Fig. 6. Carbide phase in the solidified DSC sample. (a) is the SEM morphology of carbide and (b) is the EDS spectrum of carbide in the DSC sample.