Performance Evaluation Of Image Fusion Techniques And
Its Implementation In Biometric Recognition
V. Divyaloshini, Mrs. M. Saraswathi
ECE Department, Sri Muthukumuran Institute Of Technology, Chennai, India
M. Tech, Assistant Professor, Sri Muthukumuran Institute Of Technology Chennai, India [email protected], [email protected]
Abstract: A Biometric system is essentially a pattern recognition system that makes use of biometric traits to recognize individuals. Authentication systems built on only one biometric modality may not fulfill the Requirements of demanding applications in terms of properties such as performance, acceptability and distinctiveness. Most of the unimodal biometrics systems have problems such as noise in collected data, intra-class variations, inter-class variations, non universality etc. Some of these limitations can be overcome by multiple source of information for establishing identity; such systems are known as multimodal biometric systems. The aim of this paper, regarding multimodal biometric verification, is twofold: on the one hand, to review some fusion strategies reported in the literature and, on the other hand, to implement a biometric system with most suited fusion technique. In this paper three fusion techniques (PCA, DCT & DWT) are analyzed and DWT will be established as a most suited fusion technique for multi modal biometric system of iris, palm print, face and signature. The fused image is then extracted by using Inverse Discrete Wavelet transform.
Keywords: Bio metrics; Image fusion, principal component analysis; Discrete cosine transform; Discrete wavelet transform
I. INTRODUCTION
Biometrics refers to the automatic identification of a person based on his or her physiological or behavioral characteristics. This identification method is preferred over traditional methods involving passwords and personal identification numbers (PINs) for several reasons, including the person to be identified is required to be physically present at the point of identification and/or identification based on biometric techniques obviates the need to remember a password or carry a token. With the increased use of computers as vehicles of information technology, restricting access to sensitive/personal data is necessary. By replacing PINs, biometric techniques can potentially prevent unauthorized access to or fraudulent use of the following:
1. ATMs
2. Cellular phones
3. Smart cards
4. Desktop PCs
5. Workstations
6. Computer networks
PINs and passwords may be forgotten and token-based identification methods such as passports and driver‟s licenses may be forged, stolen, or lost. Thus, biometric systems of identification are enjoying a new interest. Various types of biometric systems are being used for real-time identification. The most popular are based on face recognition and fingerprint matching; however, other biometric systems use iris and retinal scans, speech, facial feature comparisons and facial thermograms, and hand geometry.
II. BIOMETRIC TECHNOLOGY
Biometric technologies are defined as, “automated methods of verifying or recognizing the identity of a living person based on a physiological or behavioral characteristic”. The term „automated methods‟ refers to three basic methods in concern with biometric devices:
1. A mechanism to scan and capture a digital or analog image of a living personal characteristic;
2. Compression, processing and comparison of the
image to a database of stored images; and
3. Interface with applications systems
A. Advantages of Biometrics
1. Biometric traits cannot be lost or forgotten (while passwords can).
2. Biometric traits are difficult to copy, share and distribute
(passwords can be announced in crackers‟ websites).
3. They require the person being authenticated to be present at the time and point of authentication. [1]
B. Common Biometric Features used for Authentication
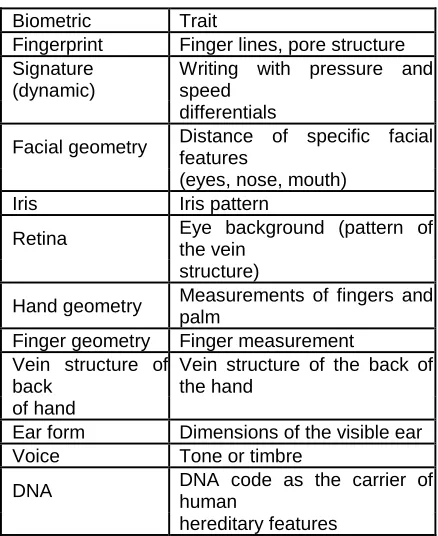
Table 1: List of Biometric Features Biometric Trait
Fingerprint Finger lines, pore structure Signature
(dynamic)
Writing with pressure and speed
differentials
Facial geometry Distance of specific facial features
(eyes, nose, mouth) Iris Iris pattern
Retina Eye background (pattern of the vein
structure)
Hand geometry Measurements of fingers and palm
Finger geometry Finger measurement Vein structure of
back
Vein structure of the back of the hand
of hand
Ear form Dimensions of the visible ear Voice Tone or timbre
DNA DNA code as the carrier of human
C. Different Levels of Fusion
There are four ways in which information from multiple sources are combined such as sensor level, feature level, match score level and decision level. The amount of the information available for fusion decreases after each level of processing in a biometric system. The raw data represents the richest set of information, while final decision contains just an abstract level of information. Further in many practical multimodal biometric systems, early levels of information such as raw data or feature sets may not be available or even if they are available they may not be compatible for fusion. In such cases information obtained at later levels like match score level or decision level can be employed as it is ease to fuse and all commercial devices provide access to scores and decisions. The brief descriptions of four different levels of fusions are described as follows:
C.1. Sensor level fusion
Here raw data obtained from different modalities are fused. The sensor level fusion can be performed only if the sources are either samples of same biometric trait obtained from multiple compatible sensors or multiple instances of same biometric trait obtained using a single sensor [1]. Since sensor level fusion combines the information from different sensors, it requires some preprocessing such as sensor calibration and data registration before performing the fusing.
C.2. Feature level fusion
Feature level fusion consolidates the features obtained from different sources. If obtained features are structurally compatible then feature concatenation is carried out to fuse the features obtained from different sources otherwise concatenation is not possible. Moreover combining the features will introduce a curse of dimensionality and hence either feature transformation or feature selection can be applied to reduce the dimensionality of the fused feature set [1].
C.3. Match score level fusion
Match score is a measure of the similarity between the input and template biometric feature vector. In match score level fusion, the match score obtained from different matchers are combined. Since scores obtained from different matchers are not homogeneous, score normalization technique is followed to map the scores obtained from different matchers on to a same range .
C.4. Decision level fusion
Decision level fusion involves the fusion of decision obtained from different modalities. Since decision level fusion holds binary values it is also called as abstract level fusion .
III. FUSION TECHNIQUES REVIEW
Fusion is a good way to increase the system accuracy and robustness. The image fusion method tries to solve the problem `same object to get a new fused image. Multi-sensor image fusion is the process of combining information from two or more images into a single image. The resulting image contains more information as compared to individual images.
A. Preprocessing of image fusion
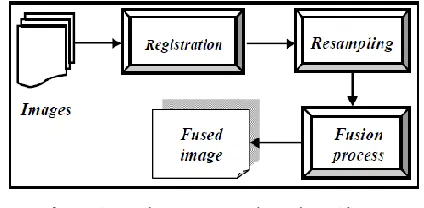
Two images taken in different angle of scene. Most of objects are the same but the shapes change a little. At beginning of fusing images, we have to make sure that each pixel at correlated images has the connection between images in order to fix the problem of distortion; image registration can do this. Two images have same scene can register together using software to connect several control points. After registration, resampling is to adjust each image to fuse to the same dimension. After resampling, each image will be of the same size (Fig. 1). All approaches use pixel-by-pixel fused image. Images with the same size will be easy for fusing process. After the resampling, fusion algorithm is applied. Some time we have to transfer the image into different domain. Inverse transfer is necessary if image has been transferred into another domain .
Fig 1. Generic Image Fusion Flow Chart.
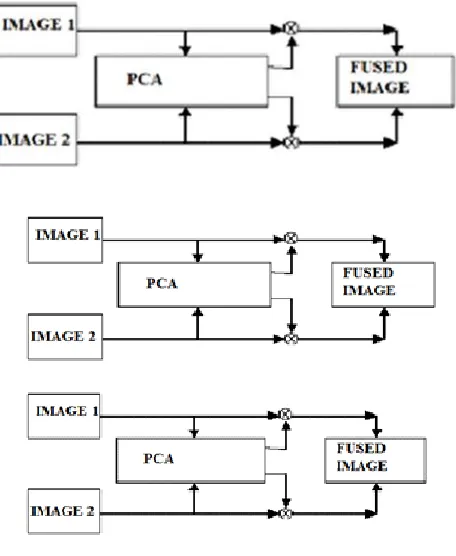
B. Principal Component Analysis
Fig 2. PCA Operation
The weights for each source image are obtained from the eigenvector corresponding to the largest eigen value of the covariance matrices of each source. Arrange source images in two-column vector. Organize the data into column vector. Let S be the resulting column vector of dimension 2 n.
1. Compute empirical mean along each column. The empirical mean vector Me has a dimension 1 2. 2. Subtract Me from each column of S. The resulting
matrix X is of dimension 2 n.
3. Find the covariance matrix C of matrix X i.e. C=XXT
mean of expectation = cov(X).
4. Compute the eigenvectors V and eigenvalue D of C and sort them by decreasing eigenvalue. Both V and D are of dimension 2 2.
5. Consider first column of V which correspond to larger eigenvalue to compute normalized component P1 and P2.
𝐏𝟏= 𝐕𝟏/∑𝐕 and 𝐏𝟐= 𝐕𝟐/∑𝐕 …… (1)
6. The fused image If (x,y) is computed as below if
the input images are I1(x,y) and I2(x,y).
If (x,y)=PI1 (x,y)+PI2 (x,y) ...(2)
C. Discrete Cosine Transform
Normally the digital images are displaying on a screen immediately after they are captured. There are two represent types for digital image that is spatial domain or frequency domain. Spatial domain image can be realizes through our human eyes, but frequency domain use to analysis of spatial domain. In general, human eyes are
more sensitive through the medium and low spatial domain, and the image features with high spatial frequency those could not be realized easily. Discrete Cosine Transformation (DCT) are important to numerous applications in science, engineering and in images compress, like MPGE, JVT, etc. For simplicity, Discrete Cosine Transformation (DCT) can convert the spatial domain image to frequency domain image. Fig. 3 showed that frequency distribution of the image which is converted by Discrete Cosine Transformation (DCT). According to the Fig. 2 showed that images converted can be distributed by 3 parts, the coefficient on the left-top named DC value, others are named AC values. The DC value represents the average illumination and the AC values are coefficients of high frequency. Lee observes that the image has more detail information then some basis in DCT have higher coefficient values. Then it is useful to observe the distribution of AC values by standard deviation.
Fig. 3 Frequency distribution of DCT
C.1 Process Flow Diagram
Images to be fused are divided into non-overlapping blocks of size NxN as shown in Fig-2. DCT coefficients are computed for each block and fsion rules are applied to get fused DCT coefficients. DCT is then applied on the fused coefficients to produce the fused image/block.
Fig 4. DCT operation
The following fusion rule is used for image fusion process, Let the XI be the DCT coefficients of image block from image 1 and similarly let X2 be the DCT coefficients of image block from image 2. Assume the image block is of size N x N and X be the fused DCT coefficients. Here, all DCT coefficients from both image blocks are averaged to get fused DCT coefficients. It is very simple and basic image fusion technique in DCT domain.
X1(k1,k2) = 0.5X1(k1,k2) + X2(k1,k2) …(3)
Where k1, k2= 0,1,2, ... , N-1
is defined by the following equation:
X(k1, k2)=α(k1)α(k2)
∑ ∑ 𝐗(𝐧𝟏, 𝐧𝟐) 𝐜𝐨𝐬(𝛑 𝟐𝐧+𝟏 𝐤𝟏
𝟐𝐍𝟏 ) 𝐍𝟐−𝟏
𝐧𝟐=𝟎 𝐍𝟏−𝟏
𝐧𝟏=𝟎 .
𝐜𝐨𝐬(𝛑 𝟐𝐧+𝟏 𝐤𝟐
𝟐𝐍𝟐 ) ……..(4) For 0≤k1≤N1-1 and 0≤k2≤N1-2
α(K1)= 𝟏
𝐍𝟏 , 𝐊𝟏 = 𝟎 𝟐
𝐍𝟏 , 𝟏 ≤ 𝐊𝟏 ≤ 𝐍𝟏 − 𝟏
…….(5)
and
α(K2)= 𝟏
𝐍𝟐 , 𝐊𝟐 = 𝟎 𝟐
𝐍𝟐 , 𝟏 ≤ 𝐊𝟐 ≤ 𝐍𝟏 − 𝟐
…….(6)
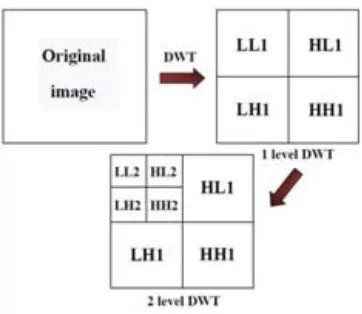
D. Discrete wavelet transform
The third method of this mechanism uses 2-D Discrete Wavelet Transformation (DWT). DWT also converts the image from the spatial domain to frequency domain. According to the Fig. 2, the image is divided by vertical and horizontal lines and represents the first-order of DWT, and the image can be separated with four parts those are LL1, LH1, HL1 and HH1. In additional, those four parts are represented four frequency areas in the image. For the low-frequency domain LL1 is sensitively with human eyes. In the frequency domains LH1, HL1 and HH1 have more detail information more than frequency domain LL1.
Fig. 5 Frequency distribution of DWT
D.1. Process Flow Diagram
Wavelet transform is first performed on each source images to generate a fusion decision map based on a set of fusion rules. The fused wavelet coefficient map can be constructed from the wavelet coefficients of the source images according to the fusion map. Finally the fused images is obtained by performing inverse wavelet transform.
Fig 6. Image Fusion Process using DWT The fusion rule playa very important role during
the fusion process.
DWTx(n) = 𝐝𝐢, 𝐤 = ∑ 𝐱 𝐧 𝐡(𝐧 − 𝟐 𝐣𝐤)
𝐚𝐢, 𝐤 = ∑ 𝐱 𝐧 𝐠 (𝐧 − 𝟐𝐣𝐤) …(7)
The coefficients dj, k refer to the detail components in signal
x(n) and correspond to the wavelet function, whereas aj,k
refers to the approximation components in the signal. The functions h(n) and g(n) in the equation represent the coefficients of the high-pass and low-pass filters respectively, while parameters j and k refer to wavelet scale and translation factors.
D.2. DWT Decomposition
In Discrete Wavelet Transform (DWT) decomposition, the filters are specially designed so that successive layers of pyramid only include details which are not available at the preceding levels. It uses a cascade of a special low-pass and high-pass filter and sub-sampling operator. The outputs from 2D-DWT are four images having equal size to that of the original image. So from the first input image we will have HHa, HLa, LHa, LLa images and from the second image we will have HHb, HLb, LHb, LLb images. LH means low-pass is applied along x and high low-pass filter is applied along y. The LL image contains the approximation coefficients. LH image contains the horizontal coefficients. HH contains diagonal coefficients. HL contains the vertical coefficients. Wavelet transform can be applied at multiple levels. The next level of decomposition is performed using only the LL stage. The result is four sub-images each of equal size to half the LL image size
D.3. Algorithm
The algorithm of image fusion using DWT has following common steps applicable to proposed methods of
1. Accept the two input images.
2. Resize both the images to 256 x 256.
3. Convert to Gray scale image.
4. Convert to double precision format.
D.4. Image fusion using Maximum Pixel replacement 1. Take the pixel having the maximum value of
the two bands i.e. HHa and HHb, and put in HHn.
2. Take the pixel having the maximum value of the two bands i.e. HLa and HLb, and put in HLn.
3. Take the pixel having the maximum value of the two bands i.e. LHa and LHb, and put in LHn.
4. Take the pixel having the maximum value of the two bands i.e. LLa and LLb, and put in LLn.
5. Thus we will get HHn,HLn,LHn and LLn as new coefficients .
6. Take Inverse Discrete Wavelet Transform.
7. Obtain the fused Image and Display .
D.5. Image Fusion using Pixels Averaging
1. Take the average of pixels of the two bands i.e. HHa and HHb, and put in HHn
2. Take the average of pixels of the two bands i.e. HLa and HLb, and put in HLn.
3. Take the average of pixels of the two bands i.e. LHa and LHb, and put in LHn.
4. Take the average of pixels of the two bands i.e. LLa and LLb, and put in LLn.
5. Thus we will get HHn,HLn,LHn and LLn as new coefficients.
6. Take Inverse Discrete Wavelet Transform.
7. Obtain the fused Image and Display.
Following images are results of fusion process with PCA, DCT & DWT fusion techniques,
Fig. 7(a). First Input Fig. 7(b). Second Input
Fig.7(c) Fused Image-PCA Fig.7(d)Fused Image- DCT
Fig.7(e) Fused Image-DWT Fig.7(e)Fused Image-DWT
(Pixel Averaging) ( Max. Pixel Replacement)
Fig. 8 Comparison between DCT and DWT
IV. PERFORMANCE EVALUATION
Image Quality Measurement (IQM) is vital in the development of image processing algorithms such as enhancement, blurring, denoising etc. as it can be used to evaluate their performances in terms of the quality of processed image. The Mean Square Error (MSE) and the Peak Signal to Noise Ratio (PSNR) are the two error metrics used to compare image compression quality. The MSE represents the cumulative squared error between the compressed and the original image, whereas PSNR represents a measure of the peak error. To compute the PSNR, the block first calculates the mean-squared error using the following equation:
MSE = 𝟏
𝐌𝐍∑ ∑ [𝐈 𝐢, 𝐣 − 𝐤 𝐢, 𝐣 ]
𝐍−𝟏 𝐣=𝟎 𝐌−𝟏 𝐢=𝟎
𝟐
…..(8)
In the previous equation, M and N are the number of rows and columns in the input images, respectively. Further, the block computes the PSNR using the following equation:
PSNR = 𝟏𝟎𝐥𝐨𝐠𝟏𝟎(𝟐𝟓𝟓𝟐
𝐌𝐒𝐄) ……(9)
NCC = ∑(𝐢,𝐣)𝐰𝐈𝟏(𝐢,𝐣)𝐈𝟐(𝐱+𝐢,𝐲+𝐣) ∑(𝐢,𝐣)𝐰𝐈𝟏(𝐢,𝐣)𝟐 ∑(𝐢,𝐣)𝐰𝐈𝟐(𝐱+𝐢,𝐲+𝐣)𝟐
……….(10)
Normalized Absolute Error (NAE) is the numerical difference between the original and reconstructed image. The large value of NAE means that image is of poor
quality.NAE is defined as:-
NAE = ∑ ∑ 𝐗 𝐢,𝐣 −𝐗 (𝐢,𝐣) 𝐍
𝐣=𝟏 𝐌 𝐢=𝟏
∑ ∑𝐍 𝐗(𝐢,𝐣) 𝐣=𝟏 𝐌 𝐢=𝟏
…..(11)
TABLE 2:The following table demonstrates the various measures for different image fusion techniques
From above table, it can be concluded that, PCA and DCT based image fusion technique can be used for applications which does not require high quality and precision. Whereas DWT based fusion techniques provide us good quality fused images than PCA and DCT based techniques.
V. MULTIMODAL BIOMETRIC SYSTEM
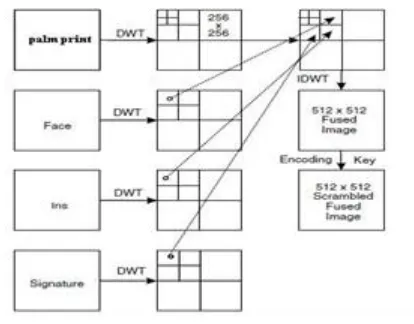
Proposed is the Multimodal Biometric System in which more than one feature is extracted from user and these images are converted into fused image and authentication is provided. A generic biometric sy stem has 4 main modules namely a) Sensor module, b) Feature extraction module, c) Matching module, d) Decision module. In our proposed system the input that is face, iris, palmprint and signature is collected and Discrete Wavelet Transform is applied to the image The wavelet representation of an image has the property that the image can be recovered without any information loss. Many researches showed that multi resolution transforms in wavelet are very useful for image fusion. First, the DWT of each of the two or more images is computed. Then, the wavelet coefficients are fused using the developed fusion rule in the wavelet transform domain. Specifically, the wavelet coefficients are fused using different combining rule for low frequency band and high frequency band respectively. Finally, the fused image is formed by using inverse DWT (IDWT) This proposed system provides a highly accurate result and More security to provide secured access to the database. The authentication is provided by analyzing the data in four phases. Such as Sensor phase, Fusion phase Extraction phase and Recognition phase.
VI. DISCRETE WAVELET TRANSFORM
The image is obtained from the user. DWT technique is applied to the obtained image. This technique splits the image into four components and Low-Low component(Coarse component) is obtained. This obtained Low frequency image is further subjected to DWT .The finally obtained image is the gathered from each input. The obtained low frequency images are fused into single image by using IDWT technique. Finally encoding is done and the fused image is stored in the database.
Fig 9 Discrete Wavelet Transform working
VII .SYSTEM ARCHITECTURE
The user enters the system by giving the database name and password. Then the images stored in the database is fetched and Discrete Wavelet Packet Transform technique is applied for that database image. This splits the image Fusion Methods
Quality Measures
Peak Signal to noise ratio
Mean Square Error
Normalize d Absolute error
Maximum Differenc e
Average Difference
Normalize d Cross-Correlation
Structural Content
PCA 30.7729 54.4246 0.0463 67.9043 -0. I 728 0.9989 0.9991
DCT 30.9663 52.0536 0.0441 73.6046 -0.1718 1.0012 0.9945
DWT
Pixel
Averaging 78.9555
8.2704e
-004 0.0460 0.2647
-6.7379e-004 0.9989 0.9991 Maximum
Pixel Replacem ent
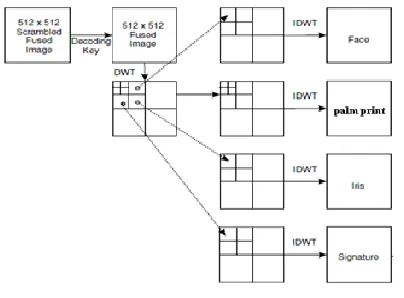
stored in fused form into low-low frequency components (Coarse grained components) This contains all the four inputs in gray scale . Then image is obtained from the user which is then subjected to Discrete Wavelet Transform then the obtained image is compared with the image in database. Based on the matching pattern authentication is provided.
Fig 10. System Architecture
Wavelet transformation splits the image into high-frequency and low frequency components for four biometric image. Then the coarse component is taken into consideration which contains entire detail of image. The proposed biometric data fusion algorithm (DWT) uses the palm print, face, iris, and signature images of an individual, to generate a single composite multimodal biometric image and then fused multi-modal biometric image is scrambled and store in database. In recognition process, the image obtained after descrambling is extracted by using the same wavelet bases. Finally signature recognition system by DWT of both, then sort out the first 13 elements in descending order of absolute magnitude. Then comparison is done between the two vectors.
VIII.CONCLUSION
This experiment result clearly demonstrate that the feature vector consisting of coarse component images can be handled easily in MATLAB and consumes less data base space with high accuracy. By combining the iris, palm print, face and signature recognition scheme the accuracy of the recognition can be improved. It is also impossible to reconstruct original image from fused images which makes system more secure and reliable.
REFERENCES
[1]. Ajay Kumar, Vivek Kanhangad and David Zhang (2010) „New frame work for adoptive multi modal biometrics management‟, IEEE transactions on Information Forensics and Security, Vol.5, pp.92-102.
[2]. Anu S, Nair H, Aruna P and Vadivukarassi M (2013) „PCA BASED Image Fusion of Face And Iris Biometric Features‟, International Journal on Advanced Computer Theory and Engineering (IJACTE), Vol. 1, Issue 2, pp.106-112.
[3]. Arun Ross, Anil Jain and Jian-Zhong Qian (2001) „Information fusion in Biometrics‟ Proc. 3rd International Conference on Audio- and Video-Based Person Authentication (AVBPA), pp. 354-359.
[4]. Bedi S S, Mrs.JyotiAgarwal and PankajAgarwal(2013) „Image fusion techniques and quality assessment parameters for clinical diagnosis: A review‟ International Journal of Advanced Research in Computer And Communication Engineering, Vol. 2, Issue 2, pp.1153-1157.
[5]. Chung-ChihTsai, Heng-Yi Lin, JinshiuhTaur, and Chin-Wang Tao (2012) „Iris Recognition Using Possibilistic Fuzzy Matching on Local Features‟, IEEE Transactions on systems, man, and cybernetics-part B: Cybernetics, Vol. 42, No.1, pp.150-162.
[6]. Deepak Kumar Sahu and M.P.Parsai (2012) „Different Image Fusion Techniques –A Critical Review‟, International Journal of Modern Engineering Research (IJMER), Vol. 2, Issue 5, pp.4298-4301.
[7]. Hariprasath S and Prabakar T N (2012) „Multimodal Biometric Recognition Using Iris Feature Extraction and Palm print Features‟, Proc. IEEE-International Conference On Advances In Engineering, Science And Management pp. 174-179.
[8]. JameerBasha A, Palanisamy V and Purusothaman T (2011) „Efficient Biometric authentication using fast finger print verification and enhanced Iris features‟, Journal of Computer Science 7-(5), pp.698-706.
[9]. John G. Daugman (1993) „High confidence visual recognition of persons by a test of statistical independence‟, IEEE transactions on pattern analysis and machine intelligence, volume 15, No.11, pp. 1148-1161.
[10]. John G. Daugman (1988) „Complete Discrete 2-D Gabor Transforms by Neural Networks for image analysis and compression‟, IEEE Transactions on Acoustics, Speech, and Signal Processing, Vol.36, No.7, pp.1169-1179.
[11]. Kekre H B, Bharadi V.A, Singh V.I, V.Kaul and Nemade B (2011) „Hybrid multimodal biometric recognition using Kekre‟s Wavelets, 1D Transforms and Kekre‟s vector quantization Algorithms based feature extraction of Face and Iris‟, Proc. 2nd
International Conference and workshop on Engineering trends in Technology, pp.29-34.
Journal of Emerging Technology and Advanced Engineering, Vol. 3, Issue 5, pp.288-291.
[13]. MohamadSoltane, NoureddienDoghmane and NoureddineGuersi (2010) „Face and Speech based multi-modal Biometric Authentication‟, International Journal of Advanced Science and Technology ,Vol.21, pp.41-56.
[14]. Yocky D D , Image merging and data fusion by means of the discrete two-dimensional wavelet transform, J. Opt. Soc. Am. A 12(9), 1834–1841 (1995).