Design, Development And Implementation Of A Smart And
Economically Viable Solar Power Charge Controller
.
1
AMUDA F.A
2MUSTAPHA M.
1,2 Electrical Engineering Department Hussaini Adamu Federal Polytechnic, Kazaure Jigawa State, Nigeria.
ABSTRACT:- A Smart and economically viable solar power charge controller has been design and implemented. The system was implemented using Arduino Microcontroller. The microcontroller was used in order to make the system smart, robust and simple. The system was tested under different atmospheric conditions. The result obtained shows that the developed charge controller performs efficiently. The system is also shown to be economically viable as the major component in its development is the Arduino microcontroller.
I.
INTRODUCTION.
Electricity is one of the most essential needs for humans in the present. Conversion of solar energy into electricity does not only improve generation of electricity but also reduces pollution from fossil fuels. The output power of solar panel depends on solar irradiance, temperature and the load impedance. As the load impedance is dependent on application, a dc-dc converter is used for improving the performance of solar panel [12].
Solar PV is one of the renewable energy sources used in present days technology. PV has many benefits especially in environmental, economic and social aspects. In general, a PV system consists of a PV array which converts sunlight to direct-current electricity, a control system which regulates battery charging, and the load [12]
A charge controller is one of functional and reliable major components in PV systems. A good, solid and reliable PV charge controller is a key component of any PV battery charging. The main function of a charge controller in a PV system is to regulate the voltage and current from PV solar panels into a rechargeable battery. Solar charge controllers play an important part in isolated solar systems. The minimum function of a solar charge controller is to disconnect the array when the battery is fully charged and keep the battery fully charged without damage. This goal is to ensure the batteries are working in optimal conditions, mainly to prevent overcharging (i.e. by disconnecting solar panel when batteries are full) and too deep discharge (by disconnecting the load when necessary). It also offers protection against the reverse current flow at night back to the PV [14]
This research was implemented to overcome the challenges of previous works. It has the advantage of adding a microcontroller (ATMEGA328P-PU) chip, liquid crystal display (LCD) for readability of the voltage across the solar panel and, also the battery, this work operates during day and/ or night, it has the advantage of connecting DC load on the system, simple and economically viable.
II.
DESIGN AND IMPLEMENTATION
In this section, we present the design of the solar charge controller. By knowing design specification and available input parameters, we can have an accurate and simple relationship between the input and output to perform the require task.
III.
DESIGN PROCEDURES
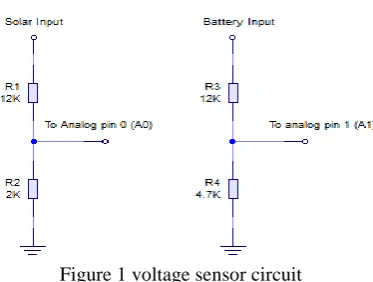
The developed charge controller consists the following units: 1. Voltage sensing
Figure 1 voltage sensor circuit
The charge controller was designed for a 6V, 5w battery and, 16V solar panel. Higher voltage values can be implemented by changing the divider resistors values.
Software code ADC Calibration :
actual volt/divider output= 3.127 2.43 V is eqv to 520 ADC 1 is eqv to .004673V
ARDUINO CODE:
for(int i=0;i<150;i++)
{ sample1+=analogRead(A0); //read the input voltage from solar panel sample2+=analogRead(A1); // read the battery voltage
delay(2); }
sample1=sample1/150; sample2=sample2/150;
solar_volt=(sample1*4.673* 3.127)/1000; bat_volt=(sample2*4.673* 3.127)/1000;
V.
PWM SIGNAL GENERATION
PWM (pulse width modulation) is a technique that is simply used to control a digital output signal by switching it on and off very quickly, by varying the width of the on/off duration, it will give the effect of varying the output voltage [11].
Vout = Ton
(Ton + Toff) × Vin
Time period (T) = Ton + Toff So Vout = Ton
T × Vin
Where 𝑇𝑜𝑛
(𝑇𝑜𝑛 +𝑇𝑜𝑓𝑓 ) × 100 or 𝑇𝑜𝑛
𝑇 × 100 is called Duty Cycle
VI.
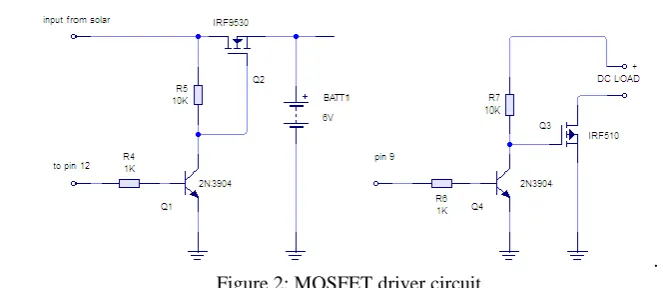
MOSFET SWITCHING AND DRIVER
. Figure 2: MOSFET driver circuit
This circuit is really important in this PV charge controller in order to amplify and translate the PWM signal from Arduinor microcontroller (ATMEGA328) to trigger POWER MOSFET (IRF9530 and IRF540 this MOSFET can withstand up to 100v) gate and the high output.
Calculation of components values
A resistor RB is connected to the base of the transistor to limit the maximum current through the base circuit to
4mA, and the value of RB was obtained as follows;
VBB – IBRB – VBE = 0
VBB = +5V, (maximum input signal from microcontroller), VBE = 0.7V
5 − (4 × 10⁻³× R
B) − 0.7 = 0
0.004 RB = 5 – 0.7 = 4.3
RB = 4.3
0.004= 1070 ≈ 1.07 KΩ
RB = 1KΩ was used
In order to limit the maximum collector current (Ic) to 1.2mA when the output of the transistor is low, a pull up
resistor is connected between +12V supply. VCC – ICRC – VCE = 0
12 – ICRC – 0 = 0 (VCE = 0 at saturation)
12 − (1.2 × 10⁻³× R
c) − 0 = 0
12 – (0.0012 Rc) = 0
0.0012 Rc= 12
Rc= 12
Figure3: Proteus Software Circuit Implementation
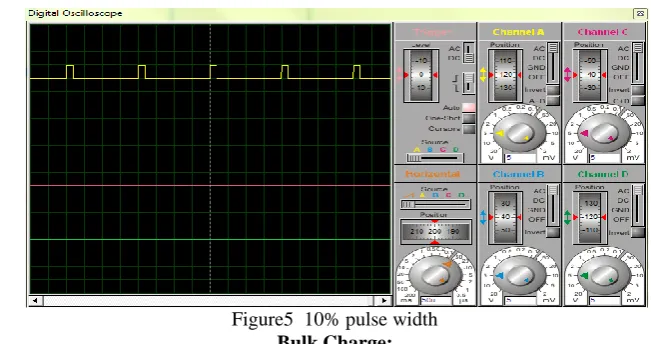
Oscilloscope was used to get the PWM output from the microcontroller. The PB5SACK pin generates square waves. Therefore, the 12th pin of the microcontroller was connected to the Channel A of the oscilloscope. The output of three different voltage of the battery cell is given thus.
Not Charging:
In the figure below it shows that the duty cycle of PWM is zero (0%), which mean the battery is not charging from the solar panel this is because the voltage of the battery is below 6.0vor the voltage drown from the solar panel is less than the battery voltage.
`Figure4: No charge
DIGITAL (~PWM) ANALOG IN ATM EG A32 8P-PU 112 1 ~~ ~ ~~ ~ T
X R X P D 0 /R X D 0 P D 1 /T X D 1 P D 2 /I N T 0 2 P D 3 /I N T 1 3 P D 4 /T 0 /X C K 4 P D 5 /T 1 5 P D 6 /A IN 0 6 P D 7 /A IN 1 7 P B 0 /I C P 1 /C L K O 8 P B 1 /O C 1 A 9 P B 2 /S S /O C 1 B 1 0 P B 3 /M O S I/ O C 2 A 1 1 P B 4 /M IS O 1 2 P B 5 /S C K 1 3 A R E F P C 5 /A D C 5 /S C L A 5 P C 4 /A D C 4 /S D A A 4 P C 3 /A D C 3 A 3 P C 2 /A D C 2 A 2 P C 1 /A D C 1 A 1 P C 0 /A D C 0 A 0 R E S E T ARD1
ARDUINO UNO R3
Figure5 10% pulse width
Bulk Charge:
It is when voltage is between 7.1 V to 7.4Vof it fully charged. Duty cycle used: 90 %
Figure 6 90% pulse width
TESTING
After the completion of the project, various test and measurements were carried out on the circuit to ascertain its workability. These include continuity test, short circuit and open circuit tests, dc voltage level tests; these were done using a digital multimeter.
The assurance of project work was determined by testing, which makes it necessary to test the circuit during and after construction. The main three test where carried out during the construction. These tests are stated below. i. Temporary test
ii. Permanent test iii. Final Test after casing
Temporary Test
Figure.7 Diagram of Temporal Construction
Permanent Test
This is a kind of test that takes place after construction that is after fixing the components in the pin solder terminal of the permanent board ( vero board). The short circuit test, open circuit test and continuity test were carried out, so as to make sure the proper working of the circuit before the casing of the entire system, as it‟s pictorially shown below.
Figure8 Diagram of Permanent Construction
Final Test after Casing
The time taken to recharge any battery is dependent on the voltage and current applied to it. If the recharged current or voltage is too low, then the recharge time will be relatively long; if the current or voltage is high then the recharge time will be short. After construction and casing of project, the readings were taken using 12V/ 5W solar panel and 6V/ 4.5h lead-acid rechargeable battery. This test was carried out and the result was tabulated below (4.3).
VII.
RESULTS
Table 4.1 Result Obtained
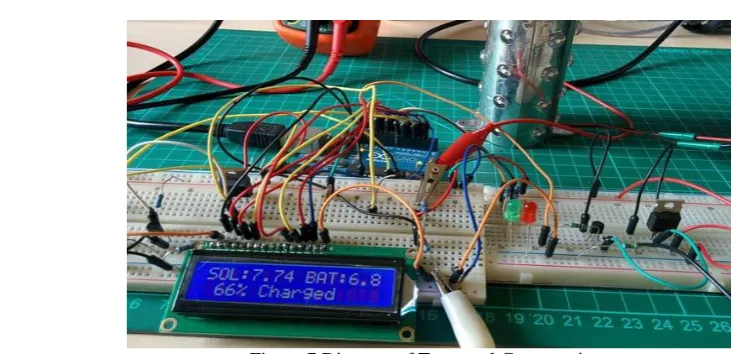
from the solar panel is too low to charge the battery or if the charging battery is bad. Below is the pictorial diagram of the complete system under testing.
Figure.9 Pictorial Diagram of Complete Constructed Solar Charge Controller During Test.
VIII.
DISCUSSION OF RESULTS
The reading taken from this test which is tabulated above was at random time, and It was observed that, the battery took much of time before it riches above 90% (i.e full charge mode) level and this is because of the current drown from the 5Wsolar panel is very small and the test was conducted in cloudy day when there is no maximum sun light.
REFERENCES
[1] B.L. Theraja and A.K. Theraja (2005): “A text book of electrical Technology”. S. Chand & Company Ltd, Ram Nagar, New Dehli. pp1116 - 1123
[2] Banzi, M. (2008, october 1). ATmega328. Retrieved april 22, 2013, from arduino: www.arduino.cc [3] Ferdausi, M. (2010). “charge controller for solar charging station”. BRAC University, Dhaka, Bangladesh [4] J.B. Gupta (2009): “Electronics Devices and Circuits”. S.K. Kataria & sons, Daryaganj Delhi. P78 [5] James P. Dunlop, P.E. et al, “Batteries and Charge Controller in Stand-Alone Photovoltaic Systems
fundamentals and applications”
[6] KORENČIAK, P. (2011) “Charge controller for solar panel based charging of lead-acid batteries”. Brno University of Technology, Faculty of Electrical Engineering and Communication,
[7] R. M. Dell, David Anthony James Rand, Understanding Batteries (Royal Society of Chemistry, 2001) [8] R.L. Boylestad and L. Nashelsky (1996). "Electronic Devices and Circuit Theory", Prentice Hall, seventh
edition, London, pages 46-52.
[9] Sciencedaily “World record solar cell with 44.7% efficiency” sciencedaily. Retrieved 2014-10-12 [10] Woodworth, Joseph (1994), „Evaluation of the Batteries and Charge Controllers in Small Stand-Alone
Photovoltaic Systems.‟ Sandia National Laboratory.
[11] Pariyanka P, Rakesh K.J,(2016). Design and development of charge controller for 5kw wind Turbine. International Journal of Science Technology Management and Research vol1, issue3.
[12] Mara K, Michele L.C.(2016) A Review of current energy systems and green energy potential in Kazakhstan. Renewable and sustainable energy review Vol55 pg 491-504.
[13] Atiqur M,R, Matin M.A, Apurba S, Rubaiat U (2015). A Cost Effective Solar charger control. Journal of Engineering and Technology vol 14