Vascular Health and Risk Management
Dove
press
O R i g i n a l R e s e a R c H
open access to scientific and medical research
Open access Full Text article
Reduction in cardiovascular risk using a proactive
multifactorial intervention is consistent among
patients residing in Pacific Asian and non-Pacific
asian regions: a cRUcial trial subanalysis
eun Joo cho1
Jae Hyung Kim1
santosh sutradhar2
carla Yunis2
Mogens Westergaard2
On behalf of the cRUcial trial investigators
1Department of cardiology, st Paul’s Hospital, The catholic University of Korea, seoul, Korea; 2Pfizer inc., new York, nY, Usa
correspondence: Jae Hyung Kim Department of cardiology, st Paul’s Hospital, The catholic
University of Korea, 620-56, Jeonnong-dong Dongdaemoon-gu, Seoul, 130-709, South Korea
Tel +82 2 958 2388
Fax +82 2 968 7250
email [email protected]
Background: Few trials have compared different approaches to cardiovascular disease prevention among Pacific Asian (PA) populations. The Cluster Randomized Usual Care versus Caduet Investigation Assessing Long-term-risk (CRUCIAL) trial demonstrated that a proac-tive multifactorial intervention (PMI) approach (based on single-pill amlodipine/atorvastatin) resulted in a greater reduction in calculated Framingham 10-year coronary heart disease (CHD) risk compared with usual care (UC) among hypertensive patients with additional risk factors. One-third of CRUCIAL patients resided in the PA region. The aim of this subanalysis was to compare two approaches to cardiovascular risk factor management (PMI versus UC) among patients residing in PA and non-PA regions.
Methods: This subanalysis of the CRUCIAL trial compared treatment-related changes in cal-culated CHD risk among patients residing in PA and non-PA regions. Sensitivity analyses were conducted among men and women and those with and without diabetes.
Results: Overall, 448 patients (31.6%) resided in the PA region and 969 patients (68.4%) resided in non-PA regions. The PMI approach was more effective in reducing calculated CHD risk versus UC in both PA (−37.1% versus −3.5%; P,0.001) and non-PA regions (−31.1% versus −4.2%; P,0.001); region interaction P=0.131. PA patients had slightly greater reductions in total cholesterol compared with non-PA patients. PA patients without diabetes had slightly greater reductions in CHD risk compared with non-PA patients. Treatment effects were similar in men and women and those with diabetes.
Conclusion: The PMI approach was more effective in reducing calculated Framingham 10-year CHD risk compared with UC among men and women with and without diabetes residing in the PA and non-PA region.
Keywords: cardiovascular disease, risk factors, hypertension, clinical trial, antihypertensive agents, anticholesteremic agents
Introduction
Relatively few trials of cardiovascular (CV) treatment regimens have been conducted specifically among Pacific Asian (PA) populations.1–3 This is of particular importance
given the reported differences between Asian and Western populations in CV risk factor prevalence,4 disease outcomes,5 and response to treatment strategies.6,7 Furthermore, in
2005, over half of the cases of CV disease worldwide occurred in the PA region, and this is predicted to rise further as parts of this region continue to undergo a process of rapid urbanization.8
Vascular Health and Risk Management downloaded from https://www.dovepress.com/ by 118.70.13.36 on 27-Aug-2020
For personal use only.
Number of times this article has been viewed
This article was published in the following Dove Press journal: Vascular Health and Risk Management
Dovepress
cho et al
Population surveys have reported that compared with Western populations, Asian populations have lower total cholesterol (TC) and body mass index, a higher prevalence of stroke than coronary heart disease (CHD), and more hemorrhagic than ischemic stroke.4,5 Additionally, analyses
of large hypertension outcome trials have suggested that there may be ethnic differences in the efficacy and toler-ability of different antihypertensive agents.6,9 For example,
in the Anglo-Scandinavian Cardiac Outcomes Trial – Blood Pressure Lowering Arm, patients of Asian origin had a greater blood pressure (BP) reduction in response to treatment with amlodipine plus perindopril compared with those described as “White” ethnic origin.9 In the Ongoing Telmisartan Alone
in Combination with Ramipril Global Endpoint Trial and the Telmisartan Randomised Assessment Study in Intolerant Subjects with Cardiovascular Disease studies, compared with ramipril, telmisartan was reported to be better tolerated in Asian patients versus non-Asian patients.6
The Cluster Randomized Usual Care versus Caduet Investigation Assessing Long-term-risk (CRUCIAL) trial compared two approaches to CV risk factor management among patients with hypertension and additional CV risk factors.10 The CRUCIAL trial demonstrated that a
multi-factorial approach (implemented by including single-pill amlodipine/atorvastatin [SPAA] in the patients’ treatment regimen) resulted in a greater reduction in calculated 10-year Framingham CHD risk11 compared with approaching risk
reduction in the usual manner.10 SPAA was chosen to
imple-ment the multifactorial strategy for several reasons. Firstly, the efficacy and safety of SPAA has been demonstrated in several international studies;12,13 secondly, both amlodipine
and atorvastatin have outcomes data from previous clinical trials;14,15 and thirdly, SPAA has been shown to be superior
to multiple pill regimens in respect to patients’ compliance and adherence.16,17
In the CRUCIAL trial, one-third of patients resided in the PA region. This provided an opportunity to investigate whether the findings of the CRUCIAL trial are consistent among patients residing in the PA and non-PA region. Thus the aim of this CRUCIAL trial subanalysis was to compare two approaches to CV risk factor management (a multifacto-rial approach based on SPAA versus usual care [UC]) among patients residing in PA and non-PA regions.
Materials and methods
study design and patients
This CRUCIAL trial subanalysis compared baseline and endpoint data among 448 patients (31.6%) residing in the
PA region and 969 patients (68.4%) residing in non-PA regions. The CRUCIAL trial design and principal results have previously been published.10,18 In brief, the CRUCIAL
trial was a 12-month, prospective, multinational, open-label, parallel-design, cluster-randomized trial. Eligible patients were men and women aged between 35 and 79 years, at baseline with hypertension (untreated: systolic blood pressure [SBP] $160 mmHg and/or diastolic blood pressure [DBP] $100 mmHg; treated: SBP $140 mmHg and/or DBP $90 mmHg; diabetes SBP .130 mmHg and/or DBP .80 mmHg), three or more additional CV risk fac-tors, no history of CHD, TC #6.5 mmol/L, and who were not receiving statin therapy. Two treatment strategies were compared: a proactive multifactorial intervention (PMI) strategy, based on SPAA, and UC (Figure 1). PA patients were recruited from South Korea, Indonesia, Taiwan, the Philippines, Malaysia, and Thailand. Non-PA patients were recruited from the Middle East (Jordan, Kuwait, Lebanon, United Arab Emirates), Europe (Croatia, Czech Republic, Russia, Turkey), and Latin America (Costa Rica, Dominican Republic, Mexico, Panama, Venezuela).10,18
Outcome measures
The primary endpoint in this subanalysis was the treatment-related reduction in calculated 10-year Framingham CHD risk after 52 weeks of follow-up among patients residing in PA and non-PA regions. Secondary efficacy measures included the absolute change between baseline and week 52 in SBP and DBP, percentage change in low-density lipoprotein cholesterol (LDL-C) and TC, and percentage of patients at BP/LDL-C treatment goals based on the seventh report of the Joint National Committee on Prevention, Detection, Evaluation, and Treatment of High Blood Pressure19 and the
National Cholesterol Education Program Adult Treatment Panel-3 (NCEP ATP-III)20 at week 52.
The study-specific BP targets were SBP ,140 mmHg and DBP ,90 mmHg (or SBP , 130 mmHg and DBP ,80 mmHg among those with diabetes).19 In the CRUCIAL trial, the
investigator was responsible for defining the cholesterol target according to local clinical practice. However, the NCEP ATP III LDL-C goals were provided to the investigators as a guide and were used in our analyses (,130 mg/dL for patients with a baseline calculated Framingham 10-year CHD risk
#20%, and ,100 mg/dL for those at .20% 10-year CHD risk).20 Adverse events (AEs) were also evaluated in the two
regions.
Two sensitivity analyses were conducted to compare treatment effect: among men and women residing in PA
Vascular Health and Risk Management downloaded from https://www.dovepress.com/ by 118.70.13.36 on 27-Aug-2020
Dovepress CRUCIAL Pacific Asian versus non-Pacific Asian regions
and non-PA countries and among patients with and without diabetes in the two regions.
statistical analyses
For continuous endpoints, differences in least square mean difference, 95% confidence intervals (CI), and the corre-sponding P-values were calculated using a mixed-effects linear model that included baseline value, country, and treat-ment as covariates. For dichotomous categorical endpoints, odds ratios, 95% CI, and the corresponding P-values were calculated using a generalized linear mixed model that included treatment in the model. A compound-symmetry variance–covariance matrix was used for patients from the same investigator. All statistical tests were two-sided and evaluated at the 5% significance level. Last observation car-ried forward was used for missing measurements.
For continuous endpoints, interaction P-values were cal-culated based on a mixed-effects linear model that included baseline value, treatment, indicator for PA status, and treatment-by-PA interaction term in the model. For dichoto-mous categorical endpoints, interaction P-values were calcu-lated based on a generalized linear mixed model that included
treatment, indicator for PA status, and treatment-by-PA interaction term in the model. Continuous variables were summarized as mean values ± standard deviation (SD), and categorical variables as counts and percentages.
Results
Participating countries
The majority of the PA patients enrolled in the CRUCIAL trial resided in South Korea (35.4%), followed by Indonesia (21.4%), Taiwan (16.9%), the Philippines (15.3%), Malaysia (6.5%), and Thailand (4.5%). The greatest proportion of patients among non-PA patients resided in Croatia (19.0%), followed by Russia (17.5%), the Czech Republic (12.4%), and Mexico (10.2%).
Baseline characteristics
At baseline, compared with non-PA patients, those in the PA group were more likely to be male (63.4% versus 46.9%;
P,0.001), of older age (62.5 years versus 59.1 years;
P,0.001), have higher triglyceride levels (170.9 mg/dL versus 161.5 mg/dL; P=0.049), and were 1.7 times more likely to have diabetes (58.7% versus 34.8%; P,0.001).
657 UC arma
201 PA 456 non-PA Uncontrolled cardiac arrhythmias or CHF
Fasting TGs ≥6.78 mmol/L (600 mg/dL) Diabetes and HbA1c >9.0%
Stroke/TIA <3 months before enrolment Statin <6 months before enrolment History of CHD
2,514 patients screened
Investigators cluster randomized 70 patients did not receive allocated
treatment
44 patients did not have ≥1 postbaseline efficacy measurements
760 PMI arma
247 PA 513 non-PA
Male or female, 35–79 years Hypertensionb
TC ≤6.5 mmol/L (250 mg/dL) untreated 6 months before enrolment
≥3 additional CV risk factors 1,531 eligible patients 983 screen failures
12 months follow-up
686 completed 228 PA 458 non-PA
74 discontinued 19 PA, 55 non-PA Death (1 PA, 3 non-PA) AE (8 PA, 21 non-PA)
Withdrawn consent (7 PA, 18 non-PA) Lost to follow-up (1 PA, 10 non-PA) Other (2 PA, 3 non-PA)
628 completed 183 PA 445 non-PA
29 discontinued 18 PA, 11 non-PA Death (1 PA, 1 non-PA)
Withdrawn consent (7 PA, 1 non-PA) Lost to follow-up (7 PA, 8 non-PA) Other (3 PA, 1 non-PA)
Figure I Flow of PA and non-PA patients through the CRUCIAL trial.
Notes: aTreatedpatients with baseline and one or more postbaseline efficacy measurements. For one PMI investigator from a non-PA region, four out of 18 patients received Uc during the treatment period and were analyzed in the Uc arm for the safety population and in the PMi arm for the full analysis set; bhypertension: untreated: sBP $160 mmHg and/or DBP $100 mmHg; treated: sBP $140 mmHg and/or DBP $90 mmHg or diabetes: SBP .130 mmHg and/or DBP .80 mmHg.
Abbreviations: ae,adverse event; cHD, coronary heart disease; cHF, congestive heart failure; cRUcial, cluster Randomized Usual care versus caduet investigation
Assessing Long-term-risk; CV, cardiovascular; DBP, diastolic blood pressure; Hba1c, glycated hemoglobin; PA, Pacific Asian; PMI, proactive multifactorial intervention; SBP,
systolic blood pressure; Tc, total cholesterol; Tg, triglycerides; Tia, transient ischemic attack; Uc, usual care.
Vascular Health and Risk Management downloaded from https://www.dovepress.com/ by 118.70.13.36 on 27-Aug-2020
Dovepress
cho et al
Non-PA patients had higher baseline TC, LDL-C, DBP, and body mass index and were more likely to be current smok-ers compared with PA patients (all P,0.001) (Table 1). The differences in age and diabetic status contributed to a higher calculated baseline Framingham 10-year CHD risk in the PA group compared with the non-PA group (21.7% versus 17.9%;
P,0.001). However, within both regions, the two treatment arms were balanced with respect to baseline demographics and other characteristics, with the exception that BP was higher in the PMI arm compared with the UC arm (Table 1). In the PA group, compared with the UC arm, patients in the PMI arm were slightly younger (61.5 years versus 63.6 years; P=0.019), while age was comparable between the two treatment arms in the non-PA group. In the non-PA group, compared with the UC arm, patients in the PMI arm had slightly higher calcu-lated baseline Framingham 10-year CHD risk (19.0% versus 16.7%; P,0.001), while risk was comparable between the two treatment arms in PA patients.
Medication use
The distribution of SPAA dose in the PMI arm (5/10, 10/10, 5/20, and 10/20 mg/mg) was similar in the PA and non-PA region and between men and women and those with and without diabetes (Table 2). Most patients in each group (between 77% and 83%) took SPAA 5/10 mg/mg (Table 2).
At week 52 in the PMI arm, most patients took antihyper-tensive medications in addition to SPAA (PA 84.2% versus
non-PA, 86.9%). Additional lipid-lowering medications were taken by 2.4% and 7.8% of patients in the PMI arm in the PA and non-PA regions, respectively.
At week 52 in the UC arm, 98.0% and 96.7% of patients took antihypertensive medications in the PA and non-PA regions, respectively. Lipid-lowering medications were taken by 30.4% and 32.2% in the UC arm in the PA and non-PA regions, respectively.
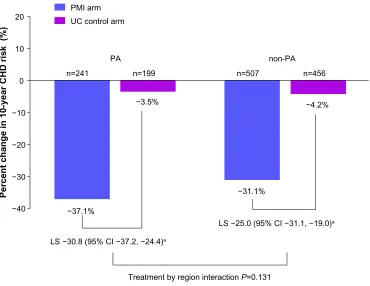
Change in calculated Framingham 10-year
cHD risk
A greater relative reduction in calculated Framingham 10-year CHD risk was observed for patients in the PMI arm versus the UC arm after 52 weeks of follow-up, and this difference was observed for both PA (−37.1% versus −3.5%; P,0.001) and non-PA (−31.1% versus −4.2%; P,0.001) patients, respec-tively (Figure 2). There was no strong evidence of interaction (P=0.131) between the treatment-related reduction in Framingham 10-year CHD risk and PA region.
BP and lipid parameters
There were greater reductions in SBP and DBP between baseline and week 52 in the PMI arm compared with the UC arm in both PA and non-PA regions (Figure 3A). No interaction was observed between treatment-related reductions in SBP, DBP, and PA region (P=0.492 and
P=0.222, respectively). There were small increases in both
Table 1 Baseline characteristics and demographics in PA and non-PA regions
Overall (n=1,417) PA (n=448a) Non-PA (n=969a)
PA (n=448a)
Non-PA (n=969a)
P-value for region comparison
PMI arm (n=247a)
UC arm (n=201a)
P-value PMI arm (n=513a)
UC arm (n=456a)
P-value
Male, n (%) 284 (63.4) 454 (46.9) ,0.001 162 (65.6) 122 (60.7) 0.285 244 (47.6) 210 (46.1) 0.638 age, years, mean ± sD 62.5±9.5 59.1±10.1 ,0.001 61.5±9.8 63.6±8.9 0.019 59.2±10.0 58.9±10.3 0.606 current smoker, n (%) 121 (27.3) 424 (43.8) ,0.001 74 (30.2) 47 (23.6) 0.121 233 (45.4) 191 (41.9) 0.268 BMi, kg/m2, mean ± sD 25.9±3.8 30.1±5.0 ,0.001 25.6±3.8 26.3±3.7 0.064 30.2±5.1 30.0±5.0 0.694 sBP, mmHg, mean ± sDb 147.6±17.2 147.5±13.9 0.976 151.0±17.4 143.3±15.9 ,0.001 150.0±13.5 144.8±13.8 ,0.001 DBP, mmHg, mean ± sDb 86.1±10.5 89.1±8.5 ,0.001 87.9±11.1 84.1±9.2 ,0.001 90.6±8.0 87.5±8.9 ,0.001 Heart rate, bpm, mean ± sD 72.8±10.6 73.7±9.4 0.118 72.6±10.5 73.2±10.7 0.544 74.7±9.3 72.7±9.5 0.001 Tc, mg/dl, mean ± sD 194.3±30.1 200.4±29.7 ,0.001 194.6±30.3 194.0±29.8 0.831 201.7±29.6 198.8±29.9 0.123
LDL-C, mg/dL, mean ± sD 113.7±28.5 121.1±26.8 ,0.001 114.2±28.3 113.0±28.7 0.659 121.9±26.3 120.2±27.5 0.335
HDL-C, mg/dL, mean ± sD 47.2±12.9 47.9±14.0 0.384 47.2±12.3 47.2±13.6 0.997 47.8±14.1 48.1±13.7 0.749
Tg, mg/dl, mean ± sD 170.9±84.0 161.5±82.9 0.049 169.6±84.9 172.6±83.1 0.711 165.6±86.1 156.7±78.9 0.096
Type 2 diabetes, n (%) 263 (58.7) 337 (34.8) ,0.001 143 (57.9) 120 (59.7) 0.699 181 (35.3) 156 (34.2) 0.727 Framingham 10-year CHD
risk (%),11 mean ± sD
21.7±12.3 17.9±10.4 ,0.001 22.0±12.0 21.3±12.8 0.606 19.0±10.6 16.7±10.0 ,0.001
Notes:aTreated patients with baseline and one or more postbaseline efficacy measurements; bBP values were measured at baseline (week 0), whereas information on all of the other variables listed were collected during screening.
Abbreviations: bpm, beats per minute; BMI, body mass index; BP, blood pressure; CHD, coronary heart disease; DBP, diastolic blood pressure; HDL-C, high-density lipoprotein cholesterol; LDL-C, low-density lipoprotein cholesterol; PA, Pacific Asian; PMI, proactive multifactorial intervention; SBP, systolic blood pressure; SD, standard
deviation; Tc, total cholesterol; Tg, triglyceride; Uc, usual care.
Vascular Health and Risk Management downloaded from https://www.dovepress.com/ by 118.70.13.36 on 27-Aug-2020
Dovepress CRUCIAL Pacific Asian versus non-Pacific Asian regions
TC (1.2% and 0.6%, respectively) and LDL-C (3.7% and 2.3%, respectively) between baseline and week 52 in both PA and non-PA patients in the UC arm (Figure 3B). The treatment-related reduction (relative to baseline) in TC was slightly greater in PA patients compared with non-PA patients (treatment by region interaction, P=0.054).
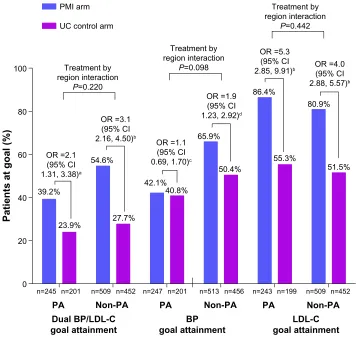
goal attainment
In both regions at week 52, a greater proportion of patients in the PMI arm compared with the UC arm reached their BP,
LDL-C, and dual BP/LDL-C goals (Figure 4). There was no strong evidence of interaction between treatment-related goal attainment and region for LDL-C (treatment by region interaction, P=0.442) or dual BP/LDL-C goals (treatment by region interaction, P=0.220). However, treatment-related BP goal attainment was slightly greater among non-PA patients compared with PA patients (treatment by region interaction, P=0.098).
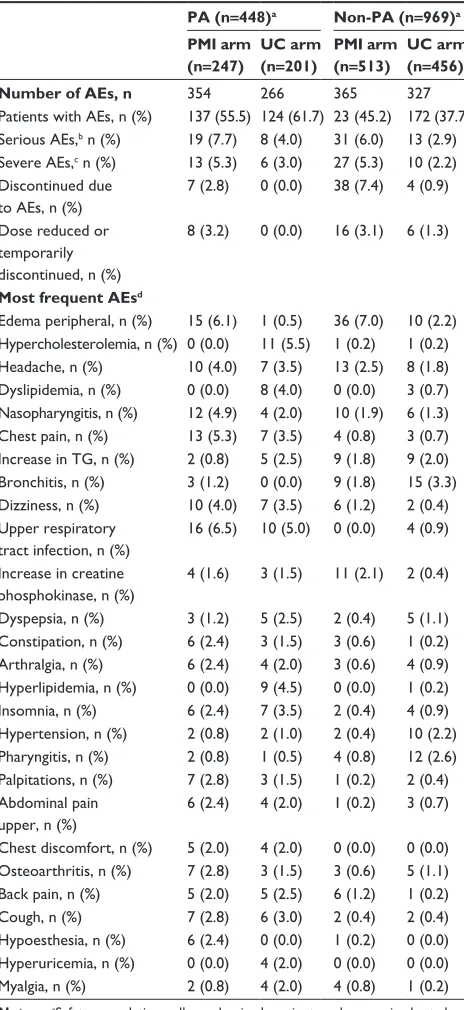
safety and tolerability
A higher proportion of PA patients compared with non-PA patients reported AEs in both the PMI (55.5% versus 45.2%;
P=0.008) and UC arms (61.7% versus 37.7%; P,0.001) (Table 3). However, fewer PA patients than non-PA patients discontinued PMI treatment due to AEs (2.8% versus 7.4%,
P=0.012).
Treatment efficacy by
sex
Among those participating in the CRUCIAL trial from the PA region, 284 were men (63.4%) and 164 were women (36.6%). In the non-PA region, 454 were men (46.9%) and 515 were women (53.1%).
Table 2 Distribution of sPaa dose at week 52 by subgroup Dose of SPAA (mg/mg)
5/10 10/10 5/20 10/20 Region
Pa, n (%)
Non-PA, n (%)
210 (83)
405 (77)
43 (17) 87 (17)
0 (0) 22 (4)
0 (0) 12 (2)
Sex
Male, n (%) Female, n (%)
328 (80)
287 (78)
61 (15)
69 (19)
14 (3) 8 (2)
10 (2) 2 (1)
Diabetes status
Diabetes, n (%) no diabetes, n (%)
263 (78) 352 (79)
63 (19) 67 (15)
5 (2)
17 (4)
5 (2)
7 (2)
Abbreviations: PA, Pacific Asian; SPAA, single-pill amlodipine/atorvastatin.
−40 −30 −20 −10 0 10 20
−37.1%
−3.5% PMI arm
UC control arm
−31.1%
−4.2%
LS −30.8 (95% CI −37.2, −24.4)a
LS −25.0 (95% CI −31.1, −19.0)a
n=241
PA non-PA
n=199 n=507 n=456
Treatment by region interaction P=0.131
Percent change in 10-year CHD risk (%)
Figure 2 Relative percentage change in Framingham 10-year CHD risk, from baseline to week 52 for PA and non-PA patients by treatment arm.
Notes: aP,0.001.Patients excluded for missing data: Pa PMi, n=6; Pa Uc, n=2; non-PA PMI, n=6.
Abbreviations: cHD,coronary heart disease; CI, confidence interval; LS, least square mean for difference; PA, Pacific Asian; PMI, proactive multifactorial intervention;
Uc, usual care.
Vascular Health and Risk Management downloaded from https://www.dovepress.com/ by 118.70.13.36 on 27-Aug-2020
Dovepress
cho et al
A SBP and DBP (mmHg) B TC and LDL-C (%)
−20.0
−20 −10 0 10
PMI arm UC control arm
DBP SBP
−19.1
LS −4.4 (95% CI −8.3, −0.5)a
PA
−9.0 −8.3
−3.9
−10.4
−11.6 −5.9
LS −1.9 (95% CI −3.8, 0.0)c
LS −3.7 (95% CI −5.3, −2.1)b
LS −6.5 (95% CI −9.2, −3.7)b
Treatment by region interaction P=0.492
Treatment by region interaction P=0.222
Mean change in BP (mmHg)
n=247 n=201
non-PA
n=513 n=456
PA
n=247 n=201
non-PA
n=513 n=456
−40 −20 0
20 TC LDL-C
PA
n=247 n=201
PA
n=242 n=199
non-PA
n=513 n=456
−20.5 −16.0
1.2 2.3
−28.2 −24.4 LS −20.8
(95% CI −24.7, −17.0)a
LS −15.3 (95% CI −18.2, −12.3)a
LS −31.3 (95% CI −38.3, −24.4)a
LS −25.2 (95% CI −29.6, −20.9)a
non-PA
n=499 n=440
PMI arm UC control arm
Treatment by region interaction P=0.175 Treatment by region
interaction P=0.054
Mean percent change in TC and LDL-C (%)
0.6 3.7
Figure 3 adjusted mean change from baseline to week 52 in (A) sBP and DBP (mmHg), and (B) TC and LDL-C (%) for PA and non-PA patients.
Notes: aP,0.05;bP,0.001; cP=0.051. Patients excluded for missing LDL-C: PA PMI, n=5; Pa Uc, n=2; non-PA PMI, n=14; non-PA UC, n=16.
Abbreviations: ci,confidence interval; DBP, diastolic blood pressure; LDL-C, low-density lipoprotein cholesterol; LS, least square mean for difference; PA, Pacific Asian;
PMi, proactive multifactorial intervention; sBP, systolic blood pressure; Tc, total cholesterol; Uc, usual care.
OR=2.1
(95% CI
1.31, 3.38)a
OR=4.0
(95% CI
2.88, 5.57)b
OR=5.3
(95% CI
2.85, 9.91)b
OR=1.9
(95% CI
1.23, 2.92)d
OR=1.1
(95% CI
0.69, 1.70)c
OR=3.1
(95% CI
2.16, 4.50)b
39.2%
80.9%
65.9%
86.4%
0 20 40 60 80 100
PMI arm
UC control arm
42.1% 54.6%
Dual BP/LDL-C goal attainment
40.8%
51.5%
27.7%
BP
goal attainment goal attainmentLDL-C
55.3%
23.9%
50.4% Treatment by
region interaction
P=0.220
Treatment by region interaction
P=0.098
Treatment by region interaction
P=0.442
Patients at goal (%)
Non-PA
PA PA PA
n=245 n=201 n=509 n=452 n=247 n=201 n=513 n=456 n=243 n=199 n=509 n=452
Non-PA Non-PA
Figure 4 Study-specific BP and LDL-C goal attainment at week 52 for PA and non-PA patients.
Notes: aP=0.002;bP,0.001; cP=0.738; dP=0.004. Patients excluded for missing data: dual goal attainment: Pa PMi, n=2; Pa Uc, n=0; non-PA PMI, n=4; non-PA UC, n=4; LDL-C goal attainment: Pa PMi, n=4; Pa Uc, n=2; non-PA PMI; n=4; non-PA UC, n=4.
Abbreviations: BP,blood pressure; CI, confidence interval; LDL-C, low-density lipoprotein cholesterol; OR, odds ratio; PA, Pacific Asian; PMI, proactive multifactorial
intervention; Uc, usual care.
Vascular Health and Risk Management downloaded from https://www.dovepress.com/ by 118.70.13.36 on 27-Aug-2020
Dovepress CRUCIAL Pacific Asian versus non-Pacific Asian regions
Treatment efficacy by diabetic status
Of the patients with diabetes, 263 (43.8%) resided in the PA region and 337 (56.2%) resided in non-PA regions. Of those without diabetes, 185 (22.6%) resided in the PA region and 632 (77.4%) in non-PA regions.
There was a greater relative reduction in calculated 10-year Framingham CHD risk between baseline and week 52 in PA patients without diabetes compared with non-PA patients without diabetes (least square mean difference −37.3 [95% CI −46.0, −28.7] versus −23.8 [95% CI −30.5, −17.1], region interaction P=0.024) (Figure 6A). There were no other major differences in the treatment-related reduction in TC, LDL-C, SBP, and DBP between patients with and without diabetes in the PA and non-PA regions (Figure 6A and B).
Discussion
The findings from this CRUCIAL trial subanalysis demon-strate that compared with UC, the PMI approach was more effective in reducing calculated Framingham 10-year CHD risk in patients residing in both PA and non-PA regions with hypertension and three or more additional risk factors. A slightly greater treatment-related relative reduction in TC was observed among those residing in the PA region compared with the non-PA region (−20.8% versus −15.3%;
P=0.054). A slightly greater treatment-related relative reduc-tion was also observed in 10-year Framingham CHD risk in patients without diabetes in the PA region between baseline and week 52 (−37.3 versus −23.8; P=0.024). The treatment-related effects were similar among men and women and in patients with diabetes. In the PMI arm, the distribution of SPAA dose was similar in the PA and non-PA region, among men and women, and those with and without diabetes. The most frequently reported dose in each group was SPAA 5/10 mg/mg. The majority of patients in both PA and non-PA regions took additional antihypertensive medications in both arms.
The use of SPAA was mandatory in the PMI arm; hence, all patients received a statin. In the UC arm, physicians made a voluntary decision about whether or not to prescribe statins and which statin to use, based on their best clinical judgment. At the end of the study, in the UC arm, only one-third of patients in both regions reported taking lipid-lowering therapy. These data support our finding that a PMI approach based on SPAA is a more effective strategy than UC to reduce calculated CHD risk among patients residing in both PA and non-PA regions.
The reductions in BP observed in this study are sup-ported by earlier studies conducted in the PA region that
Table 3 All-causality AEs in PA and non-PA patients
PA (n=448)a Non-PA (n=969)a
PMI arm (n=247)
UC arm (n=201)
PMI arm (n=513)
UC arm (n=456) Number of AEs, n 354 266 365 327
Patients with aes, n (%) 137 (55.5) 124 (61.7) 23 (45.2) 172 (37.7)
serious aes,b n (%) 19 (7.7) 8 (4.0) 31 (6.0) 13 (2.9) severe aes,c n (%) 13 (5.3) 6 (3.0) 27 (5.3) 10 (2.2) Discontinued due
to aes, n (%)
7 (2.8) 0 (0.0) 38 (7.4) 4 (0.9)
Dose reduced or temporarily discontinued, n (%)
8 (3.2) 0 (0.0) 16 (3.1) 6 (1.3)
Most frequent AEsd
edema peripheral, n (%) 15 (6.1) 1 (0.5) 36 (7.0) 10 (2.2) Hypercholesterolemia, n (%) 0 (0.0) 11 (5.5) 1 (0.2) 1 (0.2) Headache, n (%) 10 (4.0) 7 (3.5) 13 (2.5) 8 (1.8) Dyslipidemia, n (%) 0 (0.0) 8 (4.0) 0 (0.0) 3 (0.7)
nasopharyngitis, n (%) 12 (4.9) 4 (2.0) 10 (1.9) 6 (1.3) chest pain, n (%) 13 (5.3) 7 (3.5) 4 (0.8) 3 (0.7)
increase in Tg, n (%) 2 (0.8) 5 (2.5) 9 (1.8) 9 (2.0)
Bronchitis, n (%) 3 (1.2) 0 (0.0) 9 (1.8) 15 (3.3) Dizziness, n (%) 10 (4.0) 7 (3.5) 6 (1.2) 2 (0.4) Upper respiratory
tract infection, n (%)
16 (6.5) 10 (5.0) 0 (0.0) 4 (0.9)
increase in creatine phosphokinase, n (%)
4 (1.6) 3 (1.5) 11 (2.1) 2 (0.4)
Dyspepsia, n (%) 3 (1.2) 5 (2.5) 2 (0.4) 5 (1.1) constipation, n (%) 6 (2.4) 3 (1.5) 3 (0.6) 1 (0.2) arthralgia, n (%) 6 (2.4) 4 (2.0) 3 (0.6) 4 (0.9)
Hyperlipidemia, n (%) 0 (0.0) 9 (4.5) 0 (0.0) 1 (0.2) insomnia, n (%) 6 (2.4) 7 (3.5) 2 (0.4) 4 (0.9)
Hypertension, n (%) 2 (0.8) 2 (1.0) 2 (0.4) 10 (2.2) Pharyngitis, n (%) 2 (0.8) 1 (0.5) 4 (0.8) 12 (2.6) Palpitations, n (%) 7 (2.8) 3 (1.5) 1 (0.2) 2 (0.4) abdominal pain
upper, n (%)
6 (2.4) 4 (2.0) 1 (0.2) 3 (0.7)
chest discomfort, n (%) 5 (2.0) 4 (2.0) 0 (0.0) 0 (0.0) Osteoarthritis, n (%) 7 (2.8) 3 (1.5) 3 (0.6) 5 (1.1) Back pain, n (%) 5 (2.0) 5 (2.5) 6 (1.2) 1 (0.2)
cough, n (%) 7 (2.8) 6 (3.0) 2 (0.4) 2 (0.4)
Hypoesthesia, n (%) 6 (2.4) 0 (0.0) 1 (0.2) 0 (0.0) Hyperuricemia, n (%) 0 (0.0) 4 (2.0) 0 (0.0) 0 (0.0) Myalgia, n (%) 2 (0.8) 4 (2.0) 4 (0.8) 1 (0.2)
Notes: asafety population: all randomized patients who received at least one dose of study medication; bserious AEs are defined as meeting one of the
following criteria: AE resulted in death, was life-threatening, required inpatient
hospitalization or prolongation of existing hospitalization, resulted in persistent
or significant disability or incapacity, or in congenital anomaly or birth defect;
csevere AEs are defined as AEs that interfere significantly with a patient’s
usual function; dall observed or self-reported AEs that occurred at a rate of $2%.
Abbreviations: AEs, adverse events; PA, Pacific Asian; PMI, proactive multifactorial
intervention; Tg, triglycerides; Uc, usual care.
The treatment-related reductions between baseline and week 52 in 10-year calculated Framingham CHD risk, TC, LDL-C, DBP, and SBP were similar between men and women within the PA and non-PA regions (sex interaction, P.0.2) (Figure 5A and B).
Vascular Health and Risk Management downloaded from https://www.dovepress.com/ by 118.70.13.36 on 27-Aug-2020
Dovepress
cho et al
have also demonstrated the effectiveness of antihyper-tensive drug treatments in PA patients. In the Systolic Hypertension in China trial,21 active treatment reduced
BP by 9.1/3.2 mmHg and reduced CV mortality by 39% compared with placebo among older (mean age 66.5 years) Chinese patients with isolated systolic hypertension. The reduction in mortality was largely due to the prevention of fatal strokes. The Felodipine Event Reduction trial,1 also
conducted among Chinese hypertensive patients, demon-strated that even small treatment-induced reductions in BP resulted in substantial reductions in most CV events. Therefore, despite the strong relationship between BP and stroke that exists in many Asian populations, the benefit of BP reduction using antihypertensive agents was also
observed for cardiac events. The Novel Antihypertensive Goal Of hYpertension With diAbetes Hypertensive Events and ARb Treatment study, compared valsartan with amlo-dipine among 1,150 hypertensive Japanese patients with glucose intolerance, and demonstrated BP was equally well controlled among both treatment groups over the 3-year study follow-up.3 No differences were observed
in the primary outcome (a composite of acute myocardial infarction, stroke, coronary revascularization, admission attributed to heart failure, or sudden cardiac death) for valsartan-treated patients versus amlodipine-treated patients (hazard ratio: 0.97 [95% CI 0.66, 1.40]; P=0.85). The only individual outcome which favored the use of valsartan was heart failure admission.
A PA region
PA men (n=284)
−60
Framingham 10-year total CHD risk (%)
Low-density lipoprotein cholesterol (%)
Diastolic blood pressure (mmHg)
Systolic blood pressure (mmHg)
Difference in LS meana (95% CI)
−26.9 (−37.8, −15.9) −34.0 (−41.6, −26.4)
−26.8 (−36.3, −17.2) −33.2 (−41.8, −24.7) −19.6 (−24.7, −14.5) −21.6 (−26.3, −16.8)
−0.7 (−3.3, 1.9) −2.6 (−5.1, −0.2)
−4.5 (−11.2, 2.2) −4.8 (−9.0, −0.7) Total cholesterol (%)
P-value sex interaction
0.269
0.512
0.461
0.241
0.888
PA women (n=164)
Efficacy measures
B Non-PA region
Non-PA men (n=454)
Framingham 10-year total CHD risk (%)
Low-density lipoprotein cholesterol (%)
Diastolic blood pressure (mmHg)
Systolic blood pressure (mmHg)
Difference in LS meana (95% CI)
−23.9 (−31.6, −16.2) −25.6 (−33.8, −17.3)
−27.0 (−32.9, −21.1) −24.4 (−30.2, −18.5) −15.6 (−19.3, −11.9) −15.6 (−20.1, −11.1)
−3.6 (−5.5, −1.8) −3.7 (−5.7, −1.7)
−6.5 (−9.9, −3.0) −6.4 (−9.6, −3.1) Total cholesterol (%)
P-value sex interaction
0.324
0.663
0.820
0.617
0.892
Non-PA women (n=515)
Efficacy measures
PMI better betterUC
PMI better betterUC
−50 −40 −30 −20 −10 0 10
−60 −50 −40 −30 −20 −10 0 10
Figure 5 Treatment effect on efficacy measures from baseline to week 52 for men and women in the (A) Pa region, and (B) non-PA region.
Note: aMeanchange from baseline to week 52 following treatment with PMi versus Uc, adjusted for baseline values.
Abbreviations: cHD,coronary heart disease; CI, confidence interval; lS, least square; PA, Pacific Asian; PMI, proactive multifactorial intervention; UC, usual care.
Vascular Health and Risk Management downloaded from https://www.dovepress.com/ by 118.70.13.36 on 27-Aug-2020
Dovepress CRUCIAL Pacific Asian versus non-Pacific Asian regions
In the CRUCIAL trial, BP treatment goals were depen-dent on diabetes status. The BP goal was ,130/80 mmHg for patients with diabetes and ,140/90 mmHg for those without diabetes. The proportion of patients with diabetes was higher in the PA population compared with the non-PA population (58.7% versus 34.8%, respectively). This may explain why, although there was no significant difference in BP reduction between the two regions, fewer PA than non-PA patients reached the BP goal. It may be of interest to note that there was no significant difference in baseline glucose
level between the PMI and UC arms in both regions (data not shown).
In this CRUCIAL trial subanalysis, we observed that compared with non-PA regions, patients residing in the PA region had a greater reduction in TC in the PMI arm compared with the UC arm. This finding is consistent with previous reports of a heightened response among Asian patients to the lipid-lowering effects of statins, which is thought to be related, in part, to genetic differences in the metabolism of statins.22 In the Japanese outcomes trial,
A No diabetes
Framingham 10-year total CHD risk (%)
Low-density lipoprotein cholesterol (%)
Diastolic blood pressure (mmHg)
Systolic blood pressure (mmHg)
Difference in LS meana (95% CI)
−23.8 (−30.5, −17.1) −37.3 (−46.0, −28.7)
−23.3 (−28.5, −18.1) −31.0 (−38.8, −23.1) −14.1 (−17.6, −10.6) −20.7 (−24.7, −16.8)
−3.7 (−5.4, −1.9) −4.1 (−7.4, −0.8)
−6.6 (−9.7, −3.6) −7.0 (−12.3, −1.6) Total cholesterol (%)
P-value within diabetes status
region Interaction
Difference in
LS meana (95% CI) within diabetes statusP-value
region Interaction Efficacy measures
0.100
0.155
0.769 Non-PA no diabetes (n=632)
0.945 0.024
B Diabetes
Framingham 10-year total CHD risk (%)
Low-density lipoprotein cholesterol (%)
Diastolic blood pressure (mmHg)
Systolic blood pressure (mmHg)
−25.6 (−35.4, −15.7) −25.8 (−34.9, −16.7)
−26.7 (−33.9, −19.4) −31.7 (−40.6, −22.7) −16.1 (−20.7, −11.5) −21.2 (−26.4, −16.1)
−3.1 (−5.7, −0.5) −0.1 (−2.3, 2.1)
−6.0 (−10.4, −1.5) −2.2 (−7.2, 2.7) Total cholesterol (%)
Efficacy measures
SPAA better
UC better SPAA better
UC better
0.653
0.193
0.352 0.502
0.156 PA no diabetes (n=185)
Non-PA diabetes (n=337) PA diabetes (n=263)
−50 −40 −30 −20 −10 0 10
−50 −40 −30 −20 −10 0 10
Figure 6 Treatment effect on efficacy measures from baseline to week 52 for PA and non-PA patients with (A) no diabetes, and (B) diabetes.
Note: aMeanchange from baseline to week 52 following treatment with PMi versus Uc, adjusted for baseline values.
Abbreviations: cHD,coronary heart disease; CI, confidence interval; LS, least square; PA, Pacific Asian; sPAA, single-pill amlodipine/atorvastatin; Uc, usual care.
Vascular Health and Risk Management downloaded from https://www.dovepress.com/ by 118.70.13.36 on 27-Aug-2020
Dovepress
cho et al
the Management of Elevated Cholesterol in the Primary Prevention Group of Adult Japanese study,23 pravastatin
reduced the risk of CHD events, despite only small-to-moderate reductions in TC and LDL-C. The dose of statin administered was half that usually administered to Western patients; the authors speculated that Japanese patients may be particularly sensitive to pravastatin due to their diet or that a beneficial reduction in CHD risk might be achieved with a smaller reduction in lipids.
Potential differences in treatment outcomes between PA and non-PA populations may be attributed to heterogene-ity in environmental factors, such as diet or compliance or variability in genetic factors leading to differences in the pathogenesis of CV diseases and drug metabolism.24 For
example, Asian diets have historically been higher in sodium than Caucasian diets, and the use of treatment interventions with natriuretic properties, such as amlodipine, is likely to be favored by Asian populations.25 Asian individuals also have
narrower coronary arteries than Caucasians; this contributes to differences in CV events, which leads to important impli-cations for treatment interventions.26
In the CRUCIAL trial, only patients in the PMI arm received a specific study drug (SPAA), and the comparator group was UC. Therefore, a comparison of the safety and tolerability between the two treatment strategies cannot be made in the same manner as placebo-controlled trials or trials comparing two active treatments. A further chal-lenge in interpreting the AE findings is the possibility of data collection bias that could have been introduced by cultural differences. Furthermore, drug discontinuations usually reflect the patient’s direct discomfort arising from the pharmacologic properties of the drug. “AE” is a broader category that describes the patient’s situation during the process of risk factor modification. Therefore, it is likely that these measures will be different in the two populations. Indeed, in this CRUCIAL subanalysis, a higher proportion of PA than non-PA patients in both the PMI (55.5% versus 45.2%; P=0.008) and UC treatment arms (61.7% versus 37.7%; P,0.001) reported AEs. However, fewer PA than non-PA patients discontinued treatment due to AEs in the PMI treatment arms (2.8% versus 7.4%; P=0.012, respec-tively). These findings are consistent with previous safety experience for SPAA.12,13
In this analysis, we observed that the treatment-related reduction in efficacy measures was similar between men and women, suggesting that both sexes benefited from the simultaneous reduction of BP and lipids using a PMI strategy based on SPAA.
In the CRUCIAL trial, a higher proportion of PA patients compared with non-PA patients had diabetes at baseline (58.7% versus 34.8%, respectively). This reflects worldwide prevalence estimates that type 2 diabetes is an increasing epidemic in Asia.27 Approximately one-third of
the currently estimated global population of patients with diabetes reside in the People’s Republic of China and India alone.27 This is important, given that diabetes is strongly
associated with increased CV disease. Genetic causes may explain the predisposition to insulin resistance and dia-betes in these populations.28 In some Asian populations,
inadequate β-cell response to increasing insulin resistance has been shown to result in loss of glycemic control and an increased risk of diabetes, even with relatively little weight gain.29 We found that there was a slightly greater relative
reduction in calculated 10-year CHD risk among PA patients without diabetes compared with non-PA patients. However, there were no other major differences in efficacy measures evaluated in this study between patients with and without diabetes in the PA or non-PA region.
In addition to diabetes, we found baseline differences in most of the major CV risk factors between the two regions. These differences are an important reason for determining whether the multifactorial approach to risk factor manage-ment was effective among patients residing in both PA and non-PA regions. However, it is important to note that we compared the change in Framingham risk score between baseline and endpoint in the PMI and UC arms within each region (PA and non-PA), and not between regions. We believe it is important that within each region, risk factor prevalence was similar in the PMI and UC arms, but the validity of our results is not affected if there are differences in risk factor prevalence between regions.
In the CRUCIAL trial, data on actual CV events was not collected. Calculated Framingham 10-year CHD risk was therefore evaluated as a surrogate index for CV outcomes. This has the advantage of providing a single primary end-point that reflects the net reduction in both BP and TC; however, it has not been validated for risk prediction among patients receiving treatment. Despite this, we believe it is a valid tool for internal comparison between treatment groups. Secondary endpoints in this subanalysis, including changes in BP and lipids, have however been directly correlated with hard CV endpoints.10 In addition, the Framingham 10-year
risk model is based on Caucasian cohort data, and its appli-cability among patients from different ethnic groups with different risk factor profiles may be a concern.30,31 However,
a recent study, also utilizing data from the CRUCIAL trial,
Vascular Health and Risk Management downloaded from https://www.dovepress.com/ by 118.70.13.36 on 27-Aug-2020
Dovepress CRUCIAL Pacific Asian versus non-Pacific Asian regions
compared risk assessment tools using Asian and Caucasian CV risk models and showed similar results.32
limitations
Several limitations are recognized within the scope of this CRUCIAL trial subanalysis. Firstly, the CRUCIAL trial was designed as a relatively short-term, open-label inter-vention (52 weeks) for patients at moderate CV risk, and data on actual CV events were not collected. Secondly, in this subanalysis, some of the sample sizes were relatively small, which may have resulted in less precise estimates (underpowered). This may be of particular relevance for the analysis of treatment effect in patients with and with-out diabetes and among men and women. In addition, the imbalance in the proportion of patients with diabetes in the PA versus non-PA patient groups must be taken into consideration when interpreting these results. Moreover, the subgroups used in this post hoc analysis were not pre-specified, and multiple comparisons have been made with no adjustment for controlling overall type I errors. A further limitation was that country of residence was used as a proxy for ethnicity, and this may have led to some misclassification bias. Detailed exploration of the ethnic and cultural diver-sity within the countries grouped into the PA and non-PA regions was beyond the scope of this analysis. Finally, the People’s Republic of China and Japan did not participate in the CRUCIAL trial, and hence patients residing in these countries were not included in this analysis.
Conclusion
This subanalysis of the CRUCIAL trial suggests that a multifactorial risk treatment strategy based on SPAA is a more effective approach to reducing calculated Framingham 10-year CHD risk compared with UC in both PA and non-PA men and women with and without diabetes. Furthermore, clinicians can be reassured by the low dis-continuation rate due to AEs in the PMI treatment arm in PA and non-PA patients. These observations suggest that a PMI approach using SPAA contributes to improving the management of CV risk in patients residing in both PA and non-PA regions.
Acknowledgments
This study was sponsored by Pfizer Inc. Medical writing support was provided by Sarah Partridge and Penny Gorringe of Engage Scientific Solutions and funded by Pfizer Inc. The authors thank all investigators and co-investigators in the participating countries of the CRUCIAL trial. The full
list of investigators is available in the paper describing the principle results of the CRUCIAL trial.10
Disclosure
EJ Cho and JH Kim have served as consultants, received travel expenses or payment for speaking at meetings, or received funding for research from one or more pharmaceu-tical companies (including Pfizer Inc., who sponsored this study) that market BP- or lipid-lowering drugs. C Yunis is an employee of Pfizer Inc, New York, NY, USA. M Westergaard and S Sutradhar were employees of Pfizer Inc, New York, NY, USA at the time that this study was conducted. The authors report no other conflicts of interest in this work.
References
1. Liu L, Zhang Y, Liu G, Li W, Zhang X, Zanchetti A; FEVER Study Group. The Felodipine Event Reduction (FEVER) Study: a randomized long-term placebo-controlled trial in Chinese hypertensive patients. J Hypertens. 2005;23(12):2157–2172.
2. JATOS Study Group. Principal results of the Japanese trial to assess optimal systolic blood pressure in elderly hypertensive patients (JATOS). Hypertens Res. 2008;31(12):2115–2127.
3. Muramatsu T, Matsushita K, Yamashita K, et al; NAGOYA HEART Study Investigators. Comparison between valsartan and amlodipine regarding cardiovascular morbidity and mortality in hypertensive patients with glucose intolerance: NAGOYA HEART Study. Hypertension. 2012;59(3):580–586.
4. Yusuf S, Hawken S, Ounpuu S, et al; INTERHEART Study Investigators. Effect of potentially modifiable risk factors associated with myocardial infarction in 52 countries (the INTERHEART study): case-control study. Lancet. 2004;364(9438):937–952.
5. Yusuf S, Reddy S, Ounpuu S, Anand S. Global burden of cardiovascular diseases: Part II: variations in cardiovascular disease by specific ethnic groups and geographic regions and prevention strategies. Circulation. 2001;104(23):2855–2864.
6. McDowell SE, Coleman JJ, Ferner RE. Systematic review and meta-analysis of ethnic differences in risks of adverse reactions to drugs used in cardiovascular medicine. BMJ. 2006;332(7551):1177–1181. 7. Yagi H, Komukai K, Hashimoto K, et al. Difference in risk factors
between acute coronary syndrome and stable angina pectoris in the Japanese: smoking as a crucial risk factor of acute coronary syndrome. J Cardiol. 2010;55(3):345–353.
8. Lawes CM, Rodgers A, Bennett DA, et al; Asia Pacific Cohort Studies Collaboration. Blood pressure and cardiovascular disease in the Asia Pacific region. J Hypertens. 2003;21(4):707–716.
9. Gupta AK, Poulter NR, Dobson J, et al; ASCOT investigators. Ethnic differences in blood pressure response to first and second-line antihy-pertensive therapies in patients randomized in the ASCOT Trial. Am J Hypertens. 2010;23(9):1023–1030.
10. Zamorano J, Erdine S, Pavia A, et al; CRUCIAL Investigators. Proactive multiple cardiovascular risk factor management com-pared with usual care in patients with hypertension and addi-tional risk factors: the CRUCIAL trial. Curr Med Res Opin. 2011;27(4):821–833.
11. Wilson PW, D’Agostino RB, Levy D, Belanger AM, Silbershatz H, Kannel WB. Prediction of coronary heart disease using risk factor categories. Circulation. 1998;97(18):1837–1847.
12. Erdine S, Ro YM, Tse HF, et al; Gemini-AALA Investigators. Single-pill amlodipine/atorvastatin helps patients of diverse ethnicity attain recom-mended goals for blood pressure and lipids (the Gemini-AALA study). J Hum Hypertens. 2009;23(3):196–210.
Vascular Health and Risk Management downloaded from https://www.dovepress.com/ by 118.70.13.36 on 27-Aug-2020
Vascular Health and Risk Management
Publish your work in this journal
Submit your manuscript here: http://www.dovepress.com/vascular-health-and-risk-management-journal Vascular Health and Risk Management is an international,
peer-reviewed journal of therapeutics and risk management, focusing on concise rapid reporting of clinical studies on the processes involved in the maintenance of vascular health; the monitoring, prevention and treatment of vascular disease and its sequelae; and the involvement of
metabolic disorders, particularly diabetes. This journal is indexed on PubMed Central and MedLine. The manuscript management system is completely online and includes a very quick and fair peer-review system, which is all easy to use. Visit http://www.dovepress.com/ testimonials.php to read real quotes from published authors.
Dovepress
Dove
press
cho et al
13. Richard Hobbs FD, Gensini G, John Mancini GB, et al; JEWEL Study Group. International open-label program to assess the efficacy and safety of single-pill amlodipine/atorvastatin in attaining blood and lipid targets recommended by country-specific guidelines: the JEWEL programme. Eur J Cardiovasc Prev Rehabil. 2009;16(4):472–480.
14. ALLHAT Officers and Coordinators for the ALLHAT Collaborative Research Group; The Antihypertensive and Lipid-Lowering Treatment to Prevent Heart Attack Trial. Major outcomes in high-risk hypertensive patients randomized to angiotensin-converting enzyme inhibitor or calcium channel blocker vs diuretic: The Antihypertensive and Lipid-Lowering Treatment to Prevent Heart Attack Trial (ALLHAT). JAMA. 2002;288(23):2981–2997.
15. Sever PS, Dahlöf B, Poulter NR, et al; ASCOT investigators. Prevention of coronary and stroke events with atorvastatin in hypertensive patients who have average or lower-than-average cholesterol concentrations, in the Anglo-Scandinavian Cardiac Outcomes Trial – Lipid Lowering Arm (ASCOT-LLA): a multicentre randomised controlled trial. Lancet. 2003;361(9364):1149–1158.
16. Hussein MA, Chapman RH, Benner JS, et al. Does a single-pill antihypertensive/lipid-lowering regimen improve adherence in US managed care enrolees? A non-randomized, observational, retrospective study. Am J Cardiovasc Drugs. 2010;10(3):193–202.
17. Simons LA, Ortiz M, Calcino G. Persistence with a single pill versus two pills of amlodipine and atorvastatin: the Australian experience, 2006–2010. Med J Aust. 2011;195(3):134–137.
18. Zamorano J, Erdine S, Lopez AP, et al; CRUCIAL Investigators. Design and rationale of a real-life study to compare treatment strategies for cardiovascular risk factors: the CRUCIAL study. Postgrad Med. 2010;122(2):7–15.
19. Chobanian AV, Bakris GL, Black HR, et al. Seventh report of the Joint National Committee on Prevention, Detection, Evaluation, and Treat-ment of High Blood Pressure. Seventh report of the Joint National Committee on Prevention, Detection, Evaluation, and Treatment of High Blood Pressure. Hypertension. 2003;42:1206–1252.
20. Expert Panel on Detection, Evaluation, and Treatment of High Blood Cholesterol in Adults. Executive Summary of The Third Report of The National Cholesterol Education Program (NCEP) Expert Panel on Detection, Evaluation, and Treatment of High Blood Cholesterol In Adults (Adult Treatment Panel III). JAMA. 2001;285(19):2486–2497. 21. Liu L, Wang JG, Gong L, Liu G, Staessen JA. Comparison of active
treatment and placebo in older Chinese patients with isolated sys-tolic hypertension. Syssys-tolic Hypertension in China (Syst-China) Collaborative Group. J Hypertens. 1998;16(12 Pt 1):1823–1829.
22. Liao JK. Safety and efficacy of statins in Asians. Am J Cardiol. 2007;99: 410–414.
23. Nakamura H, Arakawa K, Itakura H, et al; MEGA Study Group. Primary prevention of cardiovascular disease with pravastatin in Japan (MEGA Study): a prospective randomised controlled trial. Lancet. 2006;368(9542):1155–1163.
24. Jamerson K, DeQuattro V. The impact of ethnicity on response to antihypertensive therapy. Am J Med. 1996;101(3A):22S–32S. 25. Burges R, Moisey D. Unique pharmacologic properties of amlodipine.
Am J Cardiol. 1994;73(3):2A–9A
26. Masaki Y, Shimada K, Kojima T, et al. Clinical significance of the measurements of plasma N-terminal pro-B-type natriuretic peptide levels in patients with coronary artery disease who have undergone elec-tive drug-eluting stent implantation. J Cardiol. 2011;57(3):303–310. 27. King H, Aubert RE, Herman WH. Global burden of diabetes,
1995–2025: prevalence, numerical estimates, and projections. Diabetes Care. 1998;21(9):1414–1431.
28. Radha V, Vimaleswaran KS, Babu HN, et al. Role of genetic polymor-phism peroxisome proliferator-activated receptor-gamma2 Pro12Ala on ethnic susceptibility to diabetes in South-Asian and Caucasian subjects: Evidence for heterogeneity. Diabetes Care. 2006;29(5): 1046–1051.
29. Chan JC, Malik V, Jia W, et al. Diabetes in Asia: epidemiology, risk factors, and pathophysiology. JAMA. 2009;301(20):2129–2140. 30. Kenealy T, Elley CR, Robinson E, et al. An association between
ethnicity and cardiovascular outcomes for people with Type 2 diabetes in New Zealand. Diabet Med. 2008;25(11):1302–1308.
31. Menotti A, Lanti M, Kromhout D, et al. Homogeneity in the relationship of serum cholesterol to coronary deaths across different cultures: 40-year follow-up of the Seven Countries Study. Eur J Cardiovasc Prev Rehabil. 2008;15(6):719–725.
32. Cho EJ, Kim JH, Sutradhar S, Yunis C, Westergaad M; CRUCIAL Trial Investigators. Proactive multifactorial intervention strategy reduces the risk of cardiovascular disease estimated with region-specific risk assess-ment models in Pacific-Asian patients participating in the CRUCIAL trial. J Korean Med Sci. 2013;28(12):1741–1748.
Vascular Health and Risk Management downloaded from https://www.dovepress.com/ by 118.70.13.36 on 27-Aug-2020