Distributed Generation Placement in Distribution Network
using Selective Particle Swarm Optimization
Gagandeep Kaur
Department of Electrical Engineering, I. K. Gujral Punjab Technical University, Jalandhar, Punjab, India
ABSTRACT
The lack of synchronization of power supply and demand in distribution network leads to poor voltage profile on lines and increase of real power loss. The integration of Distribution Generation (DG) unit in these networks offers consistent supply of electrical power which accordingly recovers system voltage profile and consequently reduces real power losses. Placement of DG units at optimized location with optimal DG rating participate a vital role in distribution network to synchronize power supply and demand. This study demonstrates the identification of optimized DG placement and optimal DG rating through optimization techniques, which were accomplished in MATLAB‟13. In minimization of multi-objective function, the technical hitches were resolved using weight factor within the operating limits of network. Three techniques were accomplished on IEEE 33-bus and IEEE 69-33-bus standard distribution networks. Among these implemented techniques, Selective Particle Swarm Optimization (SPSO) has given the best result thereby minimizing the real power loss up to 48.09% for standard IEEE 33-bus system and 63.02% for IEEE 69-bus system.
Keywords: Voltage profile, Real power loss, Distributed generation (DG), SPSO, Distribution network
I.
INTRODUCTION
In most of the developing countries, the centralized placed power plants supply to a multifaceted interconnected transmission and distribution networks. These networks are to transfer the power over long or short distances with an efficient manner at customer end [1]. In recent times a revolution of deregulation and restructured environment in centralized power system has confronted a challenge for power generating units to work independently and to meet the increasing power demand. This becomes a favorable opening to the dispersed generations such as distributed generators (DG) to present sufficient and dependable power release. Modernization of power system is enhancing the access of generated electricity & storage of power at distribution end. For consistent supply of power, placement of DG and demand organization is vital features as in [2]. For
Voltage Control (OCVC) has been implemented to investigate multi-objective problem to lessen voltage inaccuracies at DGs and pilot buses and reactive power deviations [6]. For improving voltage stability in distribution network, a multi objective performance index (MOPI) under several operating limits through Chaotic Artificial Bee Colony (CABC) has been introduced in [7]. For voltage profile increment and reduction of power losses through DG placement, Basu et.al has applied other methods such as fuzzy approach and Harmonic Search Algorithm (HSA) [8]. A simple fast load flow method has been applied for achievement of real power losses and voltage profile as in [9]. Here, with the installation of DG units of range of sizes at different site has been performed with backward forward sweep algorithm (BFSA). A researcher revealed a technique to offer solution through selection of candidate buses for DG location and rating. In this technique, prioritization of those candidate buses was done which were susceptible to voltage level and consequently, voltage stability margin were enhanced [10]. Placement of DG units on priority basis for power compensation in power deficiency period has been handled by continuous load flow and nodal analysis techniques [11]. Analysis of system performance on the basis of power reliability has been done with network reconfiguration in the continuation of DG units. Optimal DG placement has been identified with sensitivity analysis as in [12].
II.
PROBLEM FORMULATION
Power Loss Reduction Index
To lessen the power loss in distribution network system, power loss reduction index (PLRI), has been introduced and utilized to investigate the minimization of power loss in distribution network. The representation of PLRI is as below:
(1)
Where, PL (WDG) is loss of power while placing DG and PL (WODG) is loss of power when no DG in network.
Voltage Profile Improvement Index
Voltage Profile is a primary feature of consideration while analysing about power quality and power transfer in power distribution system. Voltage collapse sensitive buses are observed and DG is selected arbitrarily. Voltage profile improvement index (VPII) is another index to observe system voltage for continuity of power supply. VPII is represented as below:
(2)
Where, VP (WDG) & VP (WODG) are voltage profile with DG and without DG respectively.
Objective Function for DG Integration
For integration of DG unit in power distribution system, several objective functions have been utilized by researchers to recover power quality of network. Here, grouping of two independent indexes i.e PLRI and VPII to minimize the multi-objective function defined below:
𝑖 𝑖 𝑖 𝑡𝑖 𝑓 𝑓 (3)
The function f1 = PLRI and function f2= 1/VPII,
III.
OPTIMIZATION TECHNIQUES
A. Repeated Load Flow
For repeated load flow (RLF) a standard procedure has been followed for integration of optimum DG rating in distribution system [13]. Load flow analysis has been done iteratively using forward backward method until optimum results has come out. First of all DG ratings has been defined and load flow for each candidate bus was made to flow. For the defined DG ratings, a power loss for every participating bus has been reported. The bus location having minimum power loss was the optimum DG placement and the equivalent DG rating size was the optimum size.
B. Particle Swarm Optimization
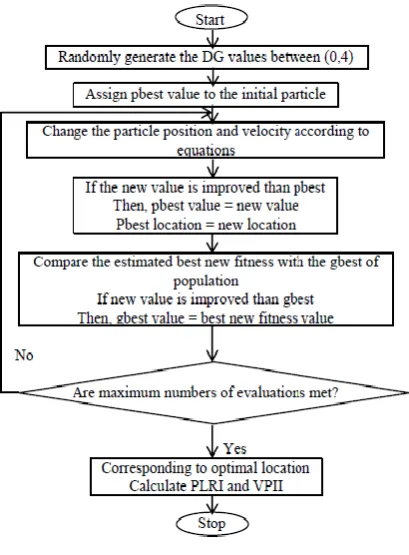
A stochastic search evolution computational procedure is again a popular population based and named Particle Swarm Optimization (PSO). Kennedy and Eberhart developed this technique by critically analysing the activities of group of fishes and flock of birds. In PSO algorithm, a number of particles in population presents in search space having n-dimensions and shift from their location as per information w.r.t time. On the basis of this enough information, particle modifies its direction and shift on the way to best position called pbest. The overall best position based on shift of neighbouring particles is called as gbest. The updating of position by particle is according to best position faced by them and their neighbours [14].
In n-dimensional search space, the particle position as:
𝑍 = ( 1, 2, …….., ) (4)
Based on it, the current position of particle as:
𝑆𝑘𝑖𝐷+1 = (𝑆𝑘𝑖𝐷 )+ (𝑆𝑘𝑖𝐷+1) (5)
𝑖 = 1,2,…, and 𝐷 = 1,2,…….,
Where, 𝑆𝑘 is the present particle position and (𝑆𝑘+1) the new position. The particle velocity in
n-dimensional search space is:
= (𝑣 1, 𝑣 2, …….., 𝑣 ) (6)
The updated velocity of particle is shown below: 𝑣𝑘𝑖𝐷+1= 𝑖 × 𝑣𝑖𝐷𝑘 + 𝑐1× 𝑟 𝑑 × (𝑝𝑏𝑒𝑠𝑡𝑖𝐷−𝑆𝑘𝑖𝐷) +𝑐2×𝑟 𝑑 × (𝑔𝑏𝑒𝑠𝑡𝑖𝐷−𝑆𝑘𝑖𝐷) (7)
Where 𝑣𝑘+1 = updated velocity 𝑣𝑘 = present velocity
pbest = individual best velocity gbest = overall best velocity
n = particles number in a population m = participants number in a particle rand = random values generated = acceleration coefficient of particle 𝑖 = inertia weight for each particle
The inertia weight is given by the equation:
𝑘 …(8)
Where, 𝑥 = maximum inertia weights 𝑖 = minimum inertia weights
k = current inertia weight 𝑘 = Iterations count (max)
Figure 1. PSO Algorithm
C. Selective Particle Swarm Optimization
In recent years, the improved versions of PSO technique have been proposed and used by researchers with objectives to increase usage of this technique with fast convergence speed and better optimal solutions. An advanced version of PSO is binary PSO (BPSO) through modulating search space to be binary. This technique has been developed by Kennedy and Eberhart and is a discrete version of PSO [16]. Again the advanced version of BPSO is SPSO, proposed by Khalil and Gorpinich [17], where solution quality is improved by adopting sigmoid transformation of velocity function for selection of search space. In SPSO technique, for search space a set of DN positions is 𝑆𝐷= [𝑆𝐷1, 𝑆𝐷2,……, 𝑆𝐷𝑁] for each D dimension, where DN are the selected positions in dimension D.
𝑠(𝑣𝑖𝐷𝑘+1)=𝐷𝑁 11+exp(−𝑣𝑖𝐷𝑘+1) (9)
𝑥𝑖𝐷𝑘+1= { 𝑆𝐷1 𝑖𝑓𝑠𝑖𝑔(𝑣𝑖𝐷𝑘+1) <1 𝑆𝐷2 𝑖𝑓𝑠(𝑣𝑖𝐷𝑘+1) <2 . .
𝑆𝐷𝑁𝑖𝑓𝑠(𝑣𝑖𝐷𝑘+1) <𝑁} (10)
Where, 𝑆𝐷1, 𝑆𝐷2,…..,𝑁 are the selected values for each particle in dimension D.
Velocity constraints [ 𝑖 , 𝑥] can be calculated using the following equation:
𝑣𝑖𝐷𝑘+1= { 𝑥,𝑖𝑓𝑣𝑖𝐷𝑘+1> 𝑥 𝑣𝑖𝐷𝑘+1, |𝑣𝑖𝐷𝑘+1|≤ 𝑥 𝑖 ,𝑣𝑖𝐷𝑘+1< 𝑖 (11)
𝑣𝑖𝐷𝑘+1= {𝑟 𝑑×𝑣𝑖𝐷𝑘+1, 𝑖𝑓 |𝑣𝑖𝐷𝑘+1|=|𝑣𝑖𝐷𝑘| 𝑣𝑖𝐷𝑘+1 𝑡𝑒𝑟 𝑖𝑠𝑒
The invariability of ith particle velocity value in a D-dimension at the minimum or maximum values can be ignored using the equation given below and push the particles going through the selected space.
To find out the solution for optimal DG placement and DG rating or size there would be key steps distribution system:
1. Indicate the number of dimensions
2. Identification of search space for all dimensions
3. To select an optimal solution from the search spaces by implementing SPSO
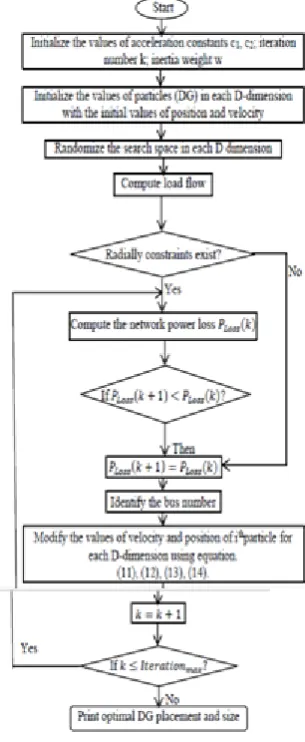
The buses of the network represent the search space of a specific dimension. For standard IEEE systems the candidate buses represents search space for a system dimension. The random selection of the DG size is for a particular bus of one dimension at a time. The SPSO after identification of search space of each dimension employs an optimal solution for enhancement of power quality. Figure 2 depicts the flow chart of SPSO technique.
IV.
RESULTS AND DISCUSSIONS
Both the test systems have been gone through load flow, optimal DG placement and DG rating have been identified using above proposed optimization techniques with simultaneously minimizing the objective function. How the simultaneous optimal placement of DG and optimal DG rating improve the power quality in terms of loss reduction and enhanced voltage profile have been compared and discussed in both test systems.
Figure 2: SPSO Algorithm
A. IEEE-33 Test System
To minimize the objective function in IEEE 33 test system, the two main parameters of concern i.e reduction of power loss and improved voltage profile have been analysed. For the system base voltage taken was 12.6 KV, the power losses (real & reactive) before DG placement has been found 210 KW and 143.0 KVAr respectively. The total apparent power loss was
254.065 for the base case. The minimum voltage profile was at bus-18 which was 0.90377 before DG placement in distribution network.
Table 1. Outcome After Dg Integration IEEE 33- Bus
System
RLF PSO SPSO
Real Power Loss (KW)
111.02 111.07 109
Minimum Voltage Profile
0.94251 Bus 18
0.94324 Bus 18
0.94900 Bus 18 Optimum DG
Rating(MW) &Placement
2.6 Bus 6
2.6509 Bus 6
2.5173 Bus 6
With the implementation of these techniques bus having minimum real power loss has been identified. In correspondence of that, optimal DG rating, power loss and voltage profile were calculated. The outcome after DG integration is displayed in table 1. After optimizing the indexes, the table-2 demonstrates the values of objective function “F”, 𝑓 1, & 𝑓 and function is minimized up to 0.5.
Table 2. Minimization Of Objective Function Objective
Function
RLF PSO SPSO
f 1 1.0 1.0 1.0 f 2 0.31026 0.30584 0 F 0.65513 0.65292 0.5
The comparison of results of techniques revealed that PSO has better findings than RLF, but overall SPSO has given best results.
B. IEEE-69 Bus System
distribution network. Table-3 presents the results after DG integration in 69- bus distribution networks.
Table 3. Outcome After Dg Integration 69- Radial Bus System RLF PSO SPSO Real Power Loss (KW) 84.065 84.117 83.20 Minimum Voltage
Profile
0.96259 Bus 27
0.96253 Bus 27
0.968 Bus 27 Optimum DG Rating
(MW) & Placement
1.8 Bus 61
1.79 Bus 61
1.857 Bus 61
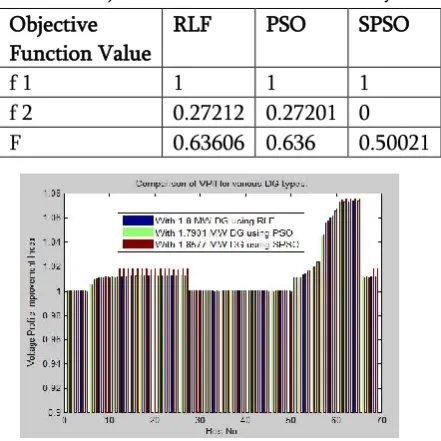
Results present that minimum power loss is 83.02 KW by integrating 1.857 MW DG at bus number 61. Simultaneously voltage profile of 0.968 has also been improved while using SPSO, better than other cases. The determination of VPII and PLRI were also done for all approaches which presents change in voltage profile and power losses. Figure 3 & 4 shows VPII & PLRI for RLF, PSO, and SPSO techniques with DG placement.
The multi-objective function has been minimized by using these three approaches. Table-4 displays the values for objective function F‟ for different cases and maximum minimization is up to 0.50021 with SPSO.
Table 4. Objective Function For Ieee-69 System Objective
Function Value
RLF PSO SPSO
f 1 1 1 1
f 2 0.27212 0.27201 0 F 0.63606 0.636 0.50021
Figure 3. Voltage Profile Improvement Index
Figure 4. Power Loss Reduction Index
V.
CONCLUSION
In this study, minimization of multi-objective function for two networks has been done which further calculates VPII and PLRI indexes for better voltage profile and less power loss. For 33-bus network the reduction in real power loss was observed to be 47.13% for RLF, 47.10% for PSO and 48.09% in case of SPSO. On the other side for 69-bus system, 62.637 %, 62.614% and 63.02% of power loss has been reduced by RLF, PSO and SPSO respectively. Voltage profile has been improved while placing DG unit. Study concludes that SPSO technique has given best results in both test systems.
VI.
REFERENCES
[1]. A. S. Safigianni, G. N. Koutroumpezis, and V. C. Poulios, "Mixed Distributed Generation Technologies in a Medium Voltage Network", Electric power Systems Research, vol. 96, pp. 75-80, 2013.
[2]. P. Chiradeja, "Benefit of Distributed Generation: A Line Loss Reduction Analysis", IEEE/PES Transmission and Distribution Conference & Exhibition: Asia and Pacific Dalian, China, pp. 1-5, 2005.
Electrical Power and Energy Systems, vol. 79, pp.42-52, 2016.
[4]. R. B. Prada, and L. J. Souza, "Voltage Stability and Thermal Limit: Constraints on the Maximum Loading of Electrical Energy Distribution Feeders", Proceeding of Inst. Electr. Engg.-Gen.Trans.Distrib., vol. 145, pp. 573-577, 1998.
[5]. D. Q. Hung, N. Mithulananthan, R. C. Bansal, "Analytical Expressions for DG Allocation in Primary Distribution Networks", IEEE Trans Energy Conv., vol. 25, no. 3, pp. 814-820, 2010. [6]. J. R. Castro, M. Saad, S. Lefebvre, D. Asber, and
L. Lenoir, "Optimal Voltage Control in Distribution Network in the Presence of DGs", Electrical Power and Energy Systems, vol.78, pp. 239-247, 2016.
[7]. N. Mohandas, R. Balamurugan and L. Lakshmi N., "Optimal Location and Sizing of Real Power DG Units to Improve the Voltage Stability in the Distribution System using ABC Algorithm United with Choas", Electrical Power and Energy Systems, vol.66, pp. 41-52, 2015.
[8]. P. S. Babu and R. M. Mohan, "Optimal Performance Enhancement of DG for Loss Reduction using Fuzzy and Harmonic Search Algorithm", IEEE International Conference on Electrical Electronics Signals, Communication & Optimization, Jan 24-25, Vishakhapatnam, India, 2015.
[9]. E. K. Bindumol and C. A. Babu, " A Simple and Fast Load Flow Algorithm for Sizing and Placement of DG in Radial Distribution System", IEEE International Conference on Electrical Electronics Signals, Communication & Optimization, Jan 24-25, Vishakhapatnam, India, 2015.
[10]. R. S. Al Abri, E. F. El-Saadany, and Y. M. Atwa, "Optimal Placement and Sizing Method to Improve the Voltage Stability Margin in a Distribution System using Distributed
Generation", IEEE Tranaction on Power System, Vol. 28, No.1, pp. 326-334, Feb 2013. 2015. [11]. M. Ettehadi, H. Ghasemi, and S. Vaez-Zadeh,
"Voltage Stability-Based DG Placement in Distribution Networks", Electrical Transaction on Power Delivery, vol.28, No.1, pp. 171-178, Jan 2013.
[12]. R. S. Rao, K. Ravindra, K. Satish, and S. V. L.Narasimham," Power Loss Minimization in Distribution System using Network Reconfiguration in the presence of Distributed Generation", IEEE Transaction on Power System, vol.28, No.1,Feb 2013.
[13]. N. Acharya, P. Mahat, and N. Mithulananthan, "An Analytical Approach for DG Allocation in Primary Distribution Network", Electrical Power and Energy Systems, vol.28, pp. 669-678, 2006.
[14]. J.Kennedy and R. Eberhart, "Particle Swarm Optimization", Proceeding of IEEE International Conference on Neural Network (ICNN‟95), vol. 5, pp. 1942-1948, Perth, Australia, Nov 29-Dec 1, 1995.
[15]. R. C. Eberhart , and Y. Shi, " Comparing Interial Weights and Constriction Factor in Particle Swarm Optimization", Proceeding of International Congress on Evaluating Computation, pp. 84-88, San Diego California, Piscataway, NJ: IEEE Service Center, 2000.
[16]. J. Kennedy and R. Eberhart, " A Discrete Binary Version of the Particle Swarm Algorithm", IEEE International Conference on Systems, Man and Cybernetics(SMC 97), Vol.5, pp. 4104-4108, 1997.
[17]. T. M. Khalil and A.V. Gorpinich, " Optimal