INTRODUCTION
The effectiveness as well as the optimality of the water tower constitute one of the factors influencing the functioning of the water distri -bution system as the final link in water supply systems, and simultaneously form a decisive ele -ment of the correct functioning of the network. It is above all a measure of the effectiveness of the entire system, and the function that it fulfils is fairly complex [Abe and Peter 2010]. The sub -system distributes water to various recipients, which are spread over a given area. The distrib -uted water should fulfill specified requirements of quantity, quality and pressure. This is suggested and underlined by the authors of several publica -tions [Boulos and Ormsbee 2009]. The computer network model facilitates the observation, regu -lation of the pressure and flow of water, as well as aids in making decisions concerning the usage, expansion and modernization of the water tower to be undertaken. The effectiveness and practical usefulness of the flow model in SDW depend on the construction of the model and on the quality and reliability of the baseline data for the com -puter simulations, which in turn ensures the op
-timal undertaking of correct decisions. Some of the many computer programs currently available on the IT market mainly serve to hydraulically calculate SDW; however, they do not fulfill the requirements necessary for use in flow modelling in operational practice, nor the designing and ex -pansion of the existing systems. [Siwoń 2009].
THE COMPUTER MODEL DESIGN
In the process of the creation of the water tower model of Mońki, the digital foundation used was the local spatial development plan, on which the water supple network and localization of intakes were marked. The next step was to in -troduce the foundation into the EPANET 2.0 soft -ware with the aim of creating a model to reflect the actual state of the water distribution system of Mońki. This model comprises a set of nodal connections which includes connectors and one reservoir, water supply conduits and a pump. Val -ues were assigned to each of the afore-mentioned objects, necessary for later hydraulic calculations [Darsono, Labadie 2007]. For reservoirs, a hy -draulic value equivalent to their baseline value
Published: 2018.11.01
Volume 19, Issue 6, November 2018, pages 254–258
https://doi.org/10.12911/22998993/89832
Efficiency and Optimum Decisions using the Simulation
of Water Distribution System
Agnieszka Trębicka
11 Department of Technology and Systems of Environmental Engineering, Białystok University of Technology,
ul. Wiejska 45E, 15-351 Białystok, Poland, e-mail: [email protected]
ABSTRACT
The paper presents the process of computer modeling to reconstruct the actual working conditions of the water supply network in Mońki, Białystok county. The calculations enabled to simulate the operation of the network and make decisions affecting the efficiency of the entire system. The EPANET 2.0 computer software, which was cre
-ated by the U.S. Environmental Protection Agency (EPA), was used in the research. It allows for periodic hydraulic simulations and provides an image of water operation in the pressure pipeline network. The study included the model of the evaluated network in terms of basic quality parameters such as flow velocity, pressure, unit losses, water age and operating conditions during the simulated network failure.
was assigned, while a characterisation of the work of a pump was created in the EPANET 2.0 soft -ware [Rossman 2000]. In order to form a charac -terisation, it is necessary to add a new curve, for which we then assign the flow values and head [Studziński 2014]. The characterisation is created automatically in the programme.
The following step was to assign each of the terrain elevation nodes and tapping points. The elevation of the terrain corresponding to each node was obtained from the website http://www. wysokosc.mapa.info.pl/. Next, the demand for water and tapping points for each node was calcu -lated. Pipes were assigned the following param -eters: diameter, length and roughness coefficient. Such parameters as the length and diameter of pipes were obtained from the water company in Mońki. The value concerning the roughness co -efficient takes into account the type of material from which the pipe is made. For pipes, the EPA -NET 2.0 software calculated the speed, flow rate and pressure losses.
CHARACTERIZATION OF THE MODEL
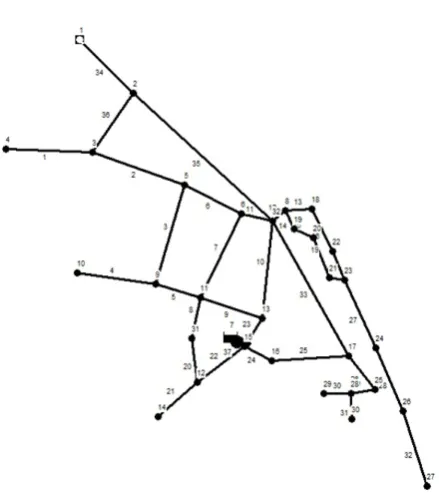
The water supply network presented in fig. 1 has become a simplified computer model of the water supply network in Mońki. The model was created using the EPANET 2.0 software. In the analysed system, pipes are laid in the range of 164.9 to 177.9 m a.s.l. The total water consump -tion constituted 42.07 m3/h. Owing to the 24-hour simulation of water consumption in the network, a graph of water consumption by hour was ob -tained. The hour with the highest total water con -sumption was 19:00. There is also high water consumption at 9:00 and 13:00, while the lowest is at 1:00 and 2:00. Water consumption is linked to the work cycle of residents. The water pres -sure in the system is 5.18–17.85 m H2O, with the average pressure at 13.18 m H2O. In all pipes, the pressure is within the boundaries of normative water pressure, which stands at 5.0–60.0 m H2O. The speed of the water flow in the network stands at 0.01–0.37 m/s, with the average at 0.1167 m/s.
The model of the water supply network in Mońki includes: the water intake along with the reservoir on ul. Szkolna, together with the pump with a water pressure of 40 m H20 and flow of 56 m3/h, nodes – 31 points, water supply pipes – 36 elements.
SIMULATION OF THE WATER SUPPLY
NETWORK
The use of a computer simulation to create a water supply network model of Mońki had the aim of carrying out a detailed analysis of its effec -tiveness and optimal work, and above all served as an aid in carrying out appropriate decisions in difficult and unforeseen circumstances that arose within the network.
The simulation of the water supply network model for Mońki began with a test of the water supply network functioning in its current state, which served as a reference point in later com -parisons of expansion and effectiveness, linked to the use of a number of variants concerning the most characteristic and unforeseen situations in which the changes in the functioning of the sys -tem can be observed [Machón et al. 2007]. The simulations carried out concerned the expansion of the network through: adding new staple con -nections, the construction of a new water tank and water intake as well as checking the functioning of the network in various emergency situations, e.g. linked with the exclusion of faulty pipes from the network. In this paper, several examples of the general analysis of the model of the water dis -tribution system are presented.
Figure 1. Model of the analysed fragment of the wa
Variant 1 – reflecting the current state
Variant no. 1 reflects the current state of the modelled water supply network. Calculations were made for the hour at which the water con -sumption was at its highest.
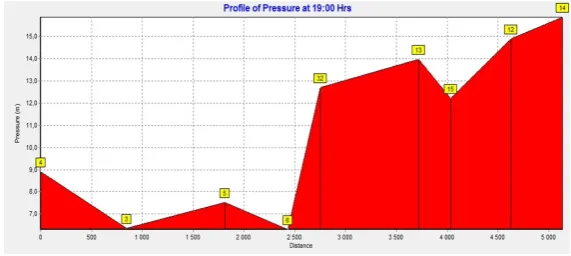
Figure 2 presents the pressure profile for pipes in the main pipeline network.Figure 3 pres -ents the speed of water flow in the main pipeline network of the modelled system.
In the analysed model, water pressure stands at 5.18–17.85 m H2O with a network average of 13.18 mH2O. The speed of the water flow is from 0.01 m/s to 0.37 m/s. The average speed in the network is 0.1167 m/s. In hours of maximum wa -ter consumption in the network, the intake of wa -ter reaches a value of 373.65 m3/h.
Variant 2 – an expansion of the network in which
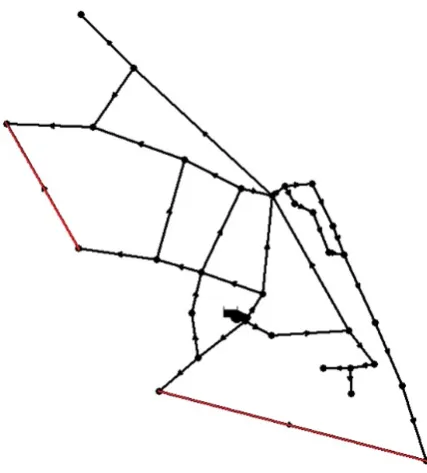
two connections were added, i.e. pipeline no. 38 (with a diameter of 100 mm) between nodes no. 4 and 10 and pipeline no. 39 (also with a diameter of 100 mm) between nodes no. 27 and 14.
Adding new connections increased the pres -sure in the network. The average pres-sure rose from 13.18 m H20 to 13.24 m H20. The minimum pressure in the network reaches 5.26 m H20, and the maximum amounts to 18.13 m H20. However, there was a drop in the speed of water flow in the network. The average speed fell from 0.1167 m/s to 0.10 m/s. The minimum speed of water flow in the network stands at 0.01 m/s and the maximum at 0.24 m/s. The water consumption fell from 373.65 m3/h to 352.91 m3/h. Figure 5 presents the pressure profile in the main pipeline of the mod -elled network for variant no. 2.
On the basis of the SDW model for the current state of Mońki (variant no. 1), very low values for the speed of water flow were recorded. It is recommended that the water flow in distribution pipes be in the range of 0.5–1.0 m/s. Calculations made with the EPANET software gave values of 0.01–0.37 m/s, with the average speed in the sys -tem being 0.1167 m/s. The minimum normative value for the speed of water flow was not reached
Figure 2.Pressure profile for pipes in the main pipeline network
in any of the pipelines. This could indicate an over-sizing of the researched network. Such low speed values result in water remaining in the net -work for a longer amount of time and the genera -tion of regions at risk of water stagna-tion.
According to the Regulation of the Minister for Infrastructure of 12 April 2002 on technical conditions of buildings and their locations (Jour -nal of Laws, 2009, No. 56, item 461 ), the wa -ter pressure in the wa-ter supply installations in a building, excluding the anti-fire hydrant, should equal at least 0.05MPa (0.5 bars ≈ 5 m H20) and no more than 0.6MPa (6 bars ≈ 60 m H20) at ev -ery draw-off point. For variant no. 1, the pressure values are in the range of 5.18–17.85 m H2O with an average network value of 13.18 m H2O. The acceptable water pressure values were reached in all pipelines of the network.
The project continues with a simulation car -ried out with the aim of improving the parameters of the network and an analysis of the function -ing of the network under various work-ing con -ditions. In this paper, variant 2 is presented, in which an expansion of the network is proposed. In the first part, two new connections were added (pipes no. 38 and 39). This caused a slight rise in the pressure in the network. The average pressure amounted to 13.24 m H2O, and the effectiveness of this variant in terms of improving the water pressure was 100.5%. However, there was a fall in the average speed of water flow to 0.1 m/s, and the efficiency was 85.69%. In the second part, three new connectors were added (pipes no. 40, 41 and 42). In this variant, there was also a slight increase in pressure and the efficiency rose by the same value as in the previous variant, reaching a value of 100.5%. The speed of water flow also fell, and in comparison to variant 1, the efficiency reached 79.4%. In the third part, one new con -nection was added to the variant (pipe no. 42). The pressure and efficiency rose by the same value as in previous variants. In comparison with variant 1, the speed of water flow also fell and the efficiency reached 80.6%.
An analysis of the results indicates that the current network is over-sized and an additional water source would improve the parameters in the network.
CONCLUSIONS
As a result of the simulations carried out on the water supply model, the following conclu -sions were formulated:
1. With the aid of the computer model of Mońki, simulations of various operating conditions of an unpredictable nature can be carried out, Figure 4. Model of the water supply network of
Mońki in variant no. 2, including two new connec
-tions (marked in red) on a scale of 1:25 000
with an observation of the network in the course of the given situations also being pos -sible. This model allows us to find the so-called “weak points” of the network (these could be the points with a somewhat low speed of water flow or somewhat low pressure) and carry out simulations with the aim of improving the pa -rameters of the network.
2. The pressure values in all pipes of the network are in the range of acceptable values.
3. The values obtained for the speed of water flow in the network are somewhat low. The mini -mal normative speed was not reached in any of the pipes. This could be an indication of over-sizing of the network or a wrong choice of pipe width.
4. The best results of the simulation of the opera -tion of the network were obtained by adding a new connection to the network, which caused a rise in the pressure and speed of water flow. 5. After analysing the results, we can state that
the best parameters for the water supply sys -tem of Mońki were obtained for the variant in which a simulation of the addition of new wa -ter sources was carried out.
Acknowledgements
The research was carried out as part of project no. S/WBIIŚ/2/2014 thanks to financial support for research and science of the Ministry for Sci -ence and Higher Education.
REFERENCES
1. Abe N., Peter B.C. 2010. Epanet Calibrator – An integrated computational tool to calibrate hydrau
-lic models. In: Boxall & Maksimovic (Eds), Inte
-grating Water Systems.
2. Boulos P.F., Lansey K.E., Kamey B.W. 2009. Com
-prehensive Water Distribution Systems Analysis Handbook for Engineers and Planners. Pasadena, MWH Soft, California.
3. Darsono S., Labadie J.W. 2007. Neural-optimal control algorithm for real-time regulation of in-line storage in combined sewer systems. Environmen
-tal Modelling & Software, 22, 1349–1361. 4. Machón I., López H., Rodriguez-Iglesias J., Mara
-ñón E., Vázquez I. 2007. Simulation of a coke wastewater nitrification process using a feed-for
-ward neuronal net. Environmental Modelling & Software, 22, 1382–1387.
5. Rossman L.A. 2000. EPANET 2 Users Manual EPA United States Environmental Protection Agency, Cincinnati.
6. Siwoń Z. 2005. Symulacje modeli przepływów w systemach dystrybucji wody – problemy kalibracji i weryfikacji modeli: GIS modelowanie i monito
-ring w zarządzaniu systemami wodociągowymi i kanalizacjami. Materiały konferencyjne, Instytut Zaopatrzenia w Wodę i Budownictwa Wodnego Politechniki Warszawskiej, Saur Neptun Gdańsk, Warszawa, pp. 158.
7. Studziński J. 2014. Some algorithms supporting the water network management by use of simula
-tion of network hydraulic model. Industrial Simu