Vol. 3, Issue 9 (September. 2013), ||V2|| PP 36-42
Image Extraction using Image Mining Technique
Prof. Samir Kumar Bandyopadhyay, Mrs. Sayantani Ghosh
Dept. of Computer Sc. & Engg. University of CalcuttaDepartment of Computer Science and Engineering University College of Science and Technology University of Calcutta
Abstract: - Image Mining, an evolutionary approach of Data Mining is a technique to extract previously unknown information hidden within an image. It is concerned with knowledge discovery, image data association, and additional patterns which are not clearly accumulated in the image. Thus the primary objective of mining is to generate all significant patterns without prior information of the patterns. Image Mining is used in variety of fields like medical diagnosis, space research, remote sensing, and agriculture industries and even in educational field.
This paper primarily focuses on image manipulation and extraction of requisite information using image mining technique. An attempt has been made to perform different computation on images like computation of standard deviation, cross- correlation coefficient to measure degree of similarity between images, and image segmentation by Thresholding. These operations are accomplished by using different functions available in Matlab.
Keywords: - True colour Image, Greyscale Image, Image Mining, Image Processing, Standard Deviation, Cross- Correlation, Image Segmentation, and Thresholding.
I. INTRODUCTION
Image-An image is an array, or a matrix, of square pixels (picture elements) arranged in columns and rows. Alternatively, an image can be as a representation in words of a sensory experience or of an object that can be known by one or more of the senses.
Images can be classified as follows:
(1)Greyscale Image – In an 8 bit greyscale image each pixel is assigned intensity that ranges from 0 to 255. It is also referred to as a black and white image, where (0) implies black and (255) implies white colour. However such an image also includes many shades of grey. A normal grey scale image has a depth of 8 bit colour equal to 256 greyscales. Some grey scale images have more grey scales, for instance 16 bit = 65536 grey scales. In principle three grey scale images can be combined to form an image with 281,474,976,710,656 grey scales.
(2) True colour Image- It is an image that uses 24 bit to represent each pixel. This implies that more than 16 million colours can be represented. A true colour image has 24 bit colour depth which equals 8 x 8 x 8 bits = 256 x 256 x 256 colours =16 million colours.
II. IMAGE MINING
Image Mining is an interdisciplinary challenge that draws upon proficiency in computer vision, digital image processing, image extraction, data mining, machine learning, databases, and artificial intelligence. Image mining is not only the simple fact of recovering relevant images; the aim is the innovation of image patterns that are noteworthy in a given collection of images.
Image mining technique has got two main operations. (1) Collection of large amount of images and (2) Mining of the images and alphanumeric data. Content Based Image Retrieval technique is based on query classes that include colour, texture, shape, attributes, and text and domain concepts. CBIR is implemented on object- oriented queries that search for images which contain particular object. This is achieved by grouping activities that produces “blob world” representation of images which is the transformation from raw pixel data to a small set of localized coherent regions in colours and textual space.
2.1 Image Mining Process:
Step 1:Read image from image database.
Step 2:Pre-process the image to improve the quality of the image. Pre-processing involves identification and labelling of the objects contained in the images using an image query processing algorithm. The output of the pre-processing step will be a set of records, one for each image, containing the object identifiers for the objects contained in the image. This step is quite intensive since it is a similarity search between images, actually image descriptors.
Step 3: Perform Transformation of images into database like table. In the table each row stands for a pixel. Thus the cardinality (no of rows) corresponds to the total number of pixels in an image. The columns correspond to the features associated with a pixel. These features can be local variation, grey level, entropy, contrast, mean, etc.
Step 4: Once the database table has been obtained, perform feature extraction.Features characteristics of the objects of interest, if selected carefully, are representative of the
maximum relevant information that the image has to offer for a complete characterization of the lesion.
Step 5: Once features have been extracted, perform mining using suitable data mining techniques to identify suitable patterns.
Step 6: Finally, the resulting patterns are evaluated and interpreted to obtain the final knowledge, which can be applied to applications.
2.2 Objectives:
The primary objective of image mining is to process low level pixel representation enclosed in a raw image or image sequence to recognize high level image objects and relationship. Image mining in general deals with the study and development of new technologies which helps in the extraction of implicit knowledge and image with data relationship or other patterns not explicitly stored in the images. The essential component of image mining is the identification of similar objects in different images.
The goal of image mining is to attain the following issues:
1. Determination of association among different objects / images from image database.
2. Perform classification of objects using suitable classification algorithm like classification using decision tree. 3. Identification of sequential pattern from the image.
4. Identification of time series pattern.
Thus image mining aims at generating all considerable patterns without any information of the image content, the patterns types are different. They could be classification patterns,
description patterns, correlation patterns, temporal patterns and spatial patterns. Image mining handles with all features of huge image databases which comprises of indexing methods, image storages, and image retrieval, all regarding in an image mining system.
2.3 Applications:
The below mentioned specifies few of the many applications of Image Mining:
Image Mining provide significant application in the domain of machine learning, image processing, image retrieval, data mining, database, computer vision, and artificial intelligence.
Knowledge discovery of traffic/ people behaviour.
Egeria detection where Egeria is a type of weed found in various lands and water regions over San Joaquin and Sacramento deltas.
Mining of Tissues and Biological data.
III. IMAGE MINING WITH IMAGE PROCESSING
3.1 Image Processing:
Image processing is a method to convert an image into digital form and perform some operations on it, in order to get an enhanced image or to extract some useful information from the image. It is a type of signal dispensation in which input is image, like video frame or photograph and output may be image or characteristics associated with that image.
that all types of data have to undergo while using digital technique are Pre- processing, enhancement and display, information extraction.
3.2 Objectives of Image processing
The purpose of image processing is divided into 5 groups. They are: 1. Visualization - Observe the objects that are not visible.
2. Image sharpening and restoration - To create a better image. 3. Image retrieval - Seek for the image of interest.
4. Measurement of pattern – Measures various objects in an image. 5. Image Recognition – Distinguish the objects in an image.
3.3 Role of Image Processing in Image Mining
With the advancement of Computer Technology, extensive amount of images are being generated and presented in an electronic form. These images contain large amount of hidden information which cannot be realized until mined using a suitable mining algorithm. Moreover most existing data mining algorithms that have been designed is most suited for mining categorical or numerical data, and are not suited for image. Thus the basic idea behind image mining is to extract requisite information from images which are not explicitly specified.
On the other hand, most image processing methods were focused on processing, not analysing the image, thus, few of them can be used to mine the image.
Thus a framework based on decision tree has been specified to describe the implementation of image mining and image processing. It can automatically mine useful information of the given images and learn the effect within. The learned effects can even be applied to process other images. This helps in creating an image processing model with a desired effect by using variety of training images.
Figure 1
IV. IMAGE MINING WITH MATLAB
Training Image
Image Transformation
Image Mining
Mining Results
Image Model
Image Processing
Image processing and analysis is a mechanism of extracting and quantifying objects and patterns in image data to retrieve meaningful information. Image analysis involves the conversion of features and objects in image data into quantitative information about these measured features and attributes.
Its benefit over traditional methods of analysis is as follows:
1) Human vision, while highly sensitive, can be easily biased by pre-conceived notions of objects and concepts; automated image analysis provides an unbiased approach to extracting information from image data and testing hypotheses.
2) Once an image-analysis routine is devised, it can be applied to a large number of microscopy images, facilitating the collection of large amounts of data for statistical analysis.
4.1 Steps involved in image analysis are as follows: Step1:Read a digital image.
Step2:Correct the imperfections that a digital image possess like noise, uneven illumination, defective pixels, etc. to enhance the contrast to accentuate features of interest in the image for subsequent analysis.
Step 3: Apply different computational techniques to extract requisite features and patterns from the images. Step 4: Quantify the extracted features and objects.
4.2 Image Representation using Matlab:
In MATLAB a binary / grey-scale image is represented by a 2-dimensional array, whereas a colour image is represented by a 3-dimensional array (one 2-dimensional array for each of the colour planes or colour channels red, green and blue).
The origin of the image is in the upper left and the size of the image is defined by the parameter width (number of columns of the array) and height (number of rows of the array).
When representing an image using coordinate system, x- and y-coordinates are chosen such that the z-axis points to the front.
A single point within the image is called pixel. A grey-scale or binary pixel consists of one data value; a colour pixel consists of 3 data values (each for one of the colour channels).
The most common data types of the individual pixels are: uint8 unsigned integer: data range 0-255 double double precision float: data range 0.0 ... 1.0
Binary images have pixel values of 0‟s and 1‟s resp. 0.0 and 1.0.
V. PROPOSED ALGORITHM
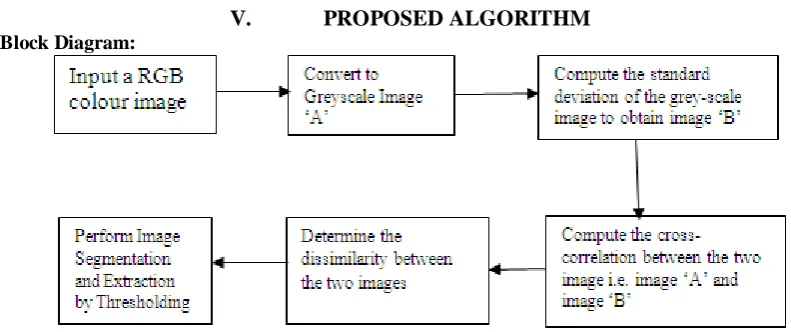
5.1 Block Diagram:
Figure 2 - Block Diagram for image segmentation process of the proposed algorithm.
5.1 Algorithm:
The objective of this algorithm is to compute the dissimilarity between the two images represented in the form of two matrixes to generate the resultant matrix. Among the two input images, one image is the grey scale of the original image „A‟ and the other image is the image obtained from the computation of the standard deviation of the input image. Then perform segmentation and extraction on the resultant image by the process of Thresholding.
Step1: Read a RGB colour image and convert it into a grey scale image „A‟.
Step2: Compute the standard deviation of the grey scale image and generate a resultant image „B‟ which is of the same size of the input image.
Step3: Compute the cross- correlation coefficient between the two image i.e. image „A‟ and image „B‟ to obtain the measure of similarity between the two images.
Step4: Determine the absolute difference between the two images.
This is obtained by considering the matrix representation of each image, where we subtract each element of the matrix „B‟ from each element of the matrix „A‟ to obtain a resultant matrix „Z‟.
Step5: Perform segmentation of the image „Z‟ to perform extraction by the process of Thresholding.
5.2 Input Images:
Fig. 3: The Original Input Image
Fig 4: The Greyscale version of the Original Image
5.3 Resultant Images:
The following images specify the intermediate the result and the final resultant image obtained after the successful execution of the program code of the above specified proposed algorithm
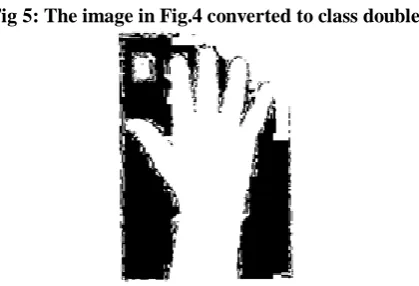
Fig 5: The image in Fig.4 converted to class double
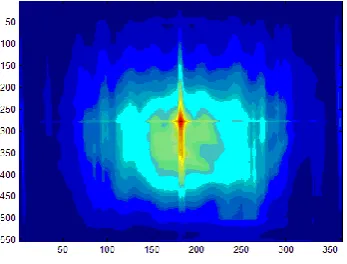
Fig 7: The image depicting the result of the cross- correlation between the image in Fig.5 and the image in Fig.6
Fig 8: The image depicting the result after the computation of absolute difference between the image in Fig. 5 and image in Fig. 6
Fig 9: The final resultant image after the Thresholding of the image in Fig.8
VI. CONCLUSIONS
Deviation of the input image and the determination of similarity measure between images by Cross- Correlation Coefficient, since Image Segmentation is a primary phase of Image Mining, . To implement this, the design phase is successfully implemented through Block Diagram. The suitable algorithm has been written, finally the corresponding code is also written using Matlab. The program code has successfully executed and the desired output is generated , which has been specified in this paper. The input image on which we have worked on are the X- Ray Images, however the same algorithm and program code can implemented on other images as well.
REFERENCES
[1] www.iiste.org/Journals/index.php/CEIS/article/download/514/398? [2] www.ijcset.com/docs/IJCSET12-03-12-027.pdf?
[3] https://smartech.gatech.edu/bitstream/handle/1853/6632/GIT-CC-98-12.pdf;jsessionid=D3CB7D12F22 509 D258EC4C48288FD18C.smart1?sequence=1
[4] http://www.iis.sinica.edu.tw/page/jise/2009/200907_02.pdf
[5] http://www.ece.uvic.ca/~aalbu/computer%20vision%202010/L7.%20Image%20Processing%20for%20fe ature%20extraction.%20Introduction%20.pdf
[6] http://www.public.asu.edu/~huanliu/papers/mis02.pdf [7] http://www.iis.sinica.edu.tw/page/jise/2009/200907_02.pdf [8] http://www.webopedia.com/TERM/T/true_color.html
[9] http://siddhantahuja.wordpress.com/tag/normalized-cross-correlation/ [10] http://www.mathworks.in/help/images/ref/imabsdiff.html
[11] http://www.jatit.org/volumes/Vol34No1/1Vol34No1.pdf