Kulkulewar et al. World Journal of Engineering Research and Technology
DESIGN AND ANALYSIS OF AMPLITUDE AND FREQUENCY
MODULATION USING MATLAB SIMULINK
Ashlesha Kulkulewar*, Harshal Daware, Kanika Mittal, Komal Bhise, Prof. Kanchan Wagh
St. Vincent Pallotti College of Engineering and Technology, Nagpur, Maharashtra, India.
Article Received on 30/07/2016 Article Revised on 04/08/2016 Article Accepted on 09/08/2016
ABSTRACT
In day to day life for communication, message signals need to be
transmitted over a wide range without any mixing or interference of
another signal. So, Modulation is a process in which the message
signal is mixed up with high frequency signal i.e. carrier signal so that
it can be used for communication over a long distance. Modulation
process is then classified depending on various parameters and
requirements as Amplitude Modulation, Frequency Modulation and Phase Modulation. This
paper gives an idea about the types of Modulation Process and brief description about the
Amplitude and frequency modulation Modulation technique using Simulink, GUI and
Spectrum analyzer .It also explains about working, block diagram, spectrum and variation of
waveforms by changing different parameter. Simulink tool is used for designing model for
Amplitude modulation. Basically it is software developed by mathworks in MATLAB which
gives the advantage of building block diagrams, analyzing dynamic systems and simulating
them. Analyzing the response of the amplitude modulation is somewhat tedious, so GUI
makes it easier to analyze by varying different parameters. Spectrum analyzer gives output in
form of the band of frequency. Using spectrum analyzer, the magnitude of an input signal
versus frequency within the full frequency range of the instrument can be measured.
KEYWORDS: Frequency modulation, MATLAB, SIMULINK, GUI, spectrum analyzer.
World Journal of Engineering Research and Technology
WJERT
www.wjert.org
SJIF Impact Factor: 3.4191.1
*Corresponding Author Ashlesha Kulkulewar
St. Vincent Pallotti College of Engineering and Technology, Nagpur,
INTRODUCTION
Modulation is the process in which high frequency carrier signal is varied in accordance with
message signal which is having low frequency.
This message signal is also called as a modulating signal this modulating signal is also known
as base band signal.
The output signal obtained after the modulation is called as the modulated signal. The carrier
signal is always greater than the modulating or message or baseband signal.
Amplitude modulation (AM) is obtained if amplitude of the carrier signal is varied in
accordance with the modulating signal.
This is all about modulation and t its classification. Among all these types of modulation,
Amplitude modulation is introduced in detail in this paper.
Simulink is a software which is used for building, simulating and evaluate different systems.
it contains various diagramming tools and has a library consisting different functional blocks
like adder, differentiator, integrator, gain etc.
Need of Modulation
1. Increases the range of communication: As the message signal is having low frequency, noise signals get easily mixed up with message signal. So message signal or modulating
signal gets highly attenuated and cannot travel over a longer distance.
2. Avoid mixing of signal: Since in communication channel noise signal is present. so when message signal gets transmitted through communication channel noise signal gets mixed up.
therefore due to amplitude modulation, mixing of signal is avoided.
3. Improve quality of reception: Since due to amplitude modulation, signal can travel over longer distance without distortion. so at receiver when original signal is obtained due to
demodulation, quality of received signal will be good.
First part contains brief description about what is amplitude modulation its need, block
diagram, waveforms. Second part contains how we can use Simulink model for evaluating
Since this paper contains Simulink model on the amplitude modulation, so description about
modulation is mentioned below.
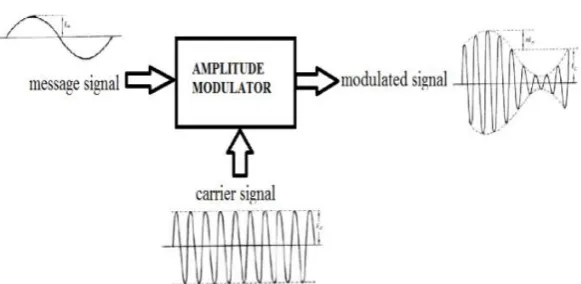
Amplitude Modulation
The process in which amplitude of the carrier signal is varied in accordance to the modulating
signal is called the amplitude modulation .the carrier voltage and the modulating voltage,
vcand vm, respectively, be represented by.
vc = Vc sin wct
vm = Vm sin wmt.
In amplitude modulation, the high frequency carrier signal is used. This high frequency
carrier signal is having greater strength as compared to the modulating signal. Thus in
amplitude modulation, carrier signal changes as per the instantaneous value of the modulating
signal, so that the output obtained after the amplitude modulation can be used for the
communication purpose.
Note that Amplitude modulation does not affect the phase of the modulating signal and
carrier signal.
Figure 1: Block Diagram of Amplitude Modulation.
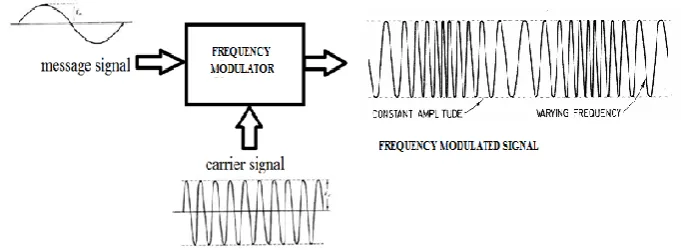
Frequency Modulation
When the frequency of a carrier signal is varied keeping amplitude and phase constant
according to the modulated signal then the desired signal obtained is frequency modulated
Figure 2: Block Diagram of Frequency Modulation.
Let the message signal will be given by
vm= Vm sin (wmt+m)
vc= Vcsin (wc+c)
Where, vc= instantaneous value(of voltage and current)
Vc= (maximum) amplitude
wc= angular velocity, radians per second(rad/s)
c= phase angle, rad.
If any one of these parameters is varied in accordance with another signal, normally of a
lower frequency, then the second signal is called the modulating, and the first is said to be
modulated by the second. If the frequency of the carrier wc is made to vary, frequency
modulated wave is obtained. It is assumed that the modulating signal is sinusoidal. This
signal has two important parameters which must be represented by the modulation process
without distortion, specifically, its amplitude and frequency.
GUI
Graphical User Interfaces in Matlab is very simple. A good place to begin learning about GUI
development on the Matlab platform is to first understand how Matlab manages graphical
objects. This platform makes and excellent choice for developing interactive interfaces as the
previous versions of Matlab had a noticeably clumsier and less mature feel when to came to
developing GUI’s. Developing GUI’s on Matlab is a breeze I would recommend a migration
to Matlab as it as a more stable and a more mature platform where many of the bugs,
Basically if you see that knowledge of neither platform is necessary to use matlab properly.
Simulation of Amplitude modulation and Frequency modulation using MATLAB Simulink
Using MATLAB Simulink is easy for anyone as the interface designed is very easy to
understand. One just need to drag the blocks they need for the desired output from the inbuilt
library given.
After placing the blocks on the correct place join them with the arrows and check the output.
One can also change the parameters of any block as per requirements by just simply double
clicking on it.
Blocks used Specifications
Sine Block It is used for the message and the carrier signal.
Gain It multiplies the input given to it with a constant
value.
Product The output of this block gives a multiplied signal
of two incoming signals.
Sum It is used to add or subtract the inputs given to it.
Display/Scope This block is used to see the results generated
during the simulation.
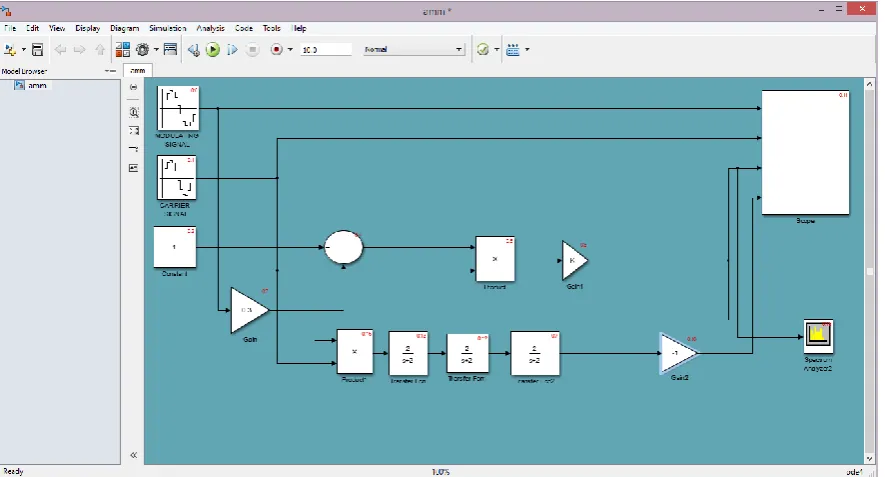
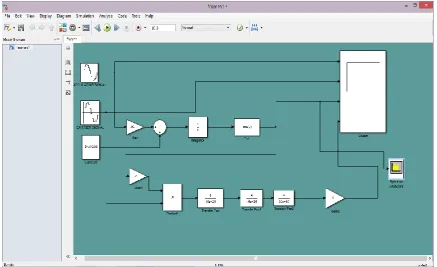
Simulink Model
Given below is the Simulink model for Amplitude and Frequency Modulation and
Demodulation.
Fig 4: Simulink model of frequency Modulation and Demodulation using scope and spectrum analyzer.
RESULT
Following is the result of the above Simulink model.
Fig 6: scope output for amplitude modulation & demodulation.
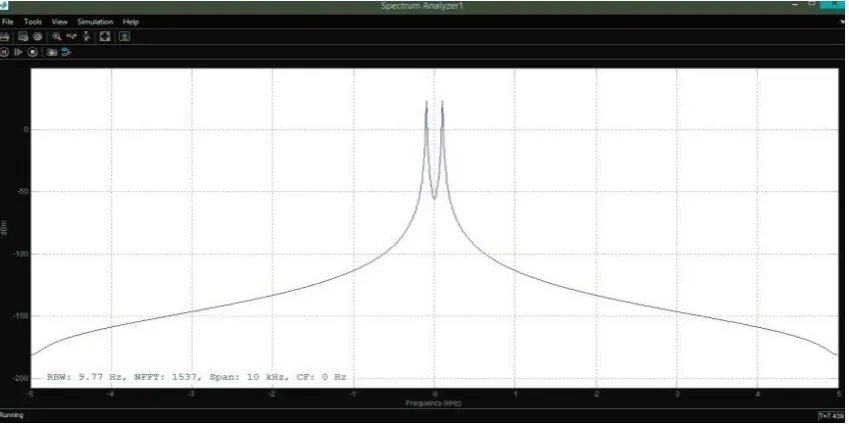
Fig 8: spectrum analyzer output for amplitude modulation.
Above graph contains modulating wave, carrier wave, modulated wave and demodulated
wave.
The first waveform is of modulating wave.
The second waveform is of carrier wave with high frequency.
The third waveform is of Modulated wave.
The fourth waveform is Demodulated wave.
AMPLITUDE AND FREQUENCY MODULATION USING GUI.
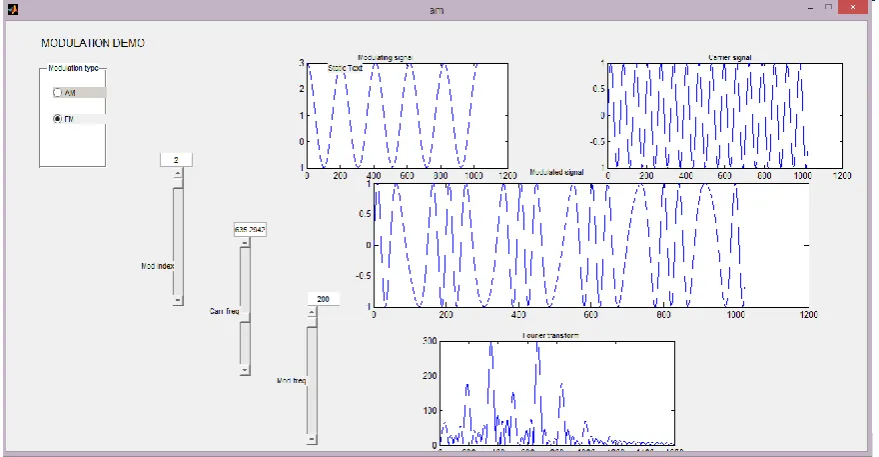
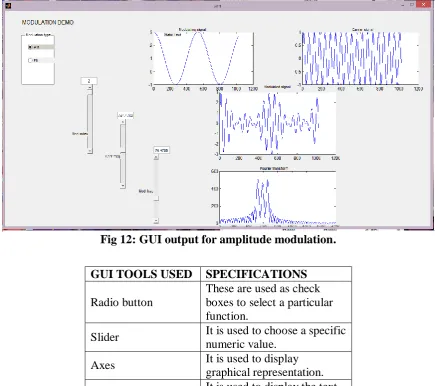
Fig 12: GUI output for amplitude modulation.
GUI TOOLS USED SPECIFICATIONS
Radio button
These are used as check boxes to select a particular function.
Slider It is used to choose a specific
numeric value.
Axes It is used to display
graphical representation.
Edit text It is used to display the text
given by the user.
CONCLUSION
Thus we have studied the Amplitude and Frequency Modulation and Demodulation using
various functional blocks in simulink. Also we analyzed output waveforms of Amplitude and
Frequency modulation and Demodulation.
In this we have done spectral analysis of both AM & FM by using spectrum analyzer. GUI
makes the working of AM & FM easy to understand for students by observing simply the
variation in the waveforms by varying different parameters.
FUTURE SCOPE
The future scope of this paper is that as we have analyzed the amplitude and frequency
modulation in simulink, spectrum and GUI. so, the variation in the waveforms and signals
can be observed by varying different parameters like modulating frequency, carrier frequency
So it can help in implementing these modulations and also to study the modulation to get the
complete knowledge about it and performing various operations so that it can used for
various applications like slope detector, sound mixing and for the broadcasting purpose too as
described below.
Broadcasting: Nowadays everywhere digital signal transmission is more preferred over analog signal transmission. Still even today there are few applications which uses analogue.
Amplitude modulation is still widely used for broadcasting on long, medium and short bands.
AM is easy to demodulate and hence the radio receivers able to modulate and demodulate are
cheaper and simple to produce.
REFRENCES
1. Oborkhale Lawrence, Iroegbu Chibuisi,” FM Modelling and Simulation of Frequency
Modulated Radio Channel Using Matlab and Simulink” Journal of Multidisciplinary
Engineering Science and Technology (JMEST) April – 2015; 2(4): 3159-0040.
2. George kennedy “Digital communication systems”, Mcgraw Hill 5th edition
3. www.Mathwork.com
4. MATLAB GUI TUTORIAL” by Dr. S. S. Limaye
5. M. Boulmalf, Y. Semmar, A. Lakas, and K. Shuaib,”Teaching Digital and Analog
Modulation to Undergradute Information Technology Students Using Matlab and
Simulink”, IEEE EDUCON Engineering 2010 – The Future of Global Learning