AN ECONOMIC ANALYSIS OF TIME-BASED DEMAND RESPONSE
PROGRAMS AND FACTS DEVICES IMPLEMENTATION FOR
CONGESTION MANAGEMENT
Abdullah Asuhaimi Bin Mohd Zin, Mehdi Moradi and Azhar Bin Khairuddin
Faculty of Electrical Engineering, Universiti Teknologi Malaysia (UTM), Johor, Malaysia E-Mail: [email protected]
ABSTRACT
This paper explores the utilization of combination of Alternating Current Transmission System (FACTS) devices, time-based Demand Response (DR) programs, and Generation Redispatch (GR) in short-term congestion management as well as minimization of generation costs in power systems. To achieve this, a multi-stage market clearing procedure is formulated. At the first stage, the market is cleared based on generation cost minimization, without considering network constraints. Market clearing formulation for the second stage is developed considering congestion, in which FACTS device (Thyristor Controlled Series Capacitor (TCSC)), and time-based DR programs (Time of Use (TOU)) are optimally coordinated with GR in the presence of network constraints, to manage congestion at minimum costs. In addition, to make conditions more realistic, operational conditions spanning for a day (24 hours) are considered in this study. Then capabilities of these approaches in different scenarios for congestion management as well as minimization of generation costs are examined on IEEE 14-bus system. Results show that although, applications of time-based DR programs are more effective as compared to other approaches in terms of generation cost reduction but they have limited capability for congestion management due to consumption of responsive loads which usually decreases in one period and increases in another.
Keywords: congestion management, generation redispatch, FACTS devices, time-based demand response programs, generation cost.
1. INTRODUCTION
Obsolescence of conventional power systems and development of competitive markets have engendered numerous challenges; congestion occurrence is one of the most important challenges that are encountered. Development and construction of transmission lines is the long-term essential solution for congestion [1, 2]. This solution, however, is complemented by environmental issues in addition to enormous expenses. Short-term solutions include re-scheduling of contracts, generation redispatch, and even, load shedding in critical conditions [3]. Besides being costly, these methods escalate the prices by disrupting the market. Nonetheless in certain cases, some control devices such as FACTS etc. are available that offer low operation costs. On the other hand, further availability of smart network infrastructures affords system operators with additional facilities called DR programs, which can be utilized for alleviation of congestion problem [4].
The following procedure is normally performed in restructured power systems by holding one-sided or two-sided pool electricity markets: Independent System Operator (ISO) maximizes social welfare (in two-sided auctions) or minimizes generation costs (in one-sided auctions) after receiving production offers from suppliers and consumption offers from responsive loads (in two-sided auctions) or through assuming fixed consumption (in one-sided auctions) [5]. Accordingly, as market economic equilibrium point is acquired, then the generation value of generators and consumption value of responsive loads are determined in the time interval for which the market has been formed [6]. However, because the respective
energy transmission system, such operations are sometimes impossible owing to physical restrictions in transmission lines and networks. To resolve this problem
commonly referred to as “congestion management” in
electricity market contexts, the ISO -possessing available options in generation side, consumption side and also in transmission system- would be able to design a strategy such that the network constraints are observed with minimal reduction in social welfare or increase in the generation cost depending on market type [7]. Consequently, energy transmission becomes possible as such. These options may include GR in generation side, FACTS devices in transmission system, and DR programs in the load side. In order to have optimal utilization of available facilities for congestion management, system operator must choose and apply the best scenario considering economic, technical, and environmental aspects from models incorporating their impact on congested lines and analysis of different scenarios resulting from parameter combination affecting model responses [8].
However, based on previous investigations [9, 10], implementation of FACTS devices and DR programs for congestion management has been studied for limited time domain (only one hour) independently without considering realistic issues. On the other hand, no such investigation is performed dealing with simultaneous application of these devices for longer time domain (24 hours) considering operation issues.
addition, market clearing formulation is also developed in this paper to coordinate both FACTS device and time-based DR programs through constrained optimization, to achieve congestion management at minimum cost. Furthermore, no-load cost, start-up cost, shut-down cost, minimum up-time, minimum down-time, ramp up rates, ramp down rates, daily network loads for full day, change in responsive load power consumption in DR programs are considered in mathematical market clearing model to bring it more closer to reality. This paper presents an evaluation tool which can be used by the market operator in decision making on how to manage power system congestion.
1.1. Paper organization
The rest of this paper is organized as follows: sections 2 and 3 are respectively devoted to brief description of FACTS devices and DR programs. Mathematical model of day-ahead market is proposed based on Unit Commitment (UC) scheduling in section 4. Moreover in section 5, the proposed model is numerically implemented on 14-bus IEEE test system. Finally, section 6 incorporates the conclusions.
2. FACTS DEVICES
This technology is based on application of controllable-power electronic devices enabling transmission systems to utilize these systems proportional to their thermal capacities by controlling three main parameters (impedance, voltage amplitude and angle) [11]. In general, FACTS devices can be divided into four major categories considering their way of connection to the network [12]:
a) Series controllers b) Parallel controllers
c) Series-series hybrid controllers d) Series-parallel hybrid controllers
When FACTS devices are implemented to control current or power or damp the oscillations, series controllers will be more powerful and cost-effective than parallel ones (with equal MVA values). Nonetheless, parallel controllers are more suitable for voltage control at their connection point to the network (or around their connection points) [12].
According to above discussions, in terms of technical and economic assessments, series FACTS devices are the best choices among a variety of FACTS devices to resolve congestion problem in transmission system. Meanwhile, TCSC is one of the best options for the aforementioned objective, owing to their flexible and smooth control of line impedance and high responsivity. Effective application of these devices could lead to alleviation of line congestions, and a consequent, improvement in system security margin [13]. This device will be modeled in the following section.
2.1. TCSC static model
Impedance model can be utilized for static modeling of TCSC. In the impedance model, as observed
in Figure 1, TCSC is considered as a series static reactance (-jxc) between n1 and n2 buses. This causes the system Ybus matrix to change[14].
Figure-1. TCSC impedance model.
Ybus matrix changes after TCSC installation in n1n2 line as below:
2 1 1 1 1
1 nn
Old n n New
n
n Y Y
Y (1)
2 1 2 1 2
1 nn
Old n n New
n
n Y Y
Y (2)
2 1 2 2 2
2 nn
Old n n New
n
n Y Y
Y (3)
Where
2 2
2
2
2 2 2 1 2 1 2 1 2 1 2 1 2 1 2 1 2 1 2 1 2 1 2 c n n n n n n n n n n c n n n n c n n c n n c n n x x r x r x x x r x x x r x Y
(4)
Generally, network congestions can be divided into reactive congestions (including load bus voltages exceeding the permissible values) and active congestions (including the higher power flow in transmission lines and transformers from the permissible limits).
Reactive congestions are usually assumed to be independent of active congestions due to special features of reactive power. Thus, reactive congestion is removed locally (for instance using tap changing transformers). However, if reactive congestions are not regularly resolved, then the operator provides the reactive power needed for congestion removal from the ancillary service market with the minimum cost based on bids received from local producers (capacitive banks or synchronous condensers).
As a matter of fact, active congestions are the most prevalent congestion type in the network and are directly related to electricity energy program for purchase and sale which is regulated by the operator.
nn mm nm
p m n n m n n n n n p p l X X X x X X X X x x LDF , , , , , , , , 2 2 1 2 1 1
(5)
By considering the fact that LDF sensitivity factors are representing flow variation in a line which is caused by change in another line flow. Therefore, the line with smallest positive LDF factor compared to the congested line(s) will be the optimal place for TCSC installation because increase in respective line flow leads to maximum reduction in the flow(s) of congested line(s).
3. DEMAND RESPONSE PROGRAMS
Enhancement of load’s participation in the restructured markets is the prime purpose of DR programs implementation. These programs can be divided into two general categories based on application policies [16]:
Incentive-based programs
Time-based programs
In this study, TOU (Time of Use) program has been chosen, representing time-based DR programs, to investigate the impact of time-based DR programs for congestion management in the presence of FACTS devices.
An elasticity-based model can be used to model DR programs [17]. The mathematic model of responsive loads, after TOU application, is given in the following Equation in relation to prices with the optimal benefit of consumers [17]:
T
t t Ln E d d T t t t t t t t ,..., 2 , 1 , 1 2 1 0 , 0 2 2 2 2
(6)In time-based DR programs, electricity price ()
is different from the primary price (0) in peak, off-peak
and low-peak periods.
3.1. Optimal place of responsive demand
GSFs sensitivity coefficients can be used to determine the optimal placement of responsive loads. These coefficients are derived from DC load flow and can be calculated by the following equation [18]:
n k n k
l k
l X X
x
GSF, , ,
2 1
1
(7)
In reality, GSF sensitivity factors represent flow variation in a line resulted from alterations in the power injected into a bus. Accordingly, the bus with the largest negative GSF factor compared to the congested line(s) will be the best place for responsive load(s). In other words, reduction of consumed power in the respective bus (equivalent increase of injected power in the same bus) leads to maximum reduction in the flow(s) of congested line(s).
4. MARKET CLEARING FORMULATION
In unilateral market, which is considered in this study, the operator receives complex bids from participants. These bids include offers to sell electric energy, data such as no-load, start-up, and shut-down costs, minimum hours of being ON or OFF, and ramp rates associated with generation units. Subsequently, the operator regulates the UC considering hourly network load whereas neglecting the network and power flow constraints[19].
Consequently, the economic equilibrium point is achieved for each hour. During the second stage, the market is cleared with minimum generation cost meant for congestion management, considering network constraints as well as congestion probability. This is accomplished through FACTS devices, time-based DR programs, and GR.
Hence, operator performance can be modeled with minimum generation cost based on UC considering network and load flow constraints along with GR in the presence of FACTS devices and DR programs.
T t g g g g g g N n L l g g g g g p t n sd n SDC t n su n SUC t n u n NLC t l n P t l n G g G g g 1 , , , , , , ,min (8)
T
t1,2,...,
Subject to:
ng lg t
Pgoffer
ng lg t
ung tpg , , , , ,
(9)
n l t
P
n un tP g L l g Min g g g g G g , , ,
(10)
n l t
P
n un tP g L l g Max g g g g G g , , ,
(11)
gL l g g g g g
g n l t P n l t RDn
P G g
, , 1 , ,
g L l g g g g gg n l t P n l t RUn
P G g
, , , , 1(13)
n t
DT
n t sun tDT g, 1 g, g, (14)
n t
UT
n t sdn tUT g, 1 g, g, (15)
n ,t sdn ,t un ,t un ,t1
su g g g g (16)
n,t 0 ;nref (17)
n1,n2
n2,t n2,t
P
n1,n2
B Max
(18)
n1,n2
n1,t n2,t
P
n1,n2
B Max
(19)
G g G g N n L l g g g n l t
P , ,
D d N n d dr d d d d
d n t CF n P n t P n t
P , , ,
(20)
nl t
P
nt
CF
n P
nt P
nt
B
nn
nt n t
P N n L l dr d d g g G g , , , , , , , , 2 1 2 2
ref n ; Max TCSC TCSC MinTCSC K K
K
(22)
Here, Equation (8) represents the objective function of optimization problem which incorporates the costs associated with electrical energy like energy purchase, no-load, start-up and shut-down costs of generation units. Equation (9) indicates the upper limit of purchasable blocks of electrical energy; Equations (10) and (11) exhibit constraints of maximum and minimum energy that can be generated by the participating units while, Equations (12) and (13) pertain to constraint of maximum ramp-down and ramp-up rates of participating units. Equations (14) and (15) show the constraints of minimum down and up-times of participating units. Equation (16) represents a logical relation between binary variables in the optimization problem. Equation (17) describes zero voltage angle in the reference bus of the network, and, Equations (18) and (19) are indicating the constraints of maximum transmissible flows through the network lines in KW. Equation (20) dictates the equality constraint of electrical energy generation and demand, and Equation (21) represents DC power flow equation. Finally Equation (22) reflects the limits associated with compensation level of line reactance by TCSC.
5. RESULTS AND DISCUSSIONS
The details of the multi-stage market clearing procedure with congestion management are summarized in the flowchart in Figure-2. The problem is formed and solved with four scenarios
a) Scenarios 1: In the absence of FACTS devices and time-based DR programs. In this case, TCSC and TOU are not considered for congestion management. b) Scenarios 2: In the presence of FACTS devices but
without time-based DR programs.
c) Scenarios 3: In the presence of time-based DR programs but without FACTS devices.
d) Scenarios 4: In the presence of FACTS devices and time-based DR programs simultaneously.
The proposed method has been tested on the modified IEEE 14-bus test system consisting of 4
generator buses and 11 load buses as shown in Figure-A-1 in appendix. The simulation model has been built in GAMS environment. The MIP problem has been solved by using DICOPT solver built in IBM ILOG CPLEX 12.2 which is released on the branch-and-cut method [20].
Since, time-based DR programs are dependent on price elasticity of demand of the participants; the elasticity values considered in this work are shown in Table-1.
Receiving generators bids and
network’s load information by ISO
violation ? Market clearing without considering
network constraints
Selecting the minimum generation costs
Finalizing the market Analyzing network congestion
and voltage profile
Yes
No Managing congestion by applying
GR, FACTS devices, and time-based DR programs
Figure-2. The multi-stage market clearing procedure.
Table-1. Elasticity of demand.
Low Off-Peak Peak
Low -0.09 0.02 0.015
Off-Peak 0.02 -0.09 0.012
Moreover, peak, off-peak and low period hours in these programs are considered according to the network 24-hour load as written below:
Table-2. Time periods.
Low Off-peak Peak
00:00- 07:59
08:00 16.59 and 22:00 -23:59
17:00- 21:59
5.1. Day-ahead market settlement without considering the network (stage 1)
Market settlement process is established in this stage without considering the network and power flow constraints in order to obtain the market economic equilibrium point at each hour. In this stage, the generation cost of units during 24 hours equals 365226.51 (US$). Rest of the results is presented in Table-3.
Table-3. Generation values of units (MWh).
Hour Generator No.
1 2 3 4
1 17.00 102.00 140.00 0.00
2 0.00 104.60 140.00 0.00
3 0.00 91.40 140.00 0.00
4 0.00 86.20 140.00 0.00
5 0.00 82.40 140.00 0.00
6 0.00 80.00 140.00 0.00
7 0.00 86.30 140.00 0.00
8 0.00 104.70 140.00 0.00
9 0.00 148.70 140.00 0.00
10 0.00 110.00 140.00 58.40
11 0.00 110.00 140.00 71.30
12 0.00 110.00 140.00 76.80
13 0.00 110.00 140.00 74.10
14 0.00 110.00 140.00 70.40
15 0.00 110.00 140.00 67.30
16 0.00 110.00 140.00 64.90
17 0.00 110.00 140.00 69.80
18 0.00 110.00 140.00 81.40
19 0.00 110.00 140.00 84.60
20 0.00 110.00 140.00 86.70
21 0.00 110.00 140.00 91.80
22 0.00 110.00 140.00 74.20
23 0.00 109.90 140.00 55.00
24 0.00 138.30 140.00 0.00
While, applying the results obtained during this stage, power flow computations are performed on the network under study. Comparing the line flows with their thermal capacities, it is observed that the power transmitted through line 13-6 has exceeded the maximum transmissible flow through this line (30 KW), resultantly, the respective line is congested. According to Table-4, these congestion hours mainly occur during the peak and occasionally in off-peak hours and even in the low-load interval.
Table-4. Flow through line 13-6 (MW).
Hour Line flow Hour Line flow
1 31.39 13 30.86
2 30.64 14 30.86
3 29.81 15 30.98
4 29.25 16 30.53
5 29.01 17 30.31
6 29.06 18 30.39
7 29.89 19 30.81
8 31.38 20 31.69
9 33.53 21 30.79
10 31.34 22 31.20
11 31.19 23 31.07
12 31.17 24 32.99
5.2. Day-ahead market settlement, considering the network (stage 2)
Keeping in mind the results of the former stage, it is observed that electrical energy transmissions are unattainable at certain hours due to congestion occurrence. Thus, efforts are made to solve this particular problem for short-term congestion management in the same network by considering four scenarios based on the presence or absence of FACTS devices and time-based DR programs.
5.2.1. In the absence of FACTS devices and time-based DR programs (Scenario 1)
Table-5. The generations re-dispatch values of units with respect to the market equilibrium point (MWh).
Hour Generator No.
1 2 3 4
1 0.00 -42.00 0.00 42.00
2 0.00 6.25 -6.25 0.00
3 0.00 0.00 0.00 0.00
4 0.00 0.00 0.00 0.00
5 0.00 0.00 0.00 0.00
6 0.00 0.00 0.00 0.00
7 0.00 0.00 0.00 0.00
8 0.00 -44.70 0.00 44.70
9 0.00 -58.40 0.00 58.40
10 0.00 -22.09 0.00 22.09
11 0.00 -19.73 0.00 19.73
12 0.00 -19.38 0.00 19.38
13 0.00 -14.14 0.00 14.14
14 0.00 -14.22 0.00 14.22
15 0.00 -16.16 0.00 16.16
16 0.00 -8.69 0.00 8.69
17 0.00 -5.06 0.00 5.06
18 0.00 -6.50 0.00 6.50
19 0.00 -13.34 0.00 13.34
20 0.00 -4.69 -8.61 13.30
21 0.00 -5.37 -2.83 8.20
22 0.00 -19.90 0.00 19.90
23 0.00 -17.69 0.00 17.69
24 0.00 -55.00 0.00 55.00
According to Tables 3 and 5, it can be seen that unit 4, initially in the OFF state, is switched ON for alleviating congestion in the network.
5.2.2. In the presence of FACTS devices (Scenario 2) In this scenario besides GR, series FACTS devices are used for short-term congestion management of the network due to their high efficiency in this regard, Hence, TCSC a representative of FACTS devices is considered here.
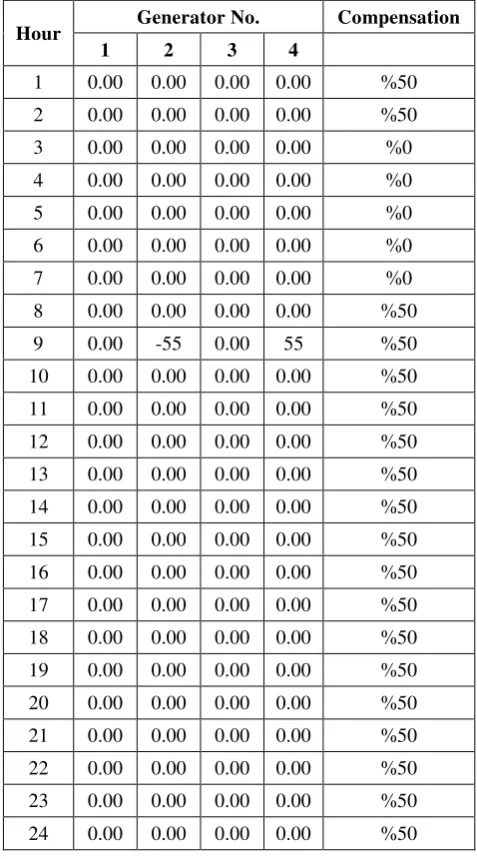
[image:6.595.307.546.135.565.2]Implementing TCSC in line 6-12 (the best place for TCSC presence with respect to LDFs), generation cost in 24 hours equals 365250.61 (US$) due to 50% compensation capability of line reactance. In this scenario, generations re-dispatch values of units and line compensation levels by means of TCSC are shown in Table-6.
Table-6. Generation re-dispatch values and TCSC compensation (%) with respect to market
equilibrium point (MWh).
Hour Generator No. Compensation
1 2 3 4
1 0.00 0.00 0.00 0.00 %50
2 0.00 0.00 0.00 0.00 %50
3 0.00 0.00 0.00 0.00 %0
4 0.00 0.00 0.00 0.00 %0
5 0.00 0.00 0.00 0.00 %0
6 0.00 0.00 0.00 0.00 %0
7 0.00 0.00 0.00 0.00 %0
8 0.00 0.00 0.00 0.00 %50
9 0.00 -55 0.00 55 %50
10 0.00 0.00 0.00 0.00 %50
11 0.00 0.00 0.00 0.00 %50
12 0.00 0.00 0.00 0.00 %50
13 0.00 0.00 0.00 0.00 %50
14 0.00 0.00 0.00 0.00 %50
15 0.00 0.00 0.00 0.00 %50
16 0.00 0.00 0.00 0.00 %50
17 0.00 0.00 0.00 0.00 %50
18 0.00 0.00 0.00 0.00 %50
19 0.00 0.00 0.00 0.00 %50
20 0.00 0.00 0.00 0.00 %50
21 0.00 0.00 0.00 0.00 %50
22 0.00 0.00 0.00 0.00 %50
23 0.00 0.00 0.00 0.00 %50
24 0.00 0.00 0.00 0.00 %50
According to Table-6, generation re-dispatch value in this scenario is 55 (MW) per 24 hours with respect to stage 1 (5.1), suggesting a reduction of 349.7 (MW) as compared to scenario1 (5.2.1). Furthermore, Table 3 implies that unit 4 (which was initially in the OFF state) is switched ON only at hour 9 in this state to alleviate congestion in the network. On the contrary, this unit had been switched ON at hours 1, 8, 9 and 24 in scenario 1(5.2.1).
5.2.3. In the presence of time-based DR programs (Scenario 3)
Table-1. Also, the participation percentage of participants in this program equals 50%. The initial electricity price is considered 60 ($/MWh) and Price data related to TOU is presented in Table (A-4) as shown in appendix.
Implementation of TOU programs in buses 13 and 14 (the best places for responsive loads presence with
respect to the GSFs) facilitates to observe that the generation cost in 24 hours for implementing this program together with GR equals 365414.26 (US$). Generations redispatch values of units and consumption variations of responsive demands are according to Table 7 as shown.
Table-7. Generation re-dispatch values and responsive loads consumption variation with respect to market equilibrium point (MWh).
Hour Generator No. Bus No.
1 2 3 4 13 14
1 0.00 -42.00 0.00 43.29 0.61 0.68
2 0.00 -44.60 0.00 45.85 0.59 0.66
3 0.00 4.41 -3.22 0.00 0.56 0.62
4 0.00 1.14 0.00 0.00 0.54 0.59
5 0.00 1.12 0.00 0.00 0.53 0.59
6 0.00 1.12 0.00 0.00 0.53 0.59
7 0.00 5.17 -4.00 0.00 0.55 0.61
8 0.00 -44.70 0.00 45.97 0.60 0.67
9 0.00 -56.35 0.00 55.00 -0.64 -0.71
10 0.00 -12.94 0.00 11.49 -0.69 -0.76
11 0.00 -10.24 0.00 8.74 -0.71 -0.79
12 0.00 -9.71 0.00 8.18 -0.73 -0.80
13 0.00 -4.77 0.00 3.29 -0.70 -0.78
14 0.00 -4.96 0.00 3.49 -0.70 -0.77
15 0.00 -6.90 0.00 5.44 -0.70 -0.77
16 0.00 0.00 0.00 -1.40 -0.67 -0.73
17 0.00 0.00 0.00 -1.38 -0.66 -0.72
18 0.00 0.00 0.00 -1.23 -0.58 -0.65
19 0.00 -5.16 0.00 3.87 -0.61 -0.68
20 0.00 -12.13 -2.58 13.30 -0.67 -0.74
21 0.00 -4.40 0.00 3.04 -0.65 -0.71
22 0.00 -11.47 0.00 10.14 -0.63 -0.70
23 0.00 -8.43 0.00 6.96 -0.70 -0.77
24 0.00 -56.38 0.00 55.00 -0.66 -0.73
According to Table-7, Generation redispatch value in this scenario with respect to stage 1 (5.1) is 342.5 (MW) in 24 hours indicating a reduction of 62.2 (MW) compared to scenario 1(5.2.1).
5.2.4. In the presence of FACTS devices and incentive- based DR programs (Scenario4)
In this scenario, in addition to GR, FACTS device and time-based DR programs are simultaneously exercised for short-term network congestion management.
Table-8. Generation re-dispatch values, responsive loads consumption variation, TCSC compensation respect to market equilibrium point (MWh).
Hour Generator No. Bus No. TCSC Compensation
1 2 3 4 13 14
1 0.00 1.29 0.00 0.00 0.61 0.68 %50
2 0.00 1.25 0.00 0.00 0.59 0.66 %50
3 0.00 1.19 0.00 0.00 0.56 0.62 %50
4 0.00 1.14 0.00 0.00 0.54 0.59 %0
5 0.00 1.12 0.00 0.00 0.53 0.59 %0
6 0.00 1.12 0.00 0.00 0.53 0.59 %0
7 0.00 1.17 0.00 0.00 0.55 0.61 %50
8 0.00 1.27 0.00 0.00 0.60 0.67 %50
9 0.00 -1.35 0.00 0.00 -0.64 -0.71 %50
10 0.00 0.00 0.00 -1.45 -0.69 -0.76 %50
11 0.00 0.00 0.00 -1.50 -0.71 -0.79 %50
12 0.00 0.00 0.00 -1.53 -0.73 -0.80 %50
13 0.00 0.00 0.00 -1.48 -0.70 -0.78 %50
14 0.00 0.00 0.00 -1.46 -0.70 -0.77 %50
15 0.00 0.00 0.00 -1.46 -0.70 -0.77 %50
16 0.00 0.00 0.00 -1.40 -0.67 -0.73 %0
17 0.00 0.00 0.00 -1.38 -0.66 -0.73 %0
18 0.00 0.00 0.00 -1.23 -0.58 -0.65 %0
19 0.00 0.00 0.00 -1.29 -0.61 -0.68 %50
20 0.00 0.00 0.00 -1.40 -0.67 -0.74 %50
21 0.00 0.00 0.00 -1.36 -0.65 -0.71 %50
22 0.00 0.00 0.00 -1.33 -0.63 -0.70 %50
23 0.00 -1.46 0.00 0.00 -0.70 -0.77 %50
24 0.00 -1.38 0.00 0.00 -0.66 -0.73 %50
According to Table-8, Generation re-dispatch value in this scenario is 16 (MW) per 24 hours with respect to stage 1 (5.1), suggesting a reduction of 388.7 (MW) compared to scenario 1(5.2.1) and an increment of 39 (MW) compared to scenario 2(5.2.2). This incremental value can be justified as follows: since the congested hour (i.e. 9) lies in off-peak hours category, besides generation cost per 24 hours in this scenario is 787.19 ($) lower than scenario 1(5.2.1). Accordingly, implementation of TOU program with load shift and reduction in different time intervals will cause greater congestion at hour 9 and load reduction at peak hours. As a consequence, it mainly reduces generation cost instead of relieving congestions.
For better comparison of different integrations which were discussed earlier generation costs as well as total generation re-dispatch values per 24 hours for all scenarios can be observed in Figures 3 and 4.
Figure-4. Total generation re-dispatch values in 24 hours (MW).
From Figures 3 and 4, it can be seen that series FACTS devices (TCSC) is a suitable tool for the removal of congestion, reduction of generation costs and generation re-dispatch values (with respect to market equilibrium point), due to the fact that this device can reduce the transmitted power in the congested line. In addition its operation cost is normally inconsequential and almost negligible. In contrast, time-based DR programs (TOU ) are more effective in terms of load reduction and a consequent reduction in, generation cost but with a limited capability for congestion removal due to consumption of responsive loads which usually decreases in one period and increases in another. Moreover, congestion might occur at different hours which may lie within peak, off-peak or even low-load intervals. On the contrary, application of series FACTS devices (TCSC) can lower congestion regardless of its occurrence hour.
6. CONCLUSIONS
Congestion management and minimization of generation cost are significant issues in deregulated power systems. In this study, a multi-stage model is proposed based on the combination of TCSC, TOU, and GR, to investigate the efficacy of FACTS devices and time-based DR programs in short-term transmission congestion management as well as optimization of generation costs. Besides, realistic issues such as no- load cost, start-up cost, shut-down cost, up-time, down time, ramp up, ramp down, network load during 24 hours and change in power consumption of participants in DR programs are considered.
Results show that when the objective is removal of congestion and reduction of generation costs along with generation re-dispatch values (with respect to market equilibrium point), subsequently, TCSC (FACTS devices) is a more suitable choice for the purpose as this device can reduce transmitted power in the congested line.
Additionally, its operation cost is almost negligible. In contrast, TOU (time-based DR programs) is
generation cost reduction but has the limitation of restricted capability for congestion removal because consumption of responsive loads usually decreases in one period and increases in another. Over and above congestion is haphazard and might occur at different hours such that these hours may lie within peak, off-peak or even low-load intervals. On the contrary, application of TCSC (FACTS devices) can lower congestion regardless of its occurrence hour.
REFERENCES
[1] J. Zhu. 2015. Optimization of power system operation: John Wiley and Sons.
[2] A. A. M. Zin, M. Moradi, A. Khairuddin, A. Naderipour, and A. H. Khavari. 2015. Estimation of elasticity of electricity demand in Iran: New empirical evidence using aggregate data. in 2015 IEEE Student Conference on Research and Development (SCOReD). pp. 710-715.
[3] K. Hausken and J. Zhuang. 2015. Game Theoretic Analysis of Congestion, Safety and Security. 2015.
[4] D. Brodén, C. Sandels and L. Nordström. 2015. Assessment of Congestion Management Potential in Distribution Networks using Demand-Response and Battery Energy Storage. in Innovative Smart Grid Technologies, February 17-20, 2015 Washington DC, USA.
[5] G. Dutta and K. Mitra. 2015. Dynamic Pricing of Electricity: A Survey of Related Research. Indian Institute of Management Ahmedabad, Research and Publication Department.
[6] J. N. Tsitsiklis and Y. Xu. 2015. Pricing of fluctuations in electricity markets. European Journal of Operational Research.
[7] J. Bertsch, S. Hagspiel and L. Just. 2015. Congestion management in power systems.
[8] K. Vijayakumar. 2015. Congestion management in deregulated power systems.
[9] A. Pillay, S. P. Karthikeyan, and D. Kothari. 2015. Congestion management in power systems-A review. International Journal of Electrical Power and Energy Systems. 70: 83-90.
Line Bottleneck in Deregulated Power Systems. in Applied Mechanics and Materials. pp. 124-128.
[11]R. Khatter, N. Yadav, and T. Kaul. 2015. Power Flow Control using FACTS Devices. Power. Vol. 4.
[12]F. M. Albatsh, S. Mekhilef, S. Ahmad, H. Mokhlis and M. Hassan. 2015. Enhancing power transfer capability through flexible AC transmission system devices: a review. Frontiers of Information Technology and Electronic Engineering. 16: 658-678.
[13]S. Sreejith, S. P. Simon, and M. Selvan. 2015. Analysis of FACTS devices on Security Constrained Unit Commitment problem. International Journal of Electrical Power and Energy Systems. 66: 280-293.
[14]S. Kamel, F. Jurado and Z. Chen. 2015. Power flow control for transmission networks with implicit modeling of static synchronous series compensator. International Journal of Electrical Power and Energy Systems. 64: 911-920.
[15]M. Dorostkar-Ghamsari, M. Fotuhi-Firuzabad, F. Aminifar, A. Safdarian, and M. Lehtonen. 2015. Optimal distributed static series compensator
placement for enhancing power system loadability and reliability. Generation, Transmission and Distribution, IET. 9: 1043-1050.
[16]G. Gutiérrez-Alcaraz, J. Tovar-Hernández and C.-N. Lu. 2016. Effects of demand response programs on distribution system operation. International Journal of Electrical Power & Energy Systems. 74: 230-237.
[17]H. Aalami, M. P. Moghaddam, and G. Yousefi. 2015. Evaluation of nonlinear models for time-based rates demand response programs. International Journal of Electrical Power and Energy Systems. 65: 282-290.
[18]C. Duthaler, M. Emery, G. Andersson and M. Kurzidem. 2008. Analysis of the use of Power Transfer Distribution factors (PTDF) in the UCTE transmission grid. in Power System Computation Conference.
[19]A. Lotfjou, M. Shahidehpour, Y. Fu, and Z. Li. 2010. Security-constrained unit commitment with AC/DC transmission systems. Power Systems, IEEE Transactions on. 25: 531-542.
Appendix
Notation
G
N Number of participating generators
D
N Number of responsive loads
DR
N Number of responsive loads participating in DR program
G
L Number of blocks offered by generators
n tu g, Binary variable representing ON/OFF state of unit ng at hour t
n tsu g, Binary variable representing start-up state of unit ng at hour t
n tsd g, Binary variable representing shut-down state of unit ng at hour t
ngNLC No-load cost of unit ng
ngSUC Start-up cost of unit ng
ngSDC Shut-down cost of unit ng
ng lg t
pg , ,
Price offered by unit ng to generate in block lg at hour t
n l t
Pgoffer g,g, Active power offered by unit ng to generate in block lg at hour t
n l t
Pg g, g, Active power generated by unit ng in block lg at hour t
gMin
g n
P Minimum power output of unit ng
gMax
g n
P Maximum power output of unit ng
n t
Pd d, Active power demand of responsive load nd at hour t
n t
Pdr dr, Active power demand of responsive load ndr at hour t after participating in DR program
ngRD Ramp-down rate of unit ng
ngRU Ramp-up rate of unit ng
n tDT g, Down-time of unit ng until hour t
n tUT g, Up-time of unit ng until hour t
n1,n2
PMax Maximum transmissible power flow through the line between buses n1 and n2
n,t Voltage angle of bus n at hour t
n1,n2
B Element (n1, n2) in Susceptance matrix of DC power flow ref System reference bus
ndrCF Contribution factor of responsive load ndr in DR program
TCSC
K Compensation factor of line reactance by means of TCSC
Min TCSC
K Minimum compensation factor of line reactance by means of TCSC
Max TCSC
K Maximum Compensation factor of line reactance by means of TCSC
old n n Y
2
1 Element n1n2 of system Ybus matrix before TCSC installation New
n n Y
2
1 Element n1n2 of system Ybus matrix after TCSC installation
2 1n n Y
Change in element n1n2 of system Ybus matrix after TCSC installation
ttE , Self-elasticity of responsive loads at hour t
t,t2E Cross-elasticity of responsive loads between hours t, t2
t Electricity energy price at hour t
t 0 Initial electricity energy price at hour t
td Demand value at hour t
td0 Initial demand value at hour t
p l
LDF, Line Distribution Factor of
Line l with respect to line p
l
x Reactance of line l between buses n1,n2
k l
GSF, Generation Shift Factor of Line l with respect to bus k
t n
X , Element (n,t) in reactance matrix of DC power flow
A.2. Network under study
Figure-A-1. Modified IEEE 14-bus network.
Table-A-1. Transmission lines data.
Line number From bus To bus � �. �. ���� ��
1 1 2 0.05917 50
2 1 5 0.22304 50
3 2 3 0.19797 85
4 2 4 0.17632 50
5 2 5 0.17388 50
6 3 4 0.17103 80
7 4 5 0.04211 75
8 4 7 0.20912 60
9 4 9 0.55618 30
10 5 6 0.25202 80
11 6 11 0.19890 50
12 6 12 0.25581 30
13 6 13 0.13027 30
14 7 8 0.17615 100
15 7 9 0.11001 50
16 9 10 0.08450 40
17 9 14 0.27038 30
18 10 11 0.19207 50
19 12 13 0.19988 20
Table-A-2. Data related to network generators.
Generator No. 1 2 3 4
Bus No. 1 2 6 8
Min producible power (MWh) 17 12 14 11
Max producible power (MWh) 200 150 140 120
Max ramp-down rate (MW/h) 140 120 90 80
Max ramp-up rate (MW/h) 100 70 78 62
No-load cost ($) 300 300 300 300
Start-up cost ($) 60 69 150 90
Shut-down cost ($) 15 18 30 24
Min up-time (h) 4 3 5 4
Min down-time (h) 3 3 4 3
Initial state of production (MWh) 80 60 50 40
Initial up-time state (h) 3 14 17 9
Initial down-time state (h) 0 0 0 0
Table-A-3. The data related to generators’ offers.
Generator No.
Active power offered for generating in each block (MWh)
Price offered for generating in each block ($/MWh)
1 80 70 50 64.80 73.80 81
2 60 50 40 53 58.50 63
3 50 45 45 41 42.90 44.70
4 55 35 30 56.65 59.35 61.30
Table-A-4. Electricity price in each period ($/MWh).
Peak Off-Peak
Low Electricity price
60 60
60
Before TOU
75 65
55